A 2.60pJ/Inst Subthreshold Sensor Processor for Optimal Energy Efficiency Bo Zhai, Leyla Nazhandali, Javin Olson, Anna Reeves, Michael Minuth, Ryan Helfand, Sanjay Pant, David Blaauw and Todd Austin University of Michigan, Ann Arbor, MI Abstract A 2.6pJ/Inst subthreshold sensor processor designed for energy efficiency has been fabricated. A two-stage micro-architecture was implemented to mitigate the impact of process variation in subthreshold operation. Careful library cell selection and robust SRAM design enabled fully functional operation from 1.2V to 200mV. We analyze the variation in frequency and optimal voltage and evaluate the need for adaptive control. The processor reaches maximum energy efficiency at 360mV, consuming 2.6pJ/Inst at 833kHz. The minimum energy consumption of the core marks a 10X improvement over previous sensor processors at the same MIPS.
1. Introduction Subthreshold circuit operation is a compelling method for ultralow power sensor applications. In previous work [1], we demonstrated the existence of a so-called minimum energy voltage (Vmin) where CMOS logic reaches maximum energy efficiency per operation. This occurs when leakage and dynamic energy are comparable. Scaling the supply voltage below Vmin ceases to reduce energy per operation due to the dominance of leakage in this voltage regime, combined with the exponential increase of circuit delay with Vdd. Several previous subthreshold circuits [2][3] were presented. However, to our knowledge this paper presents the first silicon implementation and measurement of a general purpose sensor processor (referred to as the Subliminal processor) specifically optimized for energy efficient subthreshold operation.
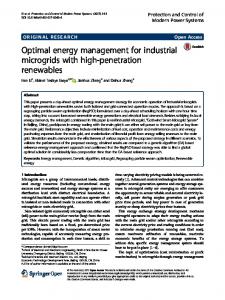
2. Implementation for Optimal Energy Efficiency For high energy efficiency in subthreshold operation, a CISC micro-architecture [4] as selected, which has an 8-bit wide ALU, a 32-bit accumulator and a unified instruction and data memory. The instruction set was optimized for both good code density and low complexity which helps achieve less energy consumption. On-current variation increases significantly in subthreshold operation from 3σ/µ=69% at Vdd = 600mV to 225% at Vdd = 260mV for an individual 0.3µm wide NMOS transistor. However, in subthreshold operation the sensitivity to Leff variation is reduced and the variation due to random dopant fluctuation (RDF) dominates [5]. Due to its uncorrelated nature, RDF average out over the length of a path making shallow pipelines with high FO4 delay per stage advantageous, as shown in Figure 1. Hence, a 2 stage pipeline implementation was selected for the processor, which shows a 14% reduction in 3σ/µ of delay compared to a design with 10 FO4 delays. For efficient subthreshold operation, all gates with more than 2 fan-ins were eliminated from the library as well as all pass-transistor logic and the library was re-characterized at subthreshold voltage. We found that a processor synthesized with this dedicated subthreshold library is ~9% faster at subthreshold voltage than one with a standard library, although both have the same performance at full Vdd. This is caused by the different scaling of cell delays with Vdd. Particularly, a 20% change in the beta ratio between 1.2V and 250mV caused an 18% change in the NAND / NOR cell delay ratio. The 2kb SRAM was implemented using a custom designed, muxbased array structure. This resulted in a minimum functional voltage of 200mV, which is much lower than Vmin. Hence, reducing the minimum functional voltage further is unnecessary. A special level converter was implemented for the test harness to convert the 200mV signals to 1.2V using four differential subconverter stages as shown in Figure 2. In order to suppress process variability and improve robustness, the first two sub-converter stages
were increased in size to reduce the impact of RDF and have body bias control to compensate for global beta-ratio shift. Figure 3 shows the die photograph of the core and the memory. The test chip was fabricated in an industrial 0.13µm CMOS process with 8 layers of metal. The area of the processor core is 29817 µm2 and the area of the SRAM is 55205 µm2.
3. Measurement Results and Discussion Figure 4 shows the maximum operating frequency with Vdd for 4 chips. As expected, the operating frequency drops rapidly below Vth (~400mV). In Figure 5, we plot the energy per instruction with Vdd for one measured die. The minimum energy (Emin) occurs at ~360mV, where active energy (including short circuit current) and leakage have equal and opposite sensitivity to supply voltage, and leakage energy is ~33% of the total energy. Figure 6 shows the energy breakdown between the core and memory. Vmin for the core falls at ~280mV while that for the memory is much higher at ~400mV, due to its much lower activity rate. In Figure 7, we show the measured operating frequency distribution of 26 chips at three voltages: 600mV, 400mV and 260mV. Table 1 shows the corresponding 3σ/µ values which range from 29.6% to 85.5%. This marks a ~2.63X improvement compared to the variation of individual devices, as shown in Section 2, and is due in part to the high logic depth in the Subliminal processor. Figure 8 shows the Vmin and Emin distributions of the Subliminal processor over 26 measured chips. The Vmin ranges from 340mV to 420mV, with a mean and standard deviation of 378mV and 21.4mV, respectively (3σ/µ is 22.8%). The Emin per instruction ranges from 2.6pJ per instruction to 3.4pJ with a mean of 3.0pJ and standard deviation of 0.170pJ (3σ/µ is 16.99%). However, to obtain this minimum energy operation, each die must operated at its individual Vmin and operation frequency which requires adaptive frequency and voltage tuning of each die. Hence, in Figure 8 we also show the energy distribution when all die operate at a fixed Vdd equal to µ (Vmin) = 378mV, resulting in a mean energy µ(E) = 3.19pJ (a 6% increase) and standard deviation σ(E) = 0.21pJ (a 23% increase). This relatively small increase is the result of the low sensitivity of energy to voltage near Vmin and the relatively small variation of Vmin between different die. This leads to the useful observation that adaptive voltage tuning is only marginally beneficial for maximum energy efficiency in subthreshold operation. On the other hand, Figure 8 also shows the energy distribution when all die are operated at a fixed, worst-case (µ+3σ) frequency in which case µ(E) = 3.72pJ (a 24% increase) and σ(E) = 0.283pJ (a 66% increase). Hence, more significant energy savings are obtained by applying adaptive frequency tuning in subthreshold design. The energy consumption of four sensor application programs is shown in Figure 9. The variation in their individual energy demands was reduced in subthreshold operation due to the increased contribution of application-independent leakage current. Furthermore, the applications showed nearly identical Vmin. Finally, we compare the energy-per-instruction and MIPS of the subliminal processor with those of Hempstead [6], cleverDust [7] and SNAP/LE [8] in Figure 10. The energy consumption of memory is not included in Figure 10 because previous efforts only reported data for the core. The Subliminal processor consumes 0.86pJ per instruction at 0.04 MIPS and 1.2pJ at 0.5 MIPS which marks a more than 10X reduction compared to the previous best cleverDust processor at equal MIPS.
[5] [6] [7] [8]
References B. Zhai, et al., DAC, 2004 C.H.-I. Kim, et al., TVLSI 2003 A. Wang, et al., ISSCC 2004 L. Nazhandali, et al., ISCA 2005
B. Zhai, et al. ISLPED 2005 M. Hempstead, et al., ISCA 2005 B. A. Warneke et al., ISSCC 2004 V. Ekanayake, et al., ASPL, 2004 Vdd_high
3σ/µ(%)
Vdd_low
54 52 50 3-stage 48 46 2-stage 44 42 40 10 20 30 40 50 60 70 80
244µm
300mV
FO4 Figure 1. Delay variation with FO4 logic depth (SPICE)
200mV input
7
10
lc stage1
lc stage2
ChipA ChipB ChipC ChipD
5
10
Table 1. Measured frequency distribution of 26 chips at different supply voltages Vdd 0.260
µ (Freq) 84.66kHz
3σ / µ (Freq) 85.5%
0.400
1.529MHz
49.8%
0.600
6.759MHz
29.6%
8
Emin/Inst=2.73pJ Vmin=0.4V
6 4 2 0.2
0.3
0.4 0.5 Vdd
8 6 4 2 0
0.6 0.8 1.0 1.2 1.4 1.6 1.8
Normalized Frequency
181µm
0.7
14
Emem Ecore Etotal
12 10 8
Emin,
[email protected]
6 4 2 0
Emin,
[email protected]
0.2
0.3
0.4 0.5 Vdd
0.6
0.7
Figure 6. Energy with Vdd for the core and the memory
optimal Vmin and frequency 10 uniform Vdd=µ(Vmin) 9 uniform frequency=(µ-3σ ) 8 7 6 5 4 3 2 1 0 2.6 2.8 3.0 3.2 3.4 3.6 3.8 4.0 4.2 4.4
0.34 0.36 0.38 0.40 0.42
Vmin
Emin(pJ)
Figure 8. Vmin and Emin distribution Vdd=400mV
2.6 0.6 0.8 1.0 1.2 1.4 1.6 1.8
2.4
Energy/Cycle (pJ)
Normalized Frequency
Vdd=600mV
compression integer average data accumulation data scaling
Energy/Inst (pJ)
Chip Count
305µm
Chip Count
Chip Count
Chip Count
Vdd=260mV
0.6
Figure 5. Dynamic, static and total energy for processor with Vdd
10
Chip Count
memory
1.2V output
lc stage4
Figure 3. Die Photograph
10
0
16 14 12 10 8 6 4 2 0
lc stage3
Eact Eleak Etotal
12
0.2 0.3 0.4 0.5 0.6 0.7 0.8 Vdd Figure 4. Measured frequency with Vdd for 4 processors
16 14 12 10 8 6 4 2 0
122µm
600mV
14
6
10
16 14 12 10 8 6 4 2 0
400mV
processor
Figure 2. Level converter design
Energy/Inst(pJ)
Frequency
high_out
low_in
Energy/Inst(pJ)
[1] [2] [3] [4]
2.2 2.0 1.8 1.6 1.4 1.2 1.0
0.6 0.8 1.0 1.2 1.4 1.6 1.8
Normalized Frequency
0.25 0.30 0.35 0.40 0.45 0.50 0.55 0.60 0.65
Vdd
Figure 9. Energy efficiency with Vdd for 4 Figure 7. Process variation with voltage sensor applications
24 22 20 18 16 14 12 10 8 6 4 2 0
Hempstead[6]
SNAP/LE[8]
cleverDust[7]
2.25pJ/Inst@1MIPS 0.85pJ/
[email protected] Subliminal
0.01
0.1
1 10 MIPS Figure 10. Energy efficiency trade-off against MIPS for subliminal core and comparison to previous work