engineering and the institute of engineering and science of bilkent university in partial fulfillment of the requirements for the degree of master of science by.
INSTANCE-BASED REGRESSION BY PARTITIONING FEATURE PROJECTIONS a thesis submitted to the department of computer engineering and the institute of engineering and science of bilkent university in partial fulfillment of the requirements for the degree of master of science
by I_ lhan Uysal January, 2000
I certify that I have read this thesis and that in my opinion it is fully adequate, in scope and in quality, as a thesis for the degree of Master of Science.
Assoc. Prof. Dr. Halil Altay Guvenir (Advisor)
I certify that I have read this thesis and that in my opinion it is fully adequate, in scope and in quality, as a thesis for the degree of Master of Science.
Assoc. Prof. Dr. Kemal O azer I certify that I have read this thesis and that in my opinion it is fully adequate, in scope and in quality, as a thesis for the degree of Master of Science.
Asst. Prof. Dr. I_lyas C�i�cekli
Approved for the Institute of Engineering and Science:
Prof. Dr. Mehmet Baray Director of Institute of Engineering and Science ii
ABSTRACT INSTANCE-BASED REGRESSION BY PARTITIONING FEATURE PROJECTIONS I_lhan Uysal M.S. in Computer Engineering Supervisor: Assoc. Prof. Halil Altay Guvenir January, 2000 A new instance-based learning method is presented for regression problems with high-dimensional data. As an instance-based approach, the conventional K-Nearest Neighbor (KNN) method has been applied to both classi cation and regression problems. Although KNN performs well for classi cation tasks, it does not perform similarly for regression problems. We have developed a new instance-based method, called Regression by Partitioning Feature Projections (RPFP), to ll the gap in the literature for a lazy method that achieves a higher accuracy for regression problems. We also present some additional properties and even better performance when compared to famous eager approaches of machine learning and statistics literature such as MARS, rule-based regression, and regression tree induction systems. The most important property of RPFP is that it performs much better than all other eager or lazy approaches on many domains that have missing values. If we consider databases today, where there are generally large number of attributes, such sparse domains are very frequent. RPFP handles such missing values in a very natural way, since it does not require all the attribute values to be present in the data set.
Keywords: Machine learning, instance-based learning, regression. iii
O ZET O ZNI_ TELI_ K I_ ZDU S�U MLERI_ NI_ N PARC�ALANMASI I_ LE O RNEKLERE DAYALI REGRESYON I_lhan Uysal Bilgisayar Muhendisli�gi, Yuksek Lisans Tez Yoneticisi: Do�c. Dr. Halil Altay Guvenir Ocak, 2000 Yuksek oznitelik say�lar�na sahip verilerin regresyon �cozumleri i�cin orneklere dayal� yeni bir ogrenme metodu sunulmu�stur. Orneklere dayal� bir yakla�s�m olarak geleneksel K-Yak�n Kom�su (KNN) yontemi hem s�n� and�rma hem de regresyon problemleri i�cin uygulanm��st�r. KNN s�n� and�rma i�slemleri i�cin iyi bir performans sergilerken, regresyon i�cin benzer bir performansa sahip de�gildir. Biz literaturdeki bu bo�slu�gu doldurmak uzere, tembel o�grenme yaparak yuksek ba�sar� sa�glayan orneklere dayal� yeni bir regresyon yontemi olan, O znitelik I_zdu�sumlerinin Par�calanmas� ile Regresyon (RPFP) isimli yontemi geli�stirdik. RPFP makina o�grenmasi ve istatistik literaturunde yer alan MARS, kurallara dayal� regresyon ve regresyon a�gac� o�grenen sistemler gibi onemli �cal��skan algoritmalarda dahi bulunmayan baz� ozelliklere ve hatta daha iyi performansa sahiptir. RPFP'nin bu ozelliklerinden en onemli olan� verilerde eksik de�gerler oldu�gu durumlarda pek �cok uygulama i�cin di�ger tum �cal��skan veya tembel yontemlerden daha �cok ba�sar� sa�glamas�d�r. Gunumuzde, �cok say�da alanlar� bulunan veri tabanlar�n� dikkate ald��g�m�z zaman, boyle ortamlara s�kl�kla rastlan�r. RPFP veri seti i�cindeki tum oznitelik de�gerlerinin doldurulmu�s olmas�n� gerektirmedi�gi i�cin eksik olan de�gerleri do�gal bir �sekilde c�ozumler.
Anahtar Sozcukler: Makina o�grenmesi, orneklere dayal� o�grenme, regresyon. iv
Babama ve anneme.
v
ACKNOWLEDGMENTS I would like to express my gratitude to Dr. H. Altay Guvenir, from whom I have learned a lot, due to his supervision, suggestions, and support during this research. I am also indebted to Dr. Kemal O azer and Dr. I_lyas C�i�cekli for showing keen interest to the subject matter and accepting to read and review this thesis. I would like to thank to Ye�sim and Gozde, for their great patience and support that was very important, Halise for her support and data sets she provided, Nurhan for her morale support and Munise for many things. I would also like to thank to Bilkent University Computer Engineering Department and Turkish Navy, since they enabled and supported this research. This thesis was supported, in part, by TUBITAK (Scienti c and Technical Research Council of Turkey) under Grant 198E015.
vi
Contents 1 Introduction
1
1.1 Parametric versus Non-Parametric Regression : : : : : : : : : :
3
1.2 Eager versus Lazy Learning : : : : : : : : : : : : : : : : : : : :
4
1.3 Regression by Partitioning Feature Projections : : : : : : : : : :
5
1.4 Notation : : : : : : : : : : : : : : : : : : : : : : : : : : : : : : :
6
1.5 Organization : : : : : : : : : : : : : : : : : : : : : : : : : : : :
6
2 Overview of Regression Techniques
7
2.1 Instance-Based Regression : : : : : : : : : : : : : : : : : : : : :
7
2.2 Locally Weighted Regression : : : : : : : : : : : : : : : : : : : :
9
2.2.1 Nonlinear Local Models : : : : : : : : : : : : : : : : : : 10 2.2.2 Linear Local Models : : : : : : : : : : : : : : : : : : : : 10 2.2.3 Implementation : : : : : : : : : : : : : : : : : : : : : : : 11 2.3 Regression by Rule Induction : : : : : : : : : : : : : : : : : : : 12 2.4 Projection Pursuit Regression : : : : : : : : : : : : : : : : : : : 16 2.4.1 Projection Pursuit Regression Algorithm : : : : : : : : : 17 vii
2.4.2 Smoothing Algorithm : : : : : : : : : : : : : : : : : : : : 19 2.5 Regression by Tree Induction : : : : : : : : : : : : : : : : : : : 20 2.5.1 CART : : : : : : : : : : : : : : : : : : : : : : : : : : : : 21 2.5.2 RETIS : : : : : : : : : : : : : : : : : : : : : : : : : : : : 26 2.5.3 M5 : : : : : : : : : : : : : : : : : : : : : : : : : : : : : : 28 2.6 Multivariate Adaptive Regression Splines : : : : : : : : : : : : : 29 2.6.1 Piecewise Parametric Fitting and Splines : : : : : : : : : 30 2.6.2 MARS Algorithm : : : : : : : : : : : : : : : : : : : : : : 30 2.7 Discussion : : : : : : : : : : : : : : : : : : : : : : : : : : : : : : 33
3 Regression by Partitioning Feature Projections
36
3.1 RPFP Algorithm : : : : : : : : : : : : : : : : : : : : : : : : : : 39 3.1.1 Training : : : : : : : : : : : : : : : : : : : : : : : : : : : 39 3.1.2 Approximation using Feature Projections : : : : : : : : : 40 3.1.3 Local Weight : : : : : : : : : : : : : : : : : : : : : : : : 43 3.1.4 Partitioning Algorithm : : : : : : : : : : : : : : : : : : : 45 3.1.5 Prediction : : : : : : : : : : : : : : : : : : : : : : : : : : 48 3.2 RPFP-N Algorithm : : : : : : : : : : : : : : : : : : : : : : : : : 49 3.3 Properties of RPFP : : : : : : : : : : : : : : : : : : : : : : : : : 51 3.3.1 Curse of Dimensionality : : : : : : : : : : : : : : : : : : 51 3.3.2 Bias-variance Trade-o� : : : : : : : : : : : : : : : : : : : 54 3.3.3 Model Complexity and Occam's Razor : : : : : : : : : : 55 viii
3.3.4 Lazy Learning : : : : : : : : : : : : : : : : : : : : : : : : 56 3.3.5 Local Learning : : : : : : : : : : : : : : : : : : : : : : : 57 3.3.6 Irrelevant Features and Dimensionality : : : : : : : : : : 58 3.3.7 Context-sensitive Learning : : : : : : : : : : : : : : : : : 59 3.3.8 Missing Feature Values : : : : : : : : : : : : : : : : : : : 60 3.3.9 Interactions : : : : : : : : : : : : : : : : : : : : : : : : : 61 3.3.10 Feature Projection Based Learning : : : : : : : : : : : : 61 3.3.11 Di�erent Feature Types : : : : : : : : : : : : : : : : : : 62 3.3.12 Noise : : : : : : : : : : : : : : : : : : : : : : : : : : : : : 62 3.3.13 Normalization : : : : : : : : : : : : : : : : : : : : : : : : 63 3.4 Limitations of RPFP : : : : : : : : : : : : : : : : : : : : : : : : 63 3.4.1 Redundant Features : : : : : : : : : : : : : : : : : : : : 63 3.4.2 Interpretation : : : : : : : : : : : : : : : : : : : : : : : : 64 3.4.3 Rectangular Regions : : : : : : : : : : : : : : : : : : : : 64 3.5 Complexity Analysis : : : : : : : : : : : : : : : : : : : : : : : : 65 3.6 Comparisons of Regression Methods : : : : : : : : : : : : : : : : 65
4 Empirical Evaluations
67
4.1 Performance Measure : : : : : : : : : : : : : : : : : : : : : : : : 68 4.2 Algorithms Used in Comparisons : : : : : : : : : : : : : : : : : 68 4.2.1 RPFP : : : : : : : : : : : : : : : : : : : : : : : : : : : : 69 4.2.2 KNN : : : : : : : : : : : : : : : : : : : : : : : : : : : : : 69 ix
4.2.3 RULE : : : : : : : : : : : : : : : : : : : : : : : : : : : : 69 4.2.4 DART : : : : : : : : : : : : : : : : : : : : : : : : : : : : 69 4.2.5 MARS : : : : : : : : : : : : : : : : : : : : : : : : : : : : 70 4.3 Real Data Sets : : : : : : : : : : : : : : : : : : : : : : : : : : : 70 4.4 Accuracy : : : : : : : : : : : : : : : : : : : : : : : : : : : : : : : 70 4.5 Robustness to Irrelevant Features : : : : : : : : : : : : : : : : : 72 4.6 Robustness to Missing Values : : : : : : : : : : : : : : : : : : : 75 4.7 Robustness to Noise : : : : : : : : : : : : : : : : : : : : : : : : 75 4.8 Interactions : : : : : : : : : : : : : : : : : : : : : : : : : : : : : 79 4.9 Computation Times : : : : : : : : : : : : : : : : : : : : : : : : : 82
5 Conclusion and Future Work
84
x
List of Figures 2.1 The Proximity Algorithm : : : : : : : : : : : : : : : : : : : : :
8
2.2 2d-tree data structure. The black dot is the query point, and the shaded dot is the nearest neighbor. Outside the black box does not need to be searched to nd the nearest neighbor. : : : 12 2.3 Swap-1 Algorithm : : : : : : : : : : : : : : : : : : : : : : : : : : 13 2.4 A solution induced from a hart-disease data : : : : : : : : : : : 14 2.5 Composing Pseudo-Classes (P-Class) : : : : : : : : : : : : : : : 15 2.6 Overview of Method for Learning Regression Rules : : : : : : : 16 2.7 Projection Pursuit Regression Algorithm : : : : : : : : : : : : : 18 2.8 Running Medians of Three : : : : : : : : : : : : : : : : : : : : : 19 2.9 Variable Bandwidth Smoothing Algorithm : : : : : : : : : : : : 20 2.10 Example of Regression Tree : : : : : : : : : : : : : : : : : : : : 22 2.11 An example of the tree construction of process. Four regions are determined by predictors x and x . : : : : : : : : : : : : : : : : 23 1
2
2.12 Recursive Partitioning Algorithm : : : : : : : : : : : : : : : : : 24 2.13 A binary tree representing a recursive partitioning regression model with the associated basis functions : : : : : : : : : : : : : 25 xi
2.14 An example region, with large variance, which is inappropriate for splitting : : : : : : : : : : : : : : : : : : : : : : : : : : : : : 26 2.15 MARS Algorithm : : : : : : : : : : : : : : : : : : : : : : : : : : 33 2.16 An example for the regions of MARS algorithm : : : : : : : : : 33 3.1 An example training set projected to two features:f and f . : : 40 1
2
3.2 Approximations for Feature Projections : : : : : : : : : : : : : 42 3.3 Example data set and its partitioning. : : : : : : : : : : : : : : 46 3.4 Partitioning Algorithm : : : : : : : : : : : : : : : : : : : : : : : 47 3.5 Example training set after partitioning. : : : : : : : : : : : : : 49 3.6 Approximations for Feature Projections : : : : : : : : : : : : : 49 3.7 Prediction Algorithm : : : : : : : : : : : : : : : : : : : : : : : : 50 3.8 Weighted Median Algorithm : : : : : : : : : : : : : : : : : : : : 51 4.1 Relative errors of algorithms with increasing irrelevant features. 74 4.2 Relative errors of algorithms with increasing missing values. : : 77 4.3 Relative errors of algorithms with increasing target noise. : : : : 80 4.4 Arti cial data set. x1 and x2 are input features. : : : : : : : : : 81
xii
List of Tables 2.1 Example of swapping rule components. : : : : : : : : : : : : : : 14 2.2 Properties of Regression Algorithms (the names of programs developed with those methods are shown in parentheses). : : : : : 35
p
3.1 Properties of Regression Algorithms. The ( ) is used for cases if the corresponding algorithm handles a problem or it is advantageous in a property when compared to others. : : : : : : : : : 66 4.1 Characteristics of the data sets used in the empirical evaluations. C: Continuous, N: Nominal. : : : : : : : : : : : : : : : : : : : : 71 4.2 Relative Errors of Algorithms. Best results are typed with bold font. : : : : : : : : : : : : : : : : : : : : : : : : : : : : : : : : : 73 4.3 Relative errors of algorithms, where 30 irrelevant features are added to real data sets. If the result is not available due to singular variance/covariance matrix, it is shown with (*). Best results are typed with bold font. : : : : : : : : : : : : : : : : : : 76 4.4 Relative errors of algorithms, where 20% of values of real data sets are removed. If the result is not available due to singular variance/covariance matrix, it is shown with (*). Best results are typed with bold font. : : : : : : : : : : : : : : : : : : : : : : 78 4.5 Comparison of RPFP with its additive version RPFP-A. Best results are typed with bold font. : : : : : : : : : : : : : : : : : : 81 xiii
4.6 Time durations of algorithms for real data sets in milliseconds. : 83
xiv
List of Symbols and Abbreviations B CART CFP COFI D DART DNF f g H I i IBL K k KMEANS KNN KNNFP KNNR KDD L LOESS LOF log LW LWf LWR MAD MARS M5 n
: : : : : : : : : : : : : : : : : : : : : : : : : : : : : : : :
Basis Function Parameter set Classi cation and Regression Trees Classi cation by Feature Partitioning Classi cation by Overlapping Feature Intervals Training Set Regression tree induction algorithm Disjunctive Normal Form Approximated Function Approximated Function Step Function Fitting Function Instance Instance-based Learning Kernel Function Number of Neighbor Instances Partitioning clustering algorithm K Nearest Neighbor K Nearest Neighbor on Feature Projections K Nearest Neighbor Regression Knowledge Discovery in Databases Loss Function Locally weighted regression program Lock of Fit Function Logarithm in base 2 Local Weight Local weight of feature f Locally Weighted Regression Mean Absolute Distance Multivariate Adaptive Regression Splines Regression tree induction algorithm Number of training instances xv
p PI PPR
q xq
R Rk RE RETIS RFP RPFP RULE r ri
r
S t T VFI
X x xi
WKNN
y y�
: : : : : : : : : : : : : : : : : : : : : : : : :
Number of parameters or features Prediction Index Projection Pursuit Regression Query instance Query instance Region Rule set Relative Error Regression tree induction algorithm Regression by Feature Projections Regression by Partitioning Feature Projections Rule-based regression algorithm Rule Resudual Resudual vector Smooth function A test example Number of test instances Voting Feature Intervals Instance matrix Instance vector Value vector of ith instance Weighted k Nearest Neighbor Algorithm Target vector Estimated target
xvi
Chapter 1 Introduction Predicting values of numeric or continuous attributes is called regression in the statistical literature, and it has been an active research area in this eld. Predicting real values is also an important topic for machine learning. Most of the problems that humans learn to solve in real life such as sporting abilities are continuous. Dynamic control is a research area in machine learning. For example, learning to catch a ball moving in a three dimensional space, is an example of this problem, studied in robotics. In such applications machine learning algorithms are used to control robot motions, where the response to be predicted by the algorithm is a numeric or real-valued distance measure and direction. As an example of such problem, Salzberg and Aha proposed an instance-based learning algorithm for robot control task in order to improve a robot's physical abilities [4]. In machine learning, much research has been performed on classi cation, where the predicted feature is nominal or discrete. Regression di�ers from classi cation, in that the output or predicted feature in regression problems is continuous. Even though, much research is concentrated on classi cation in machine learning, recently the focus of the machine learning community has moved strongly towards regression, since a large number of real-life problems can be modeled as regression problems. Various names are used for this problem in the literature, such as functional prediction, real value prediction, function approximation and continuous class learning. We prefer its historical 1
CHAPTER 1. INTRODUCTION
2
name, regression, henceforth, for simplicity. In designing expert systems, induction techniques developed in machine learning and statistics have become important especially for cases where domain expert is not available or the knowledge of experts is tacit or implicit [1, 42]. These techniques are also important to discover knowledge in cases where domain experts or formal domain knowledge is available but di�cult to elicit [39]. Probably, the most important advantage of induction techniques is that they enable us to extract knowledge automatically. By the term \knowledge", we mean two types of information. One is the information used for prediction of a new case, given example cases; the other is the information used for extracting new rules about the domain which have not yet been discovered, by interpreting induced models. The techniques reviewed and developed in this thesis can be employed in such systems, when the underlying problem is formalized as a prediction of a continuous target attribute. The idea behind using induction techniques, investigated particularly in machine learning literature, is widely accepted by a newly emerged discipline, Knowledge Discovery in Databases (KDD), which incorporates researchers from various disciplines [17, 18, 60]. The main source of information in this eld is large databases. Since databases can store large amounts of data belonging to many di�erent domains, the use of automatic methods such as induction for knowledge discovery is viable, because it is usually di�cult to nd an expert for each di�erent domain or relation in databases. Today, database management systems enable only deductive querying. Incorporating an inductive component into such databases to discover knowledge from di�erent domains automatically is a long-term expectation from this new eld [32]. This particularly requires the cooperation of knowledge engineers and database experts. Such expectations make regression an important tool for the stand-alone or domainspeci c KDD systems today and Knowledge and Data Discovery Management Systems [17, 60] in the future.
CHAPTER 1. INTRODUCTION
3
1.1 Parametric versus Non-Parametric Regression The most common approach in regression is to t the data to a global parametric function. Classical linear regression in statistical analysis is an example of parametric learning. This model involves a dependent variable y and predictor (independent) variables (x's), and assumes that the value of y changes at a constant rate as the value of any independent variable changes. Thus the functional relationship between y and x's is a straight line.
yi = + xi + xi + � � � + pxip + "i 0
1
1
2
2
(1.1)
The subscript i denotes the observations or instances, the second subscript designates p independent variables. There are p+1 parameters, j ; j = 0; : : : ; p, to be estimated. In the parametric model, the structure of the function is given, and the procedure estimates the values of the parameters, j , according to a tting criterion. This criterion is generally a minimization of an error function for all data points in a training set. Very often this is a least squares criterion, which minimizes the sum of the squares of the prediction errors of the estimated linear function for all instances. The error term, "i , denotes the error of estimation for each instance i, and it is assumed to be normally distributed. Parametric methods have been very successful when the assumed structure of the function is su�ciently close to the function which generated the data to be modeled. However, the aim in machine learning is to nd a general structure rich enough to model a large portion of all possible functions. This idea leads us to non-parametric regression methods, where no assumption is made about the structure of the function or about the distribution of the error.
CHAPTER 1. INTRODUCTION
4
1.2 Eager versus Lazy Learning We categorize regression algorithms with two classes, eager and lazy approaches. The term eager is used for learning systems that construct rigorous models. By constructing models, two types of knowledge, prediction and concept descriptions that enable interpretation can be addressed. By using induced models of many eager methods, interpretation of the underlying data can be obtained. Decision trees and decision rules are such models, that are reviewed. On the other hand, lazy approaches [3] do not construct models and delay processing to the prediction phase. In fact the model is the data itself. Because of these properties, some disadvantages of the lazy approach immediately become apparent. The most important of all is that the lazy approaches are not suitable for the rst type of knowledge, interpretation, since the data itself is not a compact description when compared other models such as trees or rules. So, the major task of these methods is prediction. A second limitation is that they generally have to store the whole data in the memory, it may be impossible if the data is too big. However, lazy approaches are very popular in the literature, due to some of their important properties. One of them is that they make predictions according to the local position of query instances. They can form complex decision boundaries in the instance space even when relatively little information is available, since they do not generalize the data by constructing global models. Another one is that learning in lazy approaches is very simple and fast, since it only involves storing the instances. Finally, they do not have to construct a new model, when a new instance is added to the data. Besides these common characteristics of lazy approaches, however, the most signi cant problem with them is the one posed by irrelevant features. Some feature selection and feature weighting algorithms have been developed in the literature for this purpose. A review of many such algorithms can be found in literature [61]. However, these algorithms have also a common characteristic that they ignore the fact that some features may be relevant only in context. That is, some features may be important or relevant only in some regions of the instance space. This characteristic is known as context-sensitive or adaptive in
CHAPTER 1. INTRODUCTION
5
the literature. Even most eager approaches have this property, most of lazy approaches are not adaptive. Such important properties of surveyed important regression techniques are also discussed in Chapter 2.
1.3 Regression by Partitioning Feature Projections This thesis describes a new instance-based regression method based-on feature projections called Regression by Partitioning Feature Projections (RPFP). Previous feature projection-based learning algorithms are developed for classi cation tasks. The RPFP method works similar to those methods, by making predictions on the projections of data to all features separately. A complete survey of literature for feature projection-based learning is given in [13], The RPFP method described in thesis is adaptive. This property is also called as context sensitive in the literature. For di�erent query locations in the instance space RPFP forms a di�erent model and a di�erent region, and makes a di�erent approximation. This is one of the major properties that makes RPFP a exible regression method. This brings in another advantage: Robustness to irrelevant features, as well as, eager algorithms that partition the instance space, such as, decision tree induction methods. The regions formed for the queries will be long on the dimensions of irrelevant features and short on relevant dimensions as the case in eager partitioning methods. Besides those properties, RPFP is robust to the curse of dimensionality, in that it is suitable for high-dimensional data. This is due to the elimination of irrelevant features, and by making approximations on feature projections for each feature dimension separately. Making predictions on each feature separately enables another important property of RPFP. It handles missing feature values naturally, without lling them with estimated values. The experimental results shows that, RPFP achieves the highest accuracy when there are many missing values in the data set. These important properties of RPFP and a detailed comparison of it with other famous approaches are described in detail after the description of RPFP in Chapter 3.
CHAPTER 1. INTRODUCTION
6
From the point of view of these characteristics, we can de ne RPFP as lazy, non-parametric, non-linear, and adaptive regression method based on feature projections in implementation.
1.4 Notation In the rest of the thesis, training set D is represented by the instance matrix X, where rows represent instances and columns represent predictors, and a response vector y represents the continuous or numeric response to be predicted for all instances. Estimated values of y are shown with a column vector y� , where y�i is a scalar of the vector. Coe�cients in Equation 1.1 are represented by a column vector . Any instance or any row in the instance matrix is represented by xi, where i = 1; : : :; n and n is the number of instances in the training set. Any column of X is represented by xj , where j = 1; : : : ; p, and p is number of predictor features. xij ; yi and j represent scalars of X; y and , respectively. For the operations where is included, a column consisting only of constant 1 values is inserted into the instance matrix as the rst row so as to enforce the rst term in Equation 1.1 (j = 0; : : :; p). The notations xj and y are used as variables to represent predictor features and response feature respectively. To denote instance vectors (xi) with a variable, x is used. To represent residuals, a column vector r is used, where ri, i = 1; : : :; n, is a scalar. To denote a query instance, a row vector q or xq is used.
1.5 Organization In next chapter, we make an overview of existing important regression techniques in the literature. In Chapter 3 we describe RPFP and a robust version of it to noise RPFP-N. The detailed description of characteristic properties of RPFP and theoretical comparison of it with the existing important approaches in the literature is also given in this chapter. Empirical evaluations of RPFP are shown in Chapter 4, and we conclude the thesis with Chapter 5.
Chapter 2 Overview of Regression Techniques In this chapter, we review important regression techniques developed in machine learning and statistics. We rst review lazy approaches for regression, instance-based regression, and locally weighted regression, in the rst two sections and then we review eager approaches rule-based regression, projection pursuit regression, tree-based regression and multivariate adaptive regression splines, respectively in Section 2.3 through Section 2.6. We present a comparison of these techniques in Section 2.7 for their important properties.
2.1 Instance-Based Regression Instance-based learning (IBL) algorithms are very popular since they are computationally simple during the training phase [2, 11]. In most applications, training is done simply by storing the instances in the memory. This section describes the application of this technique to regression problems [36]. In instance-based regression, each instance is usually represented as a set of attribute value pairs, where the values are either nominal or continuous, and the value to be predicted is continuous. Given query instance, the task is to predict the target value as a function of other similar instances whose target values are 7
CHAPTER 2. OVERVIEW OF REGRESSION TECHNIQUES
8
known. The nearest neighbor is the most popular instance-based algorithm. The target values of the most similar neighbors are used in this task. Here the similarity is the complement of the Euclidean distance between instances. Formally, if we let real numbers, R be a numeric (continuous) domain, and X be an instance space with p attributes, we can then describe the approximation function, F , for predicting numeric values as follows: where y�i 2 R:
F (x ; : : : ; xp) = y�i 1
(2.1)
Training: [1] 8xi 2 Training Set [2] normalize(xi) Testing: [1] 8xt 2 Test Set [2] normalize(xt) [3] 8xifxi 6= xtg: Calculate Similarity(xt; xi) [4] Let SimilarsPbe set of N most similar instances to xt in Training Set [5] Let Sum =P xi2Similars Similarity(xt; xi) xt ;xi F (xi) [6] Then y�t = xi 2Similars Similarity Sum (
)
Figure 2.1. The Proximity Algorithm There is a variety of instance-based algorithms in the literature. Here, the simplest one, the proximity algorithm is described in Figure 2.1. The proximity algorithm simply saves all training instances in the training set. The normalization algorithm maps each attribute value into the continuous range (0 ? 1). The estimate y�t for test instance xt is de ned in terms of a weighted similarity function of xt's nearest neighbors in the training set. The similarity of two normalized instances is de ned by Equation 2.2.
Similarity(xt; xi) =
p X j =1
Sim(xtj ; xij )
(2.2)
where Sim(x; y) = 1:0 ? jx ? yj where 0 � x; y � 1, and j is the feature dimension.
CHAPTER 2. OVERVIEW OF REGRESSION TECHNIQUES
9
The assumption in this approach is that the function is locally linear. For su�ciently large sample sizes this technique yields a good approximation for continuous functions. Another important property of instance-based regression is its incremental learning behavior. By default, the instance-based regression assumes that all the features are equivalently relevant. However, the prediction accuracy of this technique can be improved by attaching weights to the attributes. To reduce the storage requirements for large training sets, averaging techniques for the instances can be employed [2]. The most important drawback of instance-based algorithms is that they do not yield abstractions or models that enable the interpretation of the training sets [40].
2.2 Locally Weighted Regression Locally weighted regression (LWR) is similar to the nearest neighbor approach described in the previous section, especially for three main properties. First, the training phases of both algorithms include just storing the training data, and the main work is done during prediction. Such methods are also known as lazy learning methods. Secondly, they predict query instances with strong in uence of the nearby or similar training instances. Thirdly, they represent instances as real-valued points in p-dimensional Euclidean space. The main di�erence between IBL and LWR is that, while the former predicts instances by averaging the nearby instances, the latter makes predictions by forming an averaging model at the location of query instance. This local model is generally a linear or nonlinear parametric function. After a prediction for query instance is done, this model is deleted, and for every new query a new local model is formed according to the location of the query instance. In such local models, nearby instances of the query have large weights on the model, whereas distant instances have fewer or no weights. For a detailed overview of the locally weighted methods see [7], from where the following subsections are summarized.
CHAPTER 2. OVERVIEW OF REGRESSION TECHNIQUES
10
2.2.1 Nonlinear Local Models Nonlinear local models can be constructed by modifying global parametric models. A general global model can be trained to minimize the following training criterion:
C=
X i
L(f (xi; ); yi)
(2.3)
where yi is the response value corresponding to the input vectors xi, and is the parameter vector for the nonlinear model y�i = f (xi; ) and L is the general loss function in predicting yi. If this model is a neural net, then the will be a vector of the synaptic weights. If we use the least squares for the loss function L, the training criterion will be
C=
X i
(f (xi; ) ? yi)
2
(2.4)
In order to ensure points nearby to the query have more in uence in the regression, a weighting factor can be added to the criterion.
C (q) =
X i
[L(f (xi; ); yi))K (d(xi; q))]
(2.5)
where K is the weighting or kernel function and d(xi; q) is the distance between the data point xi and the query q. Using this training criterion, f becomes a local model, and can have a di�erent set of parameters for each query point.
2.2.2 Linear Local Models The well-known linear global model for regression is simple regression (1.1), where least squares approximation is used as the training criterion. Such linear models can be expressed as
xi = yi
(2.6)
CHAPTER 2. OVERVIEW OF REGRESSION TECHNIQUES
11
where is the parameter vector. Whole training data can be de ned with the following matrix equation.
X = y
(2.7)
where X is the training matrix whose ith row is xi and y is a vector whose ith element is yi. Estimating the parameters using the least squares criterion minimizes the following criterion:
C=
X i
(xi ? yi)
2
(2.8)
We can use this global linear parametric model, where all the training instances have equal weight; for locally weighted regression, by giving nearby instances to the query point higher weights. This can be done using the following weighted training criterion:
C=
X i
[(f (xi; ) ? yi) K (d(xi; q))]: 2
(2.9)
Various distance (d) and weighting (K ) functions for local models are described in [7]. Di�erent linear and nonlinear locally weighted regression models can be estimated using those functions.
2.2.3 Implementation In LWR, as stated above, the computational cost of training is of a minimum since training includes only storing new data points into the memory. However the lookup procedure for prediction is more expensive than other instancebased learning methods, since a new model is constructed for each query. Here, the usage of a kd-tree data structure to speedup this process is described brie y [7]. The di�culty in the table lookup procedure is to nd the nearest neighbors, if only nearby instances are included in LWR. If there are n instances in the
CHAPTER 2. OVERVIEW OF REGRESSION TECHNIQUES
12
11 00 0 00 1 11 0 1
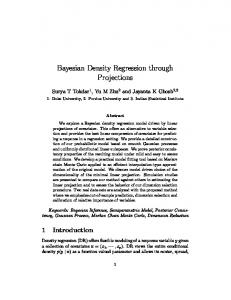
Figure 2.2. 2d-tree data structure. The black dot is the query point, and the shaded dot is the nearest neighbor. Outside the black box does not need to be searched to nd the nearest neighbor. database, for a naive implementation we need n distance computations. For an e�cient implementation, a kd-tree can be employed. A kd-tree is a binary data structure that recursively splits a k-dimensional space into smaller subregions, and those subregions are the branches or leaves of the tree data structure. The search for the nearest neighbors starts from the nearby branches in the tree. For a given distance threshold there is no need to search further branches by implementing this data structure. Figure 2.2 illustrates a two-dimensional region.
2.3 Regression by Rule Induction Inducing rules from a given training set is a well-studied topic in machine learning. Weiss and Indurkhya employed rule induction for a regression problem and reported signi cant results [58, 59]. In this section, we will rst review the rule-based classi cation algorithm [57], Swap-1, that learns decision rules in Disjunctive Normal Form (DNF), and later on describe its adaptation for regression.
CHAPTER 2. OVERVIEW OF REGRESSION TECHNIQUES
[1] Input: D, a set of training cases [2] Initialize R empty set, k 1, and C 1
1
13
D
[3] repeat [4] create a rule B with a randomly chosen attribute as its left-hand side [5] while (B is not 100-percent predictive) do [6] make single best swap for any component of B , including deletion of the component, using cases in Ck [7] If no swap is found, add the single best component to B [8] endwhile [9] Pk rule B that is now 100-percent predictive [10] Ek cases in C that satisfy the single-best-rule Pk [11] Rk Rk [ fPk g [12] Ck Ck ? fEk g [13] k k + 1 [14] until (Ck is empty) [15] nd rule r in Rk that can be deleted without a�ecting performance on cases in training set D [16] while (r can be found) [17] Rk Rk ? frg [18] k k + 1 [19] endwhile [20] output Rk and halt. +1
+1
+1
Figure 2.3. Swap-1 Algorithm The main advantage of inducing rules in DNF is their explanatory capability. It is comparable to decision trees since they can also be converted into DNF models. The most important di�erence between them is that the rules are not mutually exclusive, as in decision trees. In decision trees, for each instance, there is exactly one rule encoding, a path from a root to a leaf, that is satis ed. Because of this restriction, decision tree models may not produce compact models. However, because of this property of rule-based models, the problem emerges that, for a single instance, two or more classes may be satis ed. The solution found for this problem is to assign priorities or ordering to the rules according to their extraction order. The rst rule, according to this ordering that satis es the query instance, determines the class of a query. The Swap-1 rule induction algorithm [57] and its sample output are shown in Figure 2.3 and Figure 2.4, respectively.
CHAPTER 2. OVERVIEW OF REGRESSION TECHNIQUES
14
CA > 0:5 And CP > 3:5 Class = 2 THAL > 6:5 Class = 2 [True] Class = 1 Figure 2.4. A solution induced from a hart-disease data While constructing a rule, the Swap-1 algorithm searches all the conjunctive components it has already formed, and swaps them with all possible components it will build. This search also includes the deletion of some components from the rule. If no improvement is established from these swaps and deletions, then the best component is added to the rule. To nd the best component to be added, the predictive value of a component, as the percentage of correct decisions, is evaluated. If the predictive values of them are equal, maximum instance coverage is used as the second criterion. These swappings and additions end when the rule reaches 100% prediction accuracy. STEP
PREDICTIVE RULE VALUE (%) 1 31 p3 2 36 p6 3 48 p6 & p1 4 49 p4 & p1 5 69 p4 & p1 & p2 6 80 p4 & p1 & p2 & p5 7 100 p3 & p1 & p2 & p5 Table 2.1. Example of swapping rule components.
Table 2.1 illustrates a sample rule induction. After forming a new rule for the model, all instances that the rule covers are removed from the instance set, and the remaining instances are considered for the following steps. When a class is covered, the remaining classes are considered, in turn. This process iterates until the instance set becomes empty, that is, all instances are covered. After formation of the rule set, if the removal of any rule does not change the performance on training set, such rules are removed from the model. Furthermore, to reach an optimum rule set, an optimization procedure is used [57]. The rule induction algorithms for classi cation, such as Swap-1, can also be applied to regression problems. Since these algorithms are designed for the
CHAPTER 2. OVERVIEW OF REGRESSION TECHNIQUES
15
prediction of nominal attributes, using a preprocessing procedure, the numeric attribute in regression to be predicted is transformed to a nominal one. [1]Input: fyg a set of output values [2] Initialize n = number of cases, k = number of classes [3] repeat for each Classi [4] Classi = next n=k cases from list of sorted y values [5] end [6] repeat for each Classi (until no change for any class) [7] repeat for each case j in Classi [8] 1. Move Caseij to Classi? , compute Errnew [9] If Errnew > Errold return Caseij toCi [10] 2. Move Caseij to Classi , compute Errnew [11] If Errnew > Errold return Caseij to Ci [12] next Casej in Classi [13] Next Classi 1
+1
[14] repeat for each Classi (until no change for any class) [15] If Mean(Classi) = Mean(Classj ) then [16] Combine Classi and Classj [17] end Figure 2.5. Composing Pseudo-Classes (P-Class) For this transformation, the P-class algorithm, shown in Figure 2.5, is used in [59]. This transformation is in fact a one-dimensional clustering of training instances on response variable y, in order to form classes. The purpose is to make y values within one class similar, and across classes dissimilar. The assignment of these values to classes is done in such a way that the distance between each yi and its class mean must be minimum. The P-Class algorithm does the following. First it sorts the y values, then assigns an approximately equal number of contiguous sorted yi to each class. Finally, it moves a yi to a contiguous class if it reduces the distance of it to the mean of that class. This procedure is a variation of the KMEANS clustering algorithm [16, 35]. Given the number of initial clusters, on randomly decomposed clusters, the
CHAPTER 2. OVERVIEW OF REGRESSION TECHNIQUES
16
1. Generate a set of Pseudo-classes using the P-Class algorithm. 2. Generate a covering rule-set for the transformed classi cation problem using a rule induction method such as Swap-1. 3. Initialize the current rule set to be the covering rule set and save it. 4. If the current rule set can be pruned, iteratively do the following: a) Prune the current rule set. b) Optimize the pruned rule set and save it. c) Make this pruned rule set the new current rule set. 5. Use test instances or cross-validation to pick the best of the rule sets. Figure 2.6. Overview of Method for Learning Regression Rules
KMEANS algorithm swaps the instances between the clusters if it increases a clustering measure or criterion that employs inter and intra-cluster distances. Given the number of classes, P-Class is a quick and precise procedure. However, no idea is stated in the literature about an e�cient way to determine the number of classes. After the formation of classes (pseudo-classes) and the application of a rule induction algorithm to these classes, such as Swap-1, in order to produce an optimum set of regression rules, a pruning and optimization procedure can be applied to these rules, as described in [57, 59]. An overview of the procedure for the induction of regression rules is shown in Figure 2.6. The naive way to predict the response for a query instance is to assign the average of responses. The average may be a median or mean of that class. However, di�erent approaches also can be considered by applying a parametric or non-parametric model for that speci c class. For example, the nearest neighbor approach is used for this purpose, and signi cant improvements of this combination against the naive approach are reported in [59].
2.4 Projection Pursuit Regression One problem with most local averaging techniques, such as the nearest-neighbor, is the curse of dimensionality. If a given amount of data is distributed in a
CHAPTER 2. OVERVIEW OF REGRESSION TECHNIQUES
17
high-dimensional space, then the distance between adjacent data points increases with increasing number of dimensions [29]. Friedman and Stuetzle give a numeric example about this problem [20]. Projection pursuit regression (PPR) forms the estimation model by re ecting the training set onto lower dimensional projections as a solution for high dimensional data sets. Another important characteristic of PPR is its successive re nement property. At each step of model construction, the best approximation of the data is selected and added to the model, while removing the well described portion of the instance space. The search on the data set continues for the remaining part and this process iterates by increasing the complexity of the model at each step. The successive re nement concept is applied to regression in a di�erent way here, by subtracting the smooth from residuals. A smooth is a function formed by averaging responses (y). An example of smooth is shown in Section 2.4.2. The model approximated by the PPR algorithm is the sum of the smooth functions S of the linear projections, determined in each iteration:
'(x) =
M X m=1
S m ( m:X)
(2.10)
where m is the parameter vector (projection), X is the training set against predictor variables, S m is the smooth function and M is the number of terms or smoothes in the model.
2.4.1 Projection Pursuit Regression Algorithm At each iteration of the PPR algorithm, a new term, m in Equation 2.10, is added to the regression surface '. The critical part of the algorithm is the search for the coe�cient vector or projection of the next term. After nding a coe�cient vector at each iteration, the smooth of the estimated response values resulting from the inner product ( m:X) is added to the model as a new term, where the term is a function of all features. The linear sum of these functions (2.10) forms the model, which is employed for the prediction task.
CHAPTER 2. OVERVIEW OF REGRESSION TECHNIQUES
18
[1] ri yi , M 0, i = 1; :::; n [2] Search for the coe�cient vector M , that maximize tting criterion I ( ) by using Equation 2.11 [3] If I ( ) is greater than the given threshold [4] ri ri ? S M +1 ( M :xi), i = 1; : : : ; n [5] M M +1 [6] go to Step 2 [7] Otherwise stop, by excluding last term M . +1
Figure 2.7. Projection Pursuit Regression Algorithm The search for the coe�cient vector for each term is done according to a tting criterion ( gure of merit) such that, the average sum of the squared di�erences between residuals and the smooth is the minimum. For this purpose, I ( ), the fraction of unexplained variance that is explained by smooth S , is used as an optimality criterion or gure of merit. I ( ) is computed as n X
I ( ) = 1 ? (ri ? S ( :xi)) = i=1
2
n X i=1
ri
2
(2.11)
where ri is a residual which takes the value of yi in the rst step of the algorithm. The coe�cient vector that maximizes I ( ) is the optimal solution. In the rst line of the algorithm current residuals and the term counter are initialized. In the second step, the coe�cient vector that results in the best smooth close to the residuals according to the tting criterion I is found. A smooth is found for each vector, in ascending order of the linear combination ( :X). If the criterion value found is below a given threshold, the iteration of the algorithm is continued by the new residual vector, which is found by subtracting the smooth from the current residuals at Step 4. With this subtraction operation, the algorithm gains the successive re nement characteristic. For search of the coe�cient vector that maximizes the tting criterion, a modi cation of the Rosenbrock method [50] is chosen in [20], and as a smoothing procedure, a method is described in the next subsection. Some models approximate the regression as a sum of the functions of individual predictors (standard additive models), and because of that, they can
CHAPTER 2. OVERVIEW OF REGRESSION TECHNIQUES
19
not deal with interactions between predictors. In such models, the projections are done onto individual predictors rather than onto a projection vector, which is the linear sum of the predictors, as in PPR. These projection vectors, instead of individual predictors, allow PPR to deal with interactions, which is the third main property of PPR.
2.4.2 Smoothing Algorithm Traditional smoothing procedures assume that the observed variation, response yi, is generated by a function which has a normally distributed error component. The smooth constitutes an estimation for that function. As an example, in simple linear regression, this function is a linear combination of predictors. As stated above, PPR tries to explain this variation with not just one smooth, but with a sum of smoothes over linear combinations of predictors. Generally, the smooth functions employed here are not expressions, rather, they are a local averaging of the responses or residuals. Taking the averages of responses in neighborhood regions forms this smooth function. The boundaries of the neighborhood region where the averages are taken are called bandwidth. For example, in the k-nearest neighbor algorithm, k is used for the constant bandwidth. In [20], a variable bandwidth algorithm is employed, where larger bandwidths are used in regions of high local variability of response. To clarify the concept of smoothing, we describe the constant bandwidth smoothing algorithm of Tukey [52] called \running Medians". Running medians is a simple procedure that averages the response by taking the median of the neighbor region. Running medians of three algorithms, described in [52], are shown with a simple example in Figure 2.8. The smooth of each response is found by the median of three values in the sequence. One of them is the response itself, and other two are neighbors.
Given : 4 7 9 3 4 11 12 1304 10 15 12 13 17 Smooth : ? 7 7 4 4 11 12 12 15 12 13 13 ? Figure 2.8. Running Medians of Three
CHAPTER 2. OVERVIEW OF REGRESSION TECHNIQUES
20
Friedman and Stuetzle [20], employ running medians of three in their variable bandwidth smoothing algorithm, as is shown in Figure 2.9. [1] Running medians of three; [2] Estimating the response variability at each point by the average squared residual of a locally linear t with constant bandwidth; [3] Smoothing this variance estimates by a xed bandwidth moving average; [4] Smoothing the sequence obtained by pass (1) by locally linear ts with bandwidths determined by the smoothed local variance estimates obtained in pass (3). Figure 2.9. Variable Bandwidth Smoothing Algorithm In Step 1, a smooth for the response is formed. In Step 2, for each smoothed response value, we nd the variance of the neighbors in the interval determined by a given constant bandwidth. In Step 3, these variances are smoothed by a given constant bandwidth. Finally, by employing these smoothed variance values as a bandwidth for each smoothed response determined in Step 1, a variable bandwidth smooth is obtained.
2.5 Regression by Tree Induction Tree induction algorithms construct the model by recursively partitioning the data set. The task of constructing a tree is accomplished by employing a search for an attribute to be used for partitioning the data at each node of the tree. The explanation capability of regression trees and their use to determine key features from a large feature set are their major advantages. In terms of performance and accuracy, regression tree applications are comparable to other models. Regression trees are also shown to be strong when there are higher order dependencies among the predictors. One characteristic common to all regression tree methods is that, they partition the training set into disjoint regions recursively, where the nal partition is determined by the leaf nodes of the regression tree. To avoid over tting and form simpler models, pruning strategies are employed in all regression tree methods.
CHAPTER 2. OVERVIEW OF REGRESSION TECHNIQUES
21
In the following subsections, three di�erent regression tree methods are described: CART, RETIS and M5. They share the common properties described above, but show signi cant di�erences in some of measures and traits they demonstrate.
2.5.1 CART Using trees as regression models was rst applied in the CART (Classi cation and Regression Trees) program, developed by the statistical research community [9]. This program induces both regression and classi cation trees. In the rst step, we start with the whole training set represented by the root node to construct the tree. A search is done on the features to construct the remaining part of the tree recursively. We nd the best feature and feature value of any instance at which to split the training set represented by the root node. This splitting forms two leaf nodes that represent two disjoint regions in the training set. In the second step, one of these regions is selected for further splitting. This splitting is again done according to a selected feature value of an instance. At each step of partitioning, one of the regions, which are not selected before are taken and partitioned to two regions in the same manner along a feature dimension. After forming regions, which are represented by the leaf nodes of a tree, a constant response value is used for estimation of a query. When a test instance is queried, the leaf node that covers the query location is determined. A constant average value of response values of the instances of the region is assigned as the prediction for the test instance. Each disjoint region has its own estimated value that is assigned to any query instance located in this region. To construct optimum disjoint regions, an error criterion is used. The optimum value of this criterion produces a decomposition at any step of the tree induction process described above so that the correct region, feature, feature value (splitting surface) and estimates for each region are selected. To determine the predicted target values in these regions, averaging methods such as mean and median are used. As a tting criterion, the variances of the regions
CHAPTER 2. OVERVIEW OF REGRESSION TECHNIQUES
22
are used (2.13).
Error(V ariance) =
n X i=1
(yi ? y�)
(2.12)
2
where n is the number of instances in the region. 8 9 < = X X (yj ? y�right)2; (2.13) (yi ? y�left)2 + Splitting Error = n1 : xj 2X xi 2X right
left
After computing the splitting error for all possible splits of a particular predictor, the splitting that maximizes the following criterion is selected.
C = V ariance ? Splitting Error
(2.14)
The node and predictor that reach the maximum criterion C , are selected for splitting. An example regression tree is shown in Figure 2.10. The construction process is illustrated in Figure 2.11. X1 < 3 F T X2 < 1
8
T
2
F
5
Figure 2.10. Example of Regression Tree Formally, the resulting model can be de ned in the following form [9, 19]: If
x 2 Rm ; then f (x) = gm(xfaj gP ): 1
(2.15)
CHAPTER 2. OVERVIEW OF REGRESSION TECHNIQUES
23
R1 a
x1
R1
R2
b
x2
R1
x1
R1
a R2
b
R3 a
R2
c R3
R4
Figure 2.11. An example of the tree construction of process. Four regions are determined by predictors x and x . 1
2
where fRm gP are disjoint subregions representing p partitions of the training set. The functions g are generally in simple parametric form. The most common parametric form is a constant function (2.16), which is illustrated with the example given in Figure 2.10. 1
gm(xjam) = am:
(2.16)
The constant values of leaves or partitions are generally determined by averaging. More formally, the model can be denoted by using basis functions: M X f�(x) = amBm (x) m=1
(2.17)
The basis functions Bm (x) take the form
Bm (x) = I (x 2 Rm) (2.18) where I is an indicator function having the value one if its argument is true and zero otherwise. Let H [�] be a step function, indicating a positive argument 8 < 1 if � > 0 H [�] = : 0 otherwise
(2.19)
and let LOF(g) be a procedure that computes the lack of t of an estimation function g to the data. The recursive partitioning algorithm is given in Figure 2.12.
CHAPTER 2. OVERVIEW OF REGRESSION TECHNIQUES
24
[1]B (x) 1 [2] For M = 2 to Mmax do : lof � 1 [3] For m = 1 to M ? 1 do : [4] For v = 1 to n do : [5] For t 2 P fxvj jBm(xj ) > 0g [6] g i6 m ai Bi (x) + am Bm (x)H [+(xv ? t)] + aM Bm (x)H [?(xv ? t)] [7] lof mina1:::aM LOF (g) [8] if lof < lof � , then lof � lof ; m� m; v� v; t� t end if [9] end for [10] end for [11] end for [12] BM (x) Bm� (x)H [?(xv� ? t�)] [13] Bm� (x) Bm� (x)H [+(xv� ? t�)] [14] end for 1
=
Figure 2.12. Recursive Partitioning Algorithm The rst line of the algorithm assigns the whole training set as the initial region. The rst loop iterates the splitting until reaching a maximum number of regions. The next three loops selects the optimum basis function Bm� (intuitively the optimum region), predictor xv� , and split point t�. At lines 12 and 13, the selected region for splitting, Bm� , is replaced with its two partitions. This is done by adding a factor to its product; with H [?(xv� ? t�)] for the negative portion of the region at line 12 by creating a new basis function, and with H [+(xv� ? t�)] for the positive portion of the region at line 13, by modifying or removing the previous basis function. Finally the basis functions formed by the algorithm will take the following form:
Bm(x) =
K Ym k=1
H [skm:(xv k;m ? tkm)] (
)
(2.20)
where the quantity Km is the number of splits that gave rise to Bm, and the arguments of the step functions contain the parameters associated with each of these splits. The quantity skm takes (+=?)1 values indicating the right/left portions, v(k; m) label the predictor variables, and tkm represent values on the corresponding variables. A possible output of the algorithm is shown in Figure 2.13.
CHAPTER 2. OVERVIEW OF REGRESSION TECHNIQUES
Va ta
-
25
+
4 Vb tb
-
+
1 Vc -
2
B B B B
1 2 3 4
tc
+
3
= H [?(xva ? ta)]H [?(xvb ? tb)] = H [?(xva ? ta)]H [+(xvb ? tb)]H [?(xvc ? tc)] = H [?(xva ? ta)]H [+(xvb ? tb)]H [+(xvc ? tc)] = H [+(xva ? ta)]
Figure 2.13. A binary tree representing a recursive partitioning regression model with the associated basis functions The partition may lead to very small regions with a large tree. This situation may cause over tting with unreliable estimates. Stopping the process early may also not produce good results. The solution to this problem is to employ a pruning strategy. Pruning the regression tree by removing leaves will leave holes, which is an important problem, since we will not be able to give an answer to queries that fall into these regions or holes. That is why the removal of regions is done pairwise, with siblings, by merging them into a single (parent) region. This pruning strategy is described in [9]. Recursive partitioning regression is an adaptive method, one that dynamically adjusts its strategy to take into account the behavior of a particular problem to be solved [19]. For example, recursive partitioning has the ability to exploit low local dimensionality of functions. In local regions, the dependence of the response may be strong on a few of the predictors, and these few variables may be di�erent in di�erent regions. Another property of recursive partitioning regression is that they allow interpretations, especially when a
CHAPTER 2. OVERVIEW OF REGRESSION TECHNIQUES
26
constant estimation is done on the leaves. On the other hand, it has some drawbacks and limitations, the most important is the fact that the estimation is discontinuous. The model cannot approximate even simple continuous functions such as linear functions, which limits the accuracy of the model. As a consequence of this limitation, one cannot extract from the representation of the model the structure of the function (e.g. linear or additive), or whether it involves a complex interaction among the variables.
2.5.2 RETIS In the basic CART algorithm described above, the estimated response value, y� on the leaves of the regression tree was a constant function(2.16). On the other hand, RETIS (Regression Tree Induction System) [33, 34], a di�erent approach used to construct regression trees, developed by the machine learning community, is an extension of CART that employs a function on the leaves. This is a linear function of continuous predictors. The use of linear regression at the leaves of a regression tree is called local linear regression [33]. RETIS can also be categorized as a LWR system (Section 2.2). y
x1
Figure 2.14. An example region, with large variance, which is inappropriate for splitting RETIS is not just a modi cation of CART at the leaf nodes. The employment of linear regression enforces modi cations in the construction of the regression tree. In the process of tree construction, the CART system forms subtrees to minimize the expected variance (2.13). However, when applying
CHAPTER 2. OVERVIEW OF REGRESSION TECHNIQUES
27
local linear regression to a regression tree, the variance is not an appropriate measure as an optimality criterion. If the relationship between the predictors and response is linear, this region may not be appropriate for splitting even if the variance is very large. This situation is illustrated with an example in [33]. Suppose we have a region with four instances described with only one predictor as shown in Figure 2.14. Even the error is large in terms of variance, it is almost zero according to a linear approximation on these four points. Such regions are not appropriate for further splitting. That is why an alternative splitting criterion is employed in RETIS as given in Equation 2.22. Let us rst de ne impurity measure, I:
I (X) =
n X i=1
(yi ? g(xi))
2
(2.21)
where n is the number of instances, g is the linear function that best ts the instances of the region. Consequently, the gure of merit (the splitting criterion) is de ned as in Equation 2.22.
C = n1 [nleftIleft + nrightIright]
(2.22)
The use of Equation 2.21 instead of Equation 2.13 in computing gure of merit is the main di�erence between CART and RETIS. When estimating a response value for a query, the value that results from the linear function on which the leaf node the query falls is used. After construction of a regression tree, a pruning strategy is employed, as in most other tree induction models. See [41] for an in-depth explanation of pruning. The strategy used in RETIS computes two di�erent error measures: static error and the backed-up error. The static error is computed at a node, supposing it is a leaf, and backed-up error is computed at the same node for the case, in which the subtree is not pruned. If the static error is less than or equal to the backed-up error, then the subtree is pruned at that node, and the tree node is converted into a leaf node.
CHAPTER 2. OVERVIEW OF REGRESSION TECHNIQUES
28
2.5.3 M5 M5 is another system [45] that builds tree-based models for the regression task, similar to CART and RETIS. Although the tree construction in M5 is similar to CART, the advantage of M5 over CART is that the trees generated M5 are generally much smaller than regression trees. Standard deviation is employed as the error criterion in M5, instead of variance as used in CART. The reduction on the error (2.23) on subregions after splitting a region is the measure used to decide on splitting:
error = �(X) ?
X jXi j i
jXj �(Xi):
(2.23)
where � is standard deviation and i is the number of subregions of a region whose instances are denoted by X. After examining all possible splits, M5 chooses the one that maximizes the expected error reduction (2.23). M5 is also similar to RETIS in that it employs a linear regression model on the nodes to estimate responses by using standard linear regression techniques [43]. These linear models are constructed on all the nodes, starting from the root down to the leaves. However, instead of using all the attributes or predictors, a model at a node is restricted to the attributes referenced by linear models in the subtree of that node. After constructing the tree and forming linear models at the nodes as described above, each model is simpli ed by eliminating parameters to maximize its accuracy. The elimination of parameters generally causes an increase in the average residual. To obtain linear models with fewer of parameters, the value is multiplied by (n + p)(n ? p), where n is the number of instances and p is the number of parameters in the model. The e�ect is to increase the estimated error of models with many parameters and with a small number of instances or training cases. M5 uses a greedy search to remove variables that contribute little to the model. In some cases, M5 removes all of the variables, leaving only a constant [33]. The pruning process in M5 is the same as RETIS. To prune the constructed tree, each non-leaf node is examined, starting near the bottom. If the estimated
CHAPTER 2. OVERVIEW OF REGRESSION TECHNIQUES
29
error at a node is smaller than its subtree, then that node is pruned. A smoothing process is employed in M5 for estimation of the response variable. The smoothing process described in [33] is as follows: 1. The predicted value at the leaf is the value computed by the model at that leaf. 2. If the instance follows branch Si of subtree S , let ni be the number of training cases at Si, PV (Si) the predicted value at Si, and M (S ) the value given by the model at S . The predicted value at S is given by recursive Equation 2.24
PV (S ) = niPV (Sni)++kkM (S ) i
(2.24)
where k is the smoothing constant. The accuracy of the model is enhanced by the smoothing process. Improvements in accuracy and model simpli cation are obtained by M5 over CART, some applications with di�erent training sets are reported in [45]
2.6 Multivariate Adaptive Regression Splines As stated in the previous section, a fundamental drawback of recursive partitioning regression (CART) is the lack of continuity, which a�ects the accuracy. Another problem with that method is its inability to provide good approximations to some functions, even to the most simple linear ones. Multivariate adaptive regression splines (MARS) addresses these two problems of recursive partitioning regression, in order to achieve higher accuracy [19].
CHAPTER 2. OVERVIEW OF REGRESSION TECHNIQUES
30
2.6.1 Piecewise Parametric Fitting and Splines There are di�erent paradigms for global parametric modeling to generalize low dimensional data. One of them is piecewise parametric tting. The basic idea is to approximate a function by several simple parametric functions (usually low order polynomials) each de ned over di�erent subregions of the training set. The constraint for the formation of polynomial tting is that it must be continuous at every point. The most popular piecewise polynomial tting procedures are based on splines, where the parametric functions are polynomials of degree q. The procedure is implemented by constructing a set of globally de ned basis functions. These functions span the space of the qth order spline approximations, and t the coe�cients of the basis function to the data using the least squares technique. The spline basis functions are denoted by,
f(x ? tk )q gK + 1
(2.25)
where ftk gK is the set of split (knot) locations. The subscript + indicates a value of zero for negative values of the argument. This is known as a truncated power basis in the mathematical literature. A general review of splines is given in [12]. 1
2.6.2 MARS Algorithm The MARS algorithm is a modi ed recursive partitioning algorithm, given in the previous section, which addresses the problems stated above. The reason that recursive partitioning algorithms are discontinuous, the rst problem, is the use of the step function. If the step function were replaced everywhere by a continuous function where it appears in that algorithm (lines 6, 12 and 13), it could produce a continuous model. The step function employed in that algorithm can be considered as a special case of a spline basis function, where q = 0. The one-sided truncated power basis functions for representing qth order
CHAPTER 2. OVERVIEW OF REGRESSION TECHNIQUES
31
splines are
bq(x ? t) = (x ? t)q (2.26) where t is the knot location, q is the order of the spline, and the subscript indicates the positive part of the argument. For q > 0, the spline approximation is continuous. A two-sided truncated power basis is of the form +
b�q (x ? t) = [�(x ? t)]q
+
(2.27)
The step functions that appear in recursive partitioning algorithms are seen to be two-sided truncated power basis functions for q = 0 splines. The solution for discontinuity is solved by employing spline functions, of the order of q > 0, instead of step functions in the algorithm. The second modi cation is related to the second problem, the inability of the algorithm to provide good approximations to certain functions. After the rst modi cation, the algorithm tends to involve functions with more than a few variables (higher order interactions). At each split, one such function is removed, and two new functions are produced with one more variable. This causes a one level increase in the interaction order. With such complex functions, having high level orders, it becomes di�cult to approximate simple functions like linear ones. The solution for this problem is not to delete the lower order parent after splitting. With this modi cation, all basis functions now become eligible for further splitting. The new model involves either high or low order interactions, or both. A third problem emerges after the employment of splines in the algorithm. Since the algorithm allows multiple splits on the same predictor, along a single path of the binary tree, nal basis functions may include several factors, involving the same variable in their product. For q > 0, higher orders than q may be produced on a single predictor. After the second modi cation, not deleting the parents after splits, a restriction on the basis function can be applied to involve distinct predictors. Since we do not remove the parent after splitting, many such splits can be
CHAPTER 2. OVERVIEW OF REGRESSION TECHNIQUES
32
done on the same parent. By employing another split to that parent instead of splitting a child, MARS does not increase the depth or add a new factor to the product. One remaining problem, which is not solved with MARS, is the value of q. The general idea is to use q = 1. A discussion of this problem is given in [19]. In summary, the following modi cations are done to the recursive partitioning algorithm: (a) Replacing the step function H [�(x ? t)] by a truncated power basis function [�(x ? t)]q ; (b) not removing the parent basis function Bm� after its split, thereby making it and both its daughters eligible for further splitting; (c) restricting the product associated with each basis function to factors involving distinct predictor variables. +
After using two-sided truncated power basis functions, instead of a step function, the MARS algorithm (shown in Figure 2.15), now produces multivariate spline basis functions of the following form:
Bmq
( )
(x) =
K Ym k=1
H [skm:(xv k;m ? tkm)]q (
)
+
(2.28)
For pruning of the resulting model after the MARS algorithm, it is now no longer necessary to employ the two-at-a-time deletion strategy used in the previous algorithm. Because the parents are not deleted thus, there will be no holes left after any deletion. Any pruning algorithm can be employed for the MARS procedure. In the algorithm above, truncated power basis functions (q = 1) are substituted for step functions in lines 6, 12 and 13. The parent basis function is included in the modi ed model in line 6 and remains in the model through lines 12-14. Basis function products are constrained to contain factors involving distinct variables by the control loop in line 4. Figure 2.16 illustrates the regions after constructing the model. Note that the split regions are not deleted from the model, as in CART, and another splitting for the same region can be applied with the same or a di�erent predictor.
CHAPTER 2. OVERVIEW OF REGRESSION TECHNIQUES
33
[1] B (x) 1; M = 2 [2] Loop until M > Mmax : lof � 1 [3] For m = 1 to M ? 1 do : [4] For v 2= fv(k; m)j1 � k � Km g [5] For t 2 P fxvj jBm(xj ) > 0g m? a B (x) + a B (x)H [+(x ? t)] [6] g i i m m v i +aM Bm(x)H [?(xv ? t)] [7] lof mina1:::aM ?1 LOF (g) [8] if lof < lof � , then lof � lof ; m� m; v� [9] end for [10] end for [11] end for [12] BM (x) Bm� (x)H [+(xv� ? t�)]? [13] BM (x) Bm� (x)H [?(xv� ? t�)]? [14] M M + 2 [15] end loop [16] end algorithm 1
=1
1
+
+
v ; t�
t end if
+1
Figure 2.15. MARS Algorithm
2.7 Discussion We have reviewed six di�erent regression techniques, each having di�erent characteristics when compared to others. Three of them (instance-based regression, locally weighted regression and rule-based regression) have been developed mainly by the machine learning community, and others (projection pursuit regression, regression tree induction, and multivariate adaptive regression splines) mainly by the statistics community. The common property of all R1 a
x1
R2
R3
b
x2
R4
x1
R4
a R5
b
R3 a
R5
c R6
R7
d
x2
R8
R9
Figure 2.16. An example for the regions of MARS algorithm
CHAPTER 2. OVERVIEW OF REGRESSION TECHNIQUES
34
these methods is that all of them are non-parametric, and they are the most popular among current regression methods. In instance-based learning, a lazy approach is employed, where no model is constructed in the training phase. The model is the training set itself. The whole computational complexity of this method is in its prediction, especially the determination of neighbor instances. The prediction is based on the location of the query, and it is computed according to the target values of neighbor instances. The criterion used to detect neighbor instances is the similarity measure based on distance. Locally weighted regression is another lazy (or memory-based) approach, where the instances are simply stored in memory during the training phase. The di�erence between locally weighted regression and instance-based methods is in the prediction phase, where a local parametric model is constructed for each query instance by using the neighbor instances. Since, at each query instance, a new local model is constructed, it is more complex than the previous approach. The projection pursuit regression method has the ability to reduce dimensionality by projecting instances to lower dimensional (one or two) vectors or surfaces. The idea of projection is also used in exploratory data analysis to determine clusters on projections [21]. The same idea is adapted to regression. Successive re nement technique is also applied in the projection pursuit regression, which shows signi cant improvements for most applications. All the remaining methods estimate models by partitioning the training set into regions. Rule-based regression techniques accomplish this by partitioning the data using the rule induction techniques of machine learning. On the other hand, in the other partitioning methods (CART, RETIS, M5 and MARS), this is done by splicing the features recursively into two regions, by constructing a binary regression tree. The main di�erence between these methods and MARS is that MARS is continuous at the borders of the partitioned regions, while others are discrete. CART simply uses the averages of the regions for prediction; RETIS and M5 make prediction by constructing linear models. On the other hand, since MARS produces a large number of overlapping regions,
CHAPTER 2. OVERVIEW OF REGRESSION TECHNIQUES
35
its computational complexity is larger than other partitioning methods.
Properties Memory-based Partitioning Interpretable Adaptive Incremental
Instance Locally Proj. Rule Tree Adaptive Based Weighted Pursuit Based Based Reg. Reg. Reg. Reg. Reg. Reg. Splines (KNN) (LOESS) (PPR) (Rule) (CART) (MARS)
p p
p
p p
p p
p p p
p p p
p p p
Table 2.2. Properties of Regression Algorithms (the names of programs developed with those methods are shown in parentheses). The properties of regression methods are summarized in Table 2.2. Five di�erent properties are used to compare the algorithms. The main characteristic of memory-based models is storing the instances and delaying processing to the prediction phase. The model constructed is in fact the training set itself. Recursive partitioning algorithms construct the models by partitioning the data into regions. Interpretability is one of the main concerns for most knowledge acquisition and knowledge engineering applications, in order to extract information that can be veri ed by experts. The algorithms covered in this chapter that induce models have this property. If the locations of the test or query instances a�ect the model, prediction and contribution of variables in the regression task, such algorithms are called adaptive. Another important property given in the table is incremental property of the algorithm. This is the inverse of batch processing. For large training sets, or databases, particularly processing can be done without loading all of the data set into memory if this property is satis ed. The order of the training instances is ignored when constructing any such model.
Chapter 3 Regression by Partitioning Feature Projections In this chapter we describe the new regression method called Regression by Partitioning Feature Projections (RPFP). RPFP is an instance-based method where most properties are similar to other instance-based methods such that it is a local, memory-based, lazy and distance-based approach. All such properties of RPFP will be described and discussed in detail in the chapter. In developing this technique, we have incorporated also some advantages of eager approaches, while eliminating most limitations of both eager and lazy methods. In Chapter 2, previous approaches for regression were described. If the parametric form of the function to be approximated is known, the best solution is to approximate the parameters of the function. For example if function is linear, linear least squares regression can produce accurate results in the following form. p
^f(xq ) = X j :xqj + 0 j =1
(3.1)
here, p is the number of features, xq is the query point, xqj is the j th feature value of the query, j is the j th parameter of the function and ^f(xq) is the 36
CHAPTER 3. REGRESSION BY PARTITIONING FEATURE PROJECTIONS
37
estimated value of the function for the query point xqj . However, the assumption that the approximated function is linear is a very strong one and causes large bias error, especially for many real domains. Many modern techniques have been developed, where no assumption is made about the form of the approximated function in order to achieve much better results. Tree and rule induction algorithms of machine learning are such non-parametric approaches. Additive regression models [30] and feature projection based classi cation methods of machine learning such as CFP [24] improves the linear parametric form of the (3.1) by replacing the parameters in this equation with nonparametric functions of the following form. p
^f(x) = X ^gj (xqj ) j =1
(3.2)
where ^gj is the estimation for feature j .
With this form, the assumption that the approximated function is parametric is removed. However, it is assumed that the input features or variables additively form the approximated function. It is shown that for classi cation tasks of many real world domains, for example that of the data sets used for classi cation in UCI repository, additive forms achieves high accuracy [31, 24]. Even though regression and classi cation are similar problems, one predicts a continuous and the other predicts a categorical target, their characteristics are di�erent, and they are investigated independently in the literature. In order to achieve high accuracies in regression problems, interaction e�ects of features, additional to main (additive) e�ects, must be handled properly. This is also shown empirically in Chapter 4 by comparing the additive form of RPFP with its original form by using many real world domains obtained from di�erent sources. There are many approximation techniques that can cope with interaction e�ects. KNN [40] and partitioning approaches such as rule-based regression [59, 60] tree-based regression [9, 23] and MARS [19] are such techniques. Among projection-based methods, only projection pursuit regression, PPR [20],
CHAPTER 3. REGRESSION BY PARTITIONING FEATURE PROJECTIONS
38
handles interactions with the following model. p M ^f(x) = X ^gm (X mj :xqj ) m=1
j =1
(3.3)
where M is the number of projections, mj is the j th parameter of the mth projection axis and fm is the smooth or approximation function for mth projection axis. Here the instances are not projected to feature dimensions. Instead, they are projected to projection axes, found through complex computations [20]. The whole model is constructed with successive M steps, and at each step of the model construction process, a new projection is found which is a linear equation. We think that if there are both interactions and additive (main) e�ects in a domain, most models that handle interactions, including PPR, may loose some information by not evaluating main e�ects by using individual features. RPFP is a projection-based approach that can handle interactions. However, if main e�ects are higher than interaction e�ects in a domain, or some features have only main e�ects, which is probably the case for most real world regression problems, the functional form of RPFP, given below (3.4) enables those e�ects to be incorporated in the solution properly. ^f(xq ) =
X
p X
R0 2fRs;Xg j =1
^gj;R0 (xq )I (j; R0 )
(3.4)
where R0 is either the whole instance space X or the region obtained after s partitioning steps, Rs; and I (j ) is an indicator function whose value is either 0 or 1, according to the feature j . RPFP incorporates interactions as partitioning techniques do, by partitioning the instance space. However, this partitioning does not produce disjoint regions, such as in C4.5 for classi cation and CART for regression. Instead, these are overlapping regions similar to MARS, DART and KNN. Query instances are always close to the center of these regions, which is the way nearly all lazy approaches work. If some features do not have interactions with others,
CHAPTER 3. REGRESSION BY PARTITIONING FEATURE PROJECTIONS
39
which is the situation for most cases, RPFP incorporate main e�ects of these features as much as possible by using the whole instance space, with much crowded instances as additive methods. It decreases the e�ects of curse of dimensionality, a problem for almost all other approximation techniques except projection-based approaches. On the other hand, if a feature has interactions with others, the region after partitioning, Rs, is used instead.
3.1 RPFP Algorithm The main property of RPFP is that, a di�erent approximation is done for each feature by using the projections of the training instances on each feature dimension separately. These approximations may be di�erent for each feature and for each query point. A partitioning strategy is employed in the algorithm and some portion of the data is removed from the instance space at each step. The same approximations are repeated for a sequence of partitioning steps, where it continues until reaching a small number of instances. For all query instances the procedure described above is applied. This produces di�erent regions and di�erent contribution of features for each query in the instance space, which enables the context-sensitive solutions.
3.1.1 Training Training involves simply storing the training set as their projections to the features. This is done by associating a copy of target value with each feature dimension, then sorting the instances for each feature dimension according to their feature values. If there are missing feature values, they are placed at the farthest end of the feature dimensions. These instances, having missing values for the feature dimension, do not e�ect the results for those features. An example training set with 2 features and 10 training examples projected to these features is shown in Figure 3.1.
CHAPTER 3. REGRESSION BY PARTITIONING FEATURE PROJECTIONS
40
f : 2 4 6 8 9 11 14 16 17 18 TARGET : 14 14:5 16 2 3 3:5 4 8 9 8:5 1
f : 1 TARGET : 14 2
3 9
4 6 8 20 24 28 32 36 3 8:5 2 4 16 8 14:5 3:5
Figure 3.1. An example training set projected to two features:f and f . 1
2
3.1.2 Approximation using Feature Projections In this section, we describe how the individual predictions of features are computed for continuous and categorical features.
3.1.2.1 Continuous Features Approximation at feature projections is the rst stage in the prediction phase of RPFP algorithm. Since the location of the query instance is known, the approximation is done according to this location. At each feature dimension, a separate approximation is obtained by using the value of the query instance for that feature. Taylor's theorem states that if a region is local enough, any continuous function can be well approximated by a low order polynomial within this region [23]. By determining a di�erent linear equation for each di�erent query value at feature dimensions, we can form the function g(xq ) in Equation 3.4, even it is complex. Given the linear equation to be approximated in the following form, Equation 3.5, the classical approach is to approximate coe�cients of this equation using the least squares error criterion in Equation 3.6. ^yqf = 0f + 1f xqf
(3.5)
CHAPTER 3. REGRESSION BY PARTITIONING FEATURE PROJECTIONS n X
Ef =
i=1
(yi ? ^yif )
41
(3.6)
2
where n is the number of training instances, ^yqf is the approximation for query at feature f , and yi is the actual target value. We employ the weighted linear least squares approximation for the feature predictions. Similar to the standard linear least squares approach, we nd the parameters of (3.5), f and f for each feature by employing a weight function to the least squares error, in order to determine weighted linear least squares approximation. 0
1
Ef = and
n X i=1
wif (yi ? ^yif )
(3.7)
2
wif = (x ?1 x ) if qf
(3.8)
2
By taking the derivatives of (3.9) to minimize the error Ef , we nd the parameters f and f for weighted linear least squares approximation. 0
1
Ef =
n X i=1
wif (yi ? f ? f xif ) 0
1
2
(3.9)
From @ @E0f = 0 n X
n X
n X
i=1
i=1
f ( wif ) + f ( xif wif ) = 0
1
i=1
yiwif
(3.10)
xif yiwif
(3.11)
From @ @E1f = 0 n X
n X
f ( xif wif ) + f ( xif wif ) = 0
1
i=1
2
i=1
n X i=1
By solving the above equations, f and f are found as follows. Pn y w ? Pn x w f = i i ifPn wf i if if if i SPf f = SSx f 0
0
1
1
=1
=1
1
=1
(3.12) (3.13)
CHAPTER 3. REGRESSION BY PARTITIONING FEATURE PROJECTIONS
where
SPf =
and
n X i=1
42
Pn x w )(Pn y w ) ( xif yiwif ? i ifPnif w i i if if i =1
(3.14)
Pn x w ) ( if if i xif wif ? P n w if i
(3.15)
SSxf =
=1
=1
n X i=1
=1
2
2
=1
To illustrate the feature averaging phase, we can compute a prediction for an example query for the training set given in Figure 3.1. Suppose f = 12 and f = 5 are feature values of a query instance. Coe�cients of the approximated weighted linear least squares equations for these features and the feature predictions are shown in Figure 3.2. 1
2
f1 : 5:037 f1 : ?0:034 y�f1 : 4:630 0 1
f2 : 6:779 f2 : ?0:091 y�f2 : 6:320 0 1
Figure 3.2. Approximations for Feature Projections
3.1.2.2 Categorical Features The weighted linear least squares approximation is not appropriate for some cases encountered in real life applications. One of them is categorical feature values. Since there is not an ordering between most categorical features extracting a linear relation at any region the query instance fall, is not meaningful. On the other hand, if a categorical feature has an ordering between categorical values (e.g. days of a week), then it can be evaluated by de ning it as linear. Another situation is possible for linear features. If all the instances have same linear value for a particular feature dimension, the slope of the equation will be in nity. This situation can be determined by looking at the value of SSx in Equation 3.15. If SSx = 0, we can not employ the weighted linear least squares approximation. This re nement is done to determine such situations together with categorical features.
CHAPTER 3. REGRESSION BY PARTITIONING FEATURE PROJECTIONS
43
Those situations can be handled easily by employing an averaging procedure instead of linear approximation. For the RPFP algorithm, mean values of the target values are used as an approximation on such feature dimensions, as shown in Equation 3.16. If none of the values of a categorical feature matches the feature value of the query instance, the contribution of that feature in the nal prediction is excluded.
y�qf =
Pn
i=1 yi
n
(3.16)
3.1.3 Local Weight Some regions on a feature dimension may produce better approximations when compared to others. In order to obtain a degree of prediction ability of a region on feature dimension, we employ a measure in the prediction algorithm. If the region that query point falls in is smooth, we give a high weight to that feature in the nal prediction. By this way we reduce the e�ect of irrelevant features, as well as the irrelevant regions of a feature dimension. This establishes an adaptive or context sensitive nature, where at di�erent locations in the instance space, the contribution of features on the nal approximation di�ers.
3.1.3.1 Continuous Features In order to measure the degree of smoothness for continuous features we compute the distance weighted mean squared residuals. Residuals are di�erences between target values of the instances and their predicted values found by weighted linear least squares approximation for the feature value of each instance. We denote this measure with Vf as given in (3.18). By subtracting it from the variance of the target values of all instances, Vall, we nd the explained variance according to the region the query instance falls in. By normalizing it with the variance of training set we obtain a measure, called prediction index (PI) (3.20). We use the squared PI as the local weight (LW) for each feature (3.21).
CHAPTER 3. REGRESSION BY PARTITIONING FEATURE PROJECTIONS
Pn (y ? y�)2 Vall = i=1 i
(3.17)
n where y� is the mean of target values of training set. Vf =
Pn
0
i ? 0 ? 1xif ) i=1 wi (yP n w0 i=1 i
44
2
(3.18)
where wi0 is de ned in Equation (3.19). For an overview of weight functions for regression problems see [7].
wif0 = 1 + (x 1? x ) if qf
2
(3.19)
Prediction index of feature f :
PIf = VallV? Vf
(3.20)
all
Local weight of feature f :
8 2 < PI if PIf > 0 LWf = : f 0 otherwise
(3.21)
For the example query on the training data in Figure 3.1 the local weight for f is 0:405, local weight for f is 0:297. 1
2
3.1.3.2 Categorical Features For the computation of local weight for categorical features, a re nement is required. By replacing (3.18) with (3.22), in such a case, we can use the same procedure used for continuous features for the computation of local weight. Note that wif0 in (3.19) will be 1 for all the same categorical values.
Vf =
PNc
0
i=1 wi (yi ? ^yqf ) PNc w0 i=1 i
2
(3.22)
where Nc is the number of instances having the same categorical value, and ^yqf is the average of their target values.
CHAPTER 3. REGRESSION BY PARTITIONING FEATURE PROJECTIONS
45
3.1.4 Partitioning Algorithm Partitioning enables us to deal with interactions among features. If there is no interaction among some features, we use the results we obtained and recorded for these features before the partitioning of the instance space. We try to gure out interactions by looking at local weights before and after partitioning. Partitioning is an iterative procedure applied to each query instance, where the remaining nal region may di�er for each query instance. It improves the context-sensitive nature of RPFP such that, the edges of the nal region, a hyper-rectangle, are not equal in length for each query, according to the relevancy of features for the prediction of the query. This causes longer edges for less relevant features, and much shorter edges for relevant ones. The region is formed by the partitioning algorithm that will be described in this section, by using an iterative procedure that continues until a small number of instances, say k, are left. This is taken by default 10 in the experiments. In the rst step of partitioning, the predictions and local weights of the features are found and recorded. The feature with the highest local weight for the partitioning of the data is used. Partitioning is done on this feature dimension. The farthest instances to the query value on this feature dimension are marked. The number of these instances are determined by using local weight of that feature, then they are removed on all feature dimensions. If the feature selected for partitioning is nominal, simply all the instances having di�erent nominal values on that feature are also removed. After shrinking the marked instances on all feature projections, partitioning continues by selecting a new feature at each step. The partitioning algorithm applies a strategy in order to select the right feature for partitioning. For example, if the feature selected in the rst step again has the highest local weight for the query in the second step, then the feature having the second highest local weight is selected. By this way, we can pass possible ridges in the data set, so that, selecting a feature with small local weight or that of some others, may increase their local weights in forthcoming steps signi cantly. However, at a particular step the features with zero local weights are not used for partitioning for that step, unless all local weights
CHAPTER 3. REGRESSION BY PARTITIONING FEATURE PROJECTIONS
100
f2
100 9
f2
27
9,27 17
17
17
17
q
3
q
19
3,19 50
46
19
19 11
50
11 13
2, 2 13, 19
11 11
19
13
19
13,19
35 35 2 3 10 0
9
11 13 17 19 19 27 35 5
f1 10
(a) Training set and projections to features.
11 13 17 19 19 10 0
5
f1 10
(b) Remaining instances and their projections after first step of partitioning.
Figure 3.3. Example data set and its partitioning. in a particular step are zero. This strategy decreases the e�ect of irrelevant features, especially in high-dimensional domains. Since all the features may have been selected in previous steps, a counter is associated with each feature in order to give chance to di�erent features each time. An example training set and it partitioning on feature f is illustrated in Figure 3.3. In this example, we suppose that local weight of f is 0:5 and k is small enough. 1
1
A di�erent strategy is applied for nominal features. If a nominal feature is selected for partitioning once, it is never used again for partitioning. The partitioning algorithm of RPFP is shown in Figure 3.4. The partitioning is repeated for all query instances by using a copy of the feature projections of the data obtained in the training phase. At line 30, in Figure 3.4, number of steps for the partitioning is recorded to be used in the nal prediction phase. At line 27, a partitioning of the remaining training set, D0 , is employed along the feature dimension, MaxF , selected for partitioning. Suppose, at any particular step of partitioning, the best feature along with the partitioning will occur has been found according to the partitioning strategy. We must determine the number of instances that will remain after partitioning, n0 , according to the local weight of the feature in that step. However,
CHAPTER 3. REGRESSION BY PARTITIONING FEATURE PROJECTIONS
[1] n0 n; Smax log n; s [2] For f = 1 to p [3] priority(f ) Smax [4] end for
0; D0
D
[5] While n0 > k and s < Smax [6] s s+1 [7] For f = 1 to p [8] if xqf is known then [9] compute and record LWf (s) and y�qf (s) on D0 [10] end if [11] end for [12] MaxF any f where xqf is known and LWf (s) > 0 [13] For f = 1 to p [14] if LWf (s) > 0 and xqf is known then [15] if priority(f ) > priority(Maxf ) then MaxF f end if [16] if priority(f ) = priority(Maxf ) then [17] if LWf (s) > LWMaxF (s) then MaxF f end if [18] end if [19] end if [20] end for [21] if MaxF is continuous then [22] priority(MaxF ) priority(MaxF ) ? 1 [23] end if [24] if MaxF is nominal then [25] priority(MaxF ) 0 [26] end0 if [27] D0 partition0 (D0 ; MaxF ) [28] n size of D [29] end while [30] S s Figure 3.4. Partitioning Algorithm
47
CHAPTER 3. REGRESSION BY PARTITIONING FEATURE PROJECTIONS
48
if we use local weight as a ratio of removing instances, since it takes values between 0 and 1, all the instances will remain or all of them will be removed for extreme values. The solution to this problem is brought by windowing the local weight to a narrower interval. Its size is determined by a windowing constant, cw , that takes values between 0 and 0.5, leading a local weight interval, [0:5 � cw ]. Local weights are transformed to this interval. Thus for cw = 0:3, the value we have used in experiments, the largest local weight becomes LWmax = 0:8 and smallest one becomes LWmin = 0:3 after this transformation. The equation used for transformation is given below (3.23).
na = (nb ? mf )(LWmax ? (LWmax ? LWmin )LWf ) + mf
(3.23)
where na and nb are number of instances after and before partitioning respectively, and mf is the number of missing values at dimension f . After determining the number of instances that will remain after partitioning according to the local weight of the selected feature, the farthest instances according to the query value, in the selected feature dimensions are marked until reaching that number of instances are left. The instances having missing values for that feature are excluded from this marking process, and they remain at the end of the feature dimension. If other feature values of such missing valued instances are close to their query values in those dimensions, this enables better accuracy for their predictions, however we always exclude them from the computations in the dimension where their values are missing. Finally feature values of all marked instances are removed from all dimensions. For the example data set, the instances after rst step of partitioning according to f , which has higher local weight, is shown in Figure 3.5; and new results are shown in Figure 3.6. 1
3.1.5 Prediction The partitioning process results in a region with the query instance in its center. Then we compare local weights obtained for a feature for this region and for the whole region before partitioning. This comparison is performed for each
CHAPTER 3. REGRESSION BY PARTITIONING FEATURE PROJECTIONS
49
f : 8 9 11 14 16 TARGET : 2 3 3:5 4 8 1
f : 4 8 20 28 36 TARGET : 3 2 4 8 3:5 2
Figure 3.5. Example training set after partitioning.
f1 f1 LWf1 y�f1 0 1
: ?1:759 : 0:476 : 0:959 : 3:950
f2 f2 LW f2 y�f2 0 1
1
: 2:868 : ?0:002 : 0:981 : 2:860
Figure 3.6. Approximations for Feature Projections feature separately. If the local weight of a feature on the initial projections of the instances is larger than that of the projections of the nal region, we use the initial computations for prediction and local weight of that feature. Otherwise we use the computations for the nal region for that feature in the nal prediction. If a query value for a feature is missing, that feature is not used in the nal prediction. Finally a prediction is done for a query instance by computing the weighted average of feature predictions, where weights are the computed local weights. Prediction algorithm is shown in Figure 3.7. For the query in the example above, the solution is: prediction = (0:959 � 3:95 + 0:981 � 2:86)=1:94 = 3:4.
3.2 RPFP-N Algorithm We have extended the RPFP algorithm to RPFP-N in order to use it with domains with noisy target values. Instance-based algorithms are robust to noisy or extreme input feature values since the query instances will be far from
CHAPTER 3. REGRESSION BY PARTITIONING FEATURE PROJECTIONS
50
[1] Prediction 0; WeightSum 0 [2] S , LW and y�q are determined by partitioning algorithm. [3] For feature f = 1 to p [4] if xqf is known then [5] if LWf (0) > LWf (S ) then [6] Prediction Prediction + y�qf (0) [7] WeightSum WeightSum + LWf (0) [8] end if [9] else [10] Prediction Prediction + y�qf (S ) [11] WeightSum WeightSum + LWf (S ) [12] end else [13] end if [14] end for [15] Prediction Prediction=WeightSum Figure 3.7. Prediction Algorithm these instances and their e�ect will be very small [40]. However if the target values of training instances are noisy, this situation must be handled. We have modi ed RPFP algorithm, by changing only the feature prediction phase, in order to cope with noisy domains, as described in Section 3.1.2. We have employed an averaging procedure in RPFP-N, instead of weighted linear least squares approximation for feature prediction. This is distance weighted median and its algorithm is shown in Figure 3.8, which is used for both categorical and continuous features. For categorical features, the instances which are in the same category as the feature value of query instance are used for computation of both feature prediction and local weight. In the algorithm, equation (3.19) is used as the weight function for feature prediction. After determining the prediction of a feature, in order to determine its local weight, (3.22) is employed in (3.20), for both categorical and continues features.
CHAPTER 3. REGRESSION BY PARTITIONING FEATURE PROJECTIONS
[1] [2] [3] [3] [4] [5] [6] [7]
51
sum 0 0 weight Pni wif0 sort instances according to their target values While sum < weight=2 take a new instance in the sorted order feature prediction yi 0 sum sum + wif end while ^yqf feature prediction =1
Figure 3.8. Weighted Median Algorithm
3.3 Properties of RPFP In this section, we describe important properties and problems for regression algorithms and evaluate RPFP according to them.
3.3.1 Curse of Dimensionality The curse of dimensionality is a problem for nearly all learning and prediction methods that do not make strong assumptions about the domains. There are some models that handle this situation by making some assumptions. Assumption made in additive models is that features separately contribute to the solutions, as in (3.2). Another solution to this problem comes with projection pursuit regression. The instance space is projected to a lower dimensional space (generally one or two dimensional). However, this approach also has an assumption such that, the information in data can be evaluated by using only the projection of data to some projection axes. Assuming linearity between input features and target in the prediction problems can be seen as a sub-category of additive models by comparing (3.1) and (3.2); and it is a strong assumption that is employed in classical linear regression and linear discriminant analysis, which are parametric models. The strong assumptions made in prediction tasks cause large bias errors in most domains. This is also what the curse of dimensionality problem causes in other non-parametric learning methods. Therefore, generally the choice is
CHAPTER 3. REGRESSION BY PARTITIONING FEATURE PROJECTIONS
52
whether to put up with strong assumptions or with the curse of dimensionality. Most modern techniques for regression in the literature, such as those described in Chapter 2, are developed in order to obtain better accuracy results by eliminating assumptions employed in classical, generally linear and parametric methods. So developing some measures to decrease the e�ects of curse of dimensionality is important for modern techniques in order to achieve higher accuracies. The problem can be illustrated with a simple example. Consider a one dimensional input space, where all instances are uniformly distributed and feature values range from 0 to 1. In this situation half of the feature dimension contains half of the instances. If we add one more feature with the same properties to the instance space, using half of each feature dimension will include 1=4th of the instances. One more feature will decrease this ratio to 1=8, and so on exponentially. Adding new features will cause much sparse instance spaces. In order to keep the same ratio for the number of instances in a region we have to increase the volume of the region exponentially. This is because in high dimensional spaces it is impossible to construct regions that have small size simultaneously in all directions and containing su�cient training data; thus, using large regions for approximation causes large bias errors [23]. !1
size(Rk) = k =p (3.24) size(R ) n where k is the number of training instances in region Rk and R is the instance space. 0
0
Thus, in high dimensions the size of the region will be close to R even for k = 1 in (3.24). Curse of dimensionality is a much more important problem for KNN, when compared to eager methods. Nearly all eager learning approaches (Rule-based learning, tree-based learning and MARS) have some measures to decrease the e�ect of the curse of dimensionality. The most important one is to properly select the features to be included in the model, and decrease the number of dimensions. This is also the reason for the success of eager approaches against irrelevant features. 0
CHAPTER 3. REGRESSION BY PARTITIONING FEATURE PROJECTIONS
53
Another measure is the adaptive nature of partitioning eager approaches. For example, in a uniformly distributed space, after a normalization process, KNN always has regions with a sphere shape, having the same diameter in all dimensions. However this volume is a hyper-rectangle for most eager approaches rather than a sphere or hypercube, since the edge lengths are determined according to the position of the query in the instance space. Intuitively, important features have smaller edges when compared to unimportant features at that location. Some solutions similar to these measures are available for KNN, by using external feature selection and feature weighting algorithms before applying it [61]. Feature selection can eliminate irrelevant features and feature weighting can produce elliptic regions instead of spherical ones. However, there is still a problem, that the shape of this elliptic region does not change according to the location of the query in the instance space, which is dynamic in most eager approaches. On the other hand, the problem of curse of dimensionality is much important for KNN when the task is regression instead of classi cation. There is an important empirical evidence that KNN can achieve high accuracies in many domains for classi cation. However this is not the situation for regression [23]. This property of KNN will be discussed in the following sections. RPFP is a member of instance-based approaches, that are local, memorybased, lazy, non-parametric and do not depend on strong assumptions such as those described above. However, RPFP has some measures to decrease the e�ect of curse of dimensionality. In the nal prediction phase of RPFP, a subset of features are used in additive form, only for their main e�ects on the target. The curse of dimensionality does not e�ect their contributions, since feature prediction is determined only on that single dimension. For remaining features, the e�ect of curse of dimensionality is not severe. The partitioning algorithm either does not allow irrelevant features to e�ect partitioning (if their local weights are 0), or their e�ects are small since a dynamic partitioning occurs according to their local
CHAPTER 3. REGRESSION BY PARTITIONING FEATURE PROJECTIONS
54
weights. The partitioning strategy of RPFP forms adaptive regions. According to the position of each query instance, the edge lengths of these regions for each feature dimension may change. For remaining features, predictions are done on these regions.
3.3.2 Bias-variance Trade-o� Following the considerations presented in [22], two important error types collectively e�ect the success of learning approaches according to the underlying problem they are applied. They are bias and variance errors, caused by under tting and over- tting respectively on the learning application. A decrease in one of those errors, generally causes an increase on the other. However the behavior of interaction between bias and variance di�ers according to the algorithm and the domains the algorithms are applied. If we illustrate these error components with an example, large K values in the application of KNN algorithm may cause large bias error, on the other hand, small K values may cause large variance error. Many factors are e�ective for these error components. The curse of dimensionality, model complexity, model exibility, local vs. global approximations, assumptions of the learning approach, noise, missing attribute values, number of features and number of observations in applications are some of those. For example large number of features, small number of training instances, many missing values, large local approximation regions, strong assumptions and simple models are among reasons of bias error. The e�ect of these issues on RPFP will be discussed in the following sections. An important result presented in [22] is that for classi cation tasks the major component of the error is formed by variance, on the other hand, for regression problems the bias error becomes important. This is shown as the main reason for the success of the simple nearest neighbor approach such that it over-performs some sophisticated methods for many classi cation tasks even though the curse of dimensionality problem of KNN causes strong bias. However, this is not the situation for regression, and the e�ect of bias error is much important unless the underlying domain includes small number of features or
CHAPTER 3. REGRESSION BY PARTITIONING FEATURE PROJECTIONS
55
large number of observations. In learning problems, this trade-o� is unavoidable and RPFP casts its vote for variance by employing many arguments to decrease the bias error. The way for handling bias error caused by the curse of dimensionality is described in the previous section. Besides, it does not make strong assumptions as nonparametric methods. It develops exible, adaptive and locally weighted approximations in small local projections at each feature dimension for each query instance. All these things may increase the over- tting, which causes an increase on the variance error. However empirical results show that RPFP is much more successful than KNN, which justi es these claims stated about the behavior of classi cation and regression for the bias-variance trade-o�.
3.3.3 Model Complexity and Occam's Razor William of Occam's Razor principle states that \Entities should not be multiplied beyond necessity" [14]. This idea has been accepted theoretically in many disciplines including machine learning. Its adaptation on learning approaches states that, simpler models must be preferred to complex ones. Two di�erent versions of this idea are described in [14]. One of them is, \Given two models with the same accuracy, the simpler one must be selected because the simplicity is desirable in itself." Especially, if the interpretation of the induced model is concerned, it is widely accepted. On the other hand, another version states that, \Given two models with the same training-set error, the simpler one should be preferred because it is likely to have lower prediction error on the test set." The well known example for this second interpretation is the pruning applied in some eager learning methods in order to achieve better accuracy in unknown test cases. The second interpretation has been found inconvenient by many researchers recently and some theoretical and empirical work are published supporting this idea [56]. An overview is given by Domingos [14]. The model complexity issue is strongly related with the considerations presented in previous two sections. It is also possible that complex models can produce better accuracies than simpler ones. That is why the belief for second interpretation may cause to
CHAPTER 3. REGRESSION BY PARTITIONING FEATURE PROJECTIONS
56
cease developing new complex techniques that will perform well. Especially with very large databases today, with many instances, avoiding complex models in order to prevent over- tting may cause information loss and poor accuracies. RPFP is exible and complex, such that for di�erent query locations in the instance space, producing in nite number of di�erent local approximation functions on many di�erent domains is possible. If we consider many di�erent feature dimensions having such approximations, RPFP becomes more exible and complex as the number of dimensions increase. The performance results of RPFP on real data sets con rm those resent worries about the second interpretation of the Occam's Razor principle.
3.3.4 Lazy Learning Lazy learning methods defer most processing to the prediction time. The training phase includes mainly storing the instances. Since those methods store instances without any generalization in the memory, they are also referred to as memory-based methods. On the contrary eager learning methods complete most processing in the training phase, before a query is given. These two categories among learning methods is probably the most important in order to di�erentiate learning methods. Both of them have some advantages and disadvantages in itself.
In eager learning, a single global model is used to t all the training data. The generalization of the whole data set may improve accuracy, besides such representations generally produce comprehensible models that allow interpretation by humans. An other advantage of eager approaches is their fast prediction time. However if the training instances change dynamically, forming a new model each time new instances are added may be time consuming for such domains, if the method is not incremental. If an eager method is incremental, this time it will be sensitive to the presentation order of the instances. On the other hand, lazy approaches are useful in dynamic domains, since the main processing is accomplished after the query is given. They are incremental in nature, and it is not order sensitive. Lazy learning enables an other
CHAPTER 3. REGRESSION BY PARTITIONING FEATURE PROJECTIONS
57
advantage such that they attempt to t the training data in the region of the query instance, which may allow better tting. However if the queries are very frequent, this situation makes lazy approaches time consuming because of long prediction time. Besides, their memory cost is larger. Another limitation of lazy approaches is that generally they are not suitable for interpretation, since they do not produce global models. Being a lazy approach, RPFP has the properties of lazy approaches explained above. When compared to KNN its training phase includes an extra sort operation on the train data. However, RPFP avoids some tasks required in the training phase of KNN. They are normalization and lling missing values and they will be discussed in the following sections. Incrementality of RPFP can easily be enabled by inserting new instances on sorted feature projections. Extracting relative importance of features and determining features having interactions using RPFP are some interpretation tasks that can be researched.
3.3.5 Local Learning Local learning is a paradigm devoted to lazy and some eager learning (e.g. recursive partitioning) approaches. It is motivated by the Taylor's theorem which states that if a region is local enough any continuous function can be well approximated by a low order polynomial within it [23]. With this approach the instance space is covered by a set of local regions. Lazy approaches are those mainly bene t from this paradigm, by locating queries in the center of such overlapping regions. However, recursive partitioning approaches that produce disjoint regions have some trouble that the di�erent low order approximations for each region are not continuous at the boundaries of these regions. The adaptive and exible determination of the boundaries of these regions is their main advantage that allows local approximations. However, this does not prevent discontinuity. Some solutions are developed for the discontinuous approximations of recursive partitioning approaches by producing overlapping regions instead of disjoint ones [19, 23]. We have compared RPFP with those improved implementations of recursive partitioning methods in the next chapter.
CHAPTER 3. REGRESSION BY PARTITIONING FEATURE PROJECTIONS
58
The local learning paradigm is strongly related with the curse of dimensionality, which will e�ect the size of the regions and the performance of approximations in these regions. The measures taken for RPFP against the curse of dimensionality are described above. The discontinuity problem of some local learning approaches is not encountered for RPFP, since, being a lazy approach, queries are always centered in these overlapping regions.
3.3.6 Irrelevant Features and Dimensionality The sensitivity to irrelevant features is the most important problem for lazy methods. On the other hand, eager approaches are successful in eliminating the e�ects of irrelevant features. For example, in recursive partitioning regression (e.g. regression tree induction), the partitioning starts from the most signi cant feature and continues recursively by employing less relevant ones. It is very likely that most of the irrelevant features will not be used in constructing a regression tree. The reason that irrelevant features cause problems in lazy learners stems from the distance measure used in those methods. In the nearest neighbor approach for example, nearest instances are determined according to a distance measure in a p dimensional space. This is generally the Euclidean distance. In the computation of distance all features are given equal importance including irrelevant ones. This may cause important instances for a query to go away from the query. Irrelevant features do not cause any di�culty for RPFP, since distances are computed for each feature separately. Another important advantage of RPFP is that it is highly likely for those features to take lower local weights, since the distribution of target values of nearest instances at any query location will be very close to the distribution of the whole target values in the training set (3.20). RPFP is capable of incorporating all features according to their relevancy on the query instance. If the irrelevant features or the relevance of features changes according to the locations of the instance space, this is handled by RPFP, since it is an adaptive approach.
CHAPTER 3. REGRESSION BY PARTITIONING FEATURE PROJECTIONS
59
Eager approaches also handle the adaptivity case by arranging the edge lengths of the regions according to relevancy of feature dimensions in the instance space. However, in contrast to irrelevant features problem, another problem may harm most eager approaches. This is high dimensionality. If the number of features is large when compared to the number training cases, in addition to the curse of dimensionality, it is possible that some features will not be evaluated even they are very relevant. This can be illustrated with regression trees. After a small number of steps in the tree construction process, the number of instances at tree nodes may be exhausted before many relevant features get a chance. This second problem of high dimensionality is also resolved in RPFP, since all the features are used in the nal prediction phase.
3.3.7 Context-sensitive Learning RPFP is an adaptive or context-sensitive method in the sense that in di�erent locations of the instance space the contribution of the features are di�erent. This property is achieved by two characteristics of RPFP. One of them is the partitioning algorithm. The region formed around the query instance is determined adaptively; di�erent features have di�erent lengths of edges in the nal region according to the location of query. The other one is in the local weights. Features may take di�erent local weights according to the location of the query. On the other hand, the local weights of features will be di�erent since di�erent instances will be the neighbors at di�erent feature dimensions. The di�erence in the neighbors will reduce possible over- tting, similar to sampling approaches such as boosting [10], which brings an advantage to RPFP. Nearly all eager approaches, in some extent, are context-sensitive, while it is one of the limitations of KNN [15].
CHAPTER 3. REGRESSION BY PARTITIONING FEATURE PROJECTIONS
60
3.3.8 Missing Feature Values It is likely that some feature values may be unknown in the application domain. In relational databases, the most suitable form of databases for the most current learning techniques, the problem occurs frequently because all the records of a table must have the same elds, even if values are inexistent for most records [38]. For example, in a hospital database including many elds for many laboratory tests and medical procedures, only a few of these elds will be lled in for any patient. Even the importance of handling missing values is accepted in literature, the distortion on the information contained in the data caused by missing values is not exactly prevented in many learning techniques [46, 47, 48]. The most common way to handle missing values is to ll those places with some approximations or some constant values. If missing values are very frequent on some rows or columns, removing these instances or features can also be considered. The most natural solution for handling missing values is leaving those places empty and not to distort the information in the data. Additive models or feature projection based methods handle missing values in that way, since each feature is evaluated separately. However, their limitation is that they assume all features to have independent e�ects on the target. RPFP deals with missing values similar to additive or previous feature projection based models, and also resolve the interactions between features by applying a partitioning process. RPFP achieves this by applying approximations on feature projections using only known values, and in partitioning, for a selected feature dimension along with the partitioning occurs, by keeping missing valued instances of that feature.
CHAPTER 3. REGRESSION BY PARTITIONING FEATURE PROJECTIONS
61
3.3.9 Interactions If some input features have inter-relationship such that the e�ect of any feature on the target is dependent on one or more di�erent input features, those relations are called as interactions. RPFP produces a local region for each query. Making predictions on those regions enable it to handle interactions and to achieve better accuracy. On the other hand, some research on the classi cation methods and real data sets show that, generally the main e�ects of the features are su�cient to determine the target values [24, 31]. If some features have only main e�ects on targets, RPFP makes predictions for those features by using the whole instance space instead of local region determined by partitioning, since large number of training instances allow better approximations. Another limitation of some partitioning methods, such as regression tree induction is that the partitioning always occurs with many variables and this causes handling of only high-order interactions. This problem makes it di�cult to approximate even some simple forms such as linear functions [19]. Dealing with interactions is an important property for regression methods in order to achieve better accuracies. To illustrate it with a simple example, we can consider predicting the area of a rectangle. Both width and length of a rectangle must be evaluated together since predicting the area by using only one of them is not su�cient.
3.3.10 Feature Projection Based Learning RPFP is a feature projection based learning approach. The results reported for feature projection based classi cation methods, CFP [24], KNNFPR [5], COFI [25], FIL [6, 27] and VFI [26], and feature projection based regression method RFP [54] motivated us to develop RPFP. The major distinction between those methods and RPFP is its capability of dealing with interactions. RPFP inherits most advantages of feature projection based approaches (handling missing values, robustness to irrelevant features etc.), on the other
CHAPTER 3. REGRESSION BY PARTITIONING FEATURE PROJECTIONS
62
hand bene ts from the advantages of nearest neighbor (nearest instances at any dimension have larger e�ects on solution when compared to others) and partitioning methods (dealing with interactions, adaptivity and regions with
exible edges are formed by partitioning).
3.3.11 Di�erent Feature Types Induction methods generally accepts two feature types. One of them is nominal features, which take binary or categorical values, the other one is continuous features which take numeric or real values. Induction methods either can handle both type of features, or use only on type. If the later is the case, some transformation methods are applied. If a method accepts only continuous features, each nominal value of a feature is replaced with a unique numerical value. On the other hand, if a method use only nominal features, the continuous features are transferred to discrete values generally by employing a clustering procedure. In that case, the range of all possible values of a feature is partitioned into intervals and all the values in each interval is replaced with a unique nominal value. Such procedures may be time consuming, and may cause some information loss. For such reasons, RPFP is developed in order to handle both type of features without any modi cation.
3.3.12 Noise Instance based algorithms are generally robust to extreme or noisy input feature values since query locations will not be close to these values [40]. On the other hand, most regression approaches, including KNN, are not robust to target noise. The empirical results show that robustness to noise in RPFP is better than some other well known methods. Even though, the robustness of RPFP is better when compared to others, it is unacceptable especially for extremely noisy domains. A measure of robustness is called the breakdown point, which is de ned to be the smallest percentage of noisy data that can lead prediction to take
CHAPTER 3. REGRESSION BY PARTITIONING FEATURE PROJECTIONS
63
unacceptable large value. The RPFP-N algorithm developed for noisy data, achieves close to the highest possible breakdown value of 50%, since it employs median for approximation on feature projections. On the other hand, in comparison, for classical linear least squares regression method, the breakdown point is only 0%.
3.3.13 Normalization Learning approaches, such as KNN, that employ distance measures require the normalization of feature values in order to give all features equal contribution in the computation of distance. The wider the range of values for a feature, the higher e�ect it has in the distance computation. For example, without normalization, a feature which includes values for body weight will cause different nearest neighbors to be determined if it is measured with pound instead of kilogram. On the other hand the weight feature will not e�ect the computation of distance if there exists an other feature, say population, having values that ranges with millions. RPFP eliminates the need for normalization, since approximations are done on each feature separately.
3.4 Limitations of RPFP RPFP has two main limitations. The e�ect of redundant features is a common problem for most inductive algorithms, and lack of interpretation is the common shortcoming of instance-based approaches, which are described below. The limitation caused by rectangular regions, common to most learning approaches, is also mentioned.
3.4.1 Redundant Features In a database, it is possible that the same information may be repeated in di�erent places. Existence of features that have functional dependencies with each other is such a case. A similar case occurs if some features in the data
CHAPTER 3. REGRESSION BY PARTITIONING FEATURE PROJECTIONS
64
are obtained by combining some others. This issue is known in statistical literature as collinearity, if such a relation occurs between two features, or as multicollinearity, if more than two features have similar relationship. The e�ect of redundant features in RPFP is seen on the nal prediction phase when merging feature approximations. Redundancy will cause similar features to e�ect the nal prediction more than the other features. Intuitively, if one feature is a copy of another for example, the weight of that information will be duplicated in the nal result.
3.4.2 Interpretation The inerpretability of the constructed model is an important aspect of eager learning algorithms. The conventional motivation of statistical data analysis is to develop simple compact models that are easy to interpret by human experts. However, the accuracy is the main goal in many applications. That is why recent research has resulted in many complex models, hard to interpret, such as neural networks. KNN is also a common lazy approach that does not produce any model for interpretation. RPFP, as a non-parametric lazy approach which does not construct global models, does not have this property either. However, instead of concept descriptions, some information about the relative importance of the features and interactions between them can be determined with further research.
3.4.3 Rectangular Regions The partitioning algorithm employed in RPFP partitions the instance space around query point by using a single feature at each step, and the space is partitioned along this feature dimension. This process forms regions as hyperrectangles. It is not always possible that the instances at any query location will have a rectangular shape parallel to feature dimensions. However, this is the way most partitioning approaches work, and it is generally possible to make good local approximations using instances enclosed by hyper-rectangles.
CHAPTER 3. REGRESSION BY PARTITIONING FEATURE PROJECTIONS
65
3.5 Complexity Analysis Since RPFP is a lazy approach, and stores all instances in the memory, a space proportional to the whole training data is required. Given a data set with n instances and m features this space is proportional to m:n. Again, for the training phase, the computational complexity of projecting instances to input features, followed by a sort operation on each feature, is O(m:n: log n). The computation of variance, O(n), of target values for all training data is also computed in the training phase, and it does not change the above complexity. Computing the prediction of the target value for a query point starts with making a copy of the projections, which has a complexity of O(n). The computation complexity of local approximation in the rst step of partitioning is again O(n). The complexity of computing local weight is also O(n), which is also the total computation complexity at rst partitioning step. The partitioning at each step removes, on the average, half of the instances. For the whole partitioning process the total computation for a single feature will be proportional to 2n since n + n=2+ n=4+ : : : � 2n. If we compute the complexity for all features we obtain a complexity proportional to O(m:n), which is equal to the complexity of KNN. If we consider situations for nominal features, this complexity is even slightly shorter than linear features. In the worst case, where a nominal feature has two values (only half of the data is removed), it requires on the average the same complexity. The test times of the algorithms, run on the real data sets also shows that the running test time of RPFP is proportional to KNN.
3.6 Comparisons of Regression Methods In the previous sections we have described some properties and limitations of RPFP, and made some comparisons with other important approaches in the literature. In this section we summarize such properties and comparisons with di�erent important approaches. Methods included are instance-based regression (KNN [40]), locally weighted regression (LOESS [7]), rule-based regression
CHAPTER 3. REGRESSION BY PARTITIONING FEATURE PROJECTIONS
66
(RULE [59]), projection pursuit regression (PPR [20]), partitioning algorithms that induces decision trees (CART [9],DART ( [23]) and multivariate adaptive regression splines (MARS [19]). The summary of properties is shown in Table 3.1. One interesting result obtained from the table shows that all partitioning methods (RULE, CART, DART, MARS) except RPFP have similar properties. A detailed overview and comparison of these regression techniques is given in [53]. Properties RPFP KNN LOESS PPR RULE CART DART MARS p p p p p p Adaptive p p p p p p Continuous Between Regions p p p p p p Di�erent Feature Types p p Curse of Dimensionality p p p Incremental p p p p p p p p Handle Interactions p p p p p Interpretable p p p p p Handle Irrel. Features p p p p p p p Local p p p p p Memory Cost p Handle Missing Values Robust to RPFP-N Noise p p p p p No Need for Normalization p p p p p p Regions Overlap p p p p p Partitioning Occurs p p p p p Testing Cost p p p Train Cost
Table 3.1. Properties of Regression Algorithms. The (p) is used for cases if the corresponding algorithm handles a problem or it is advantageous in a property when compared to others.
Chapter 4 Empirical Evaluations In this chapter empirical evaluation of RPFP and other important regression methods are presented. Even though, the main purpose is to measure the relative performance of RPFP and to compare it with contemporary regression algorithms, another intension is to present a comparison of those methods on a large number of real domains since it is di�cult to nd such comparative evaluations in the literature. The algorithms are properly selected according to some criteria. All of them can handle high dimensional domains and accept both categorical and continuous input features. We did not include LOESS for example, since it does not work with higher dimensions, for more than 6 features. On the other hand, they are successful representatives of di�erent approaches, such as regression tree induction, instance-based learning and rule-based learning. Most of them are recently developed and outperform early developed algorithms within the same approach. Finally, all of them are obtained from shared resources or available in published material. Those algorithms are KNN (instance-based), the most important one since it belongs to the same category as RPFP, RULE (rule-based learning), DART (regression tree induction), and MARS (spline-based, partitioning regression). In this chapter, we describe the evaluation methodology commonly used to measure accuracy of regression methods. Later, algorithms and real data 67
CHAPTER 4. EMPIRICAL EVALUATIONS
68
sets are described and empirical results are presented, including the accuracy performance, robustness of algorithms to irrelevant features, missing values and noise, and computation times.
4.1 Performance Measure The accuracy performance of the regression methods is measured by computing the prediction error of the algorithms. Since the target values are continuous, the absolute di�erence between prediction and true target value in the test example is used. One common measure is the mean absolute distance (MAD) [59, 60]. It is the mean of absolute error found for all test examples. PT jy ? ^y j i i=1 i
MAD = T where T is the number of test instances.
(4.1)
MAD values depend on the target values in the given domain. MAD will be higher for a domain with high target values than for a domain with low target values. In order to get a normalized performance measure for all data sets, a modi ed version of MAD, relative error (RE) [59, 60] is used in the experiments. Relative error is the true mean absolute distance normalized by the mean absolute distance from the median.
RE = PT MAD T i jyi ? median(y )j 1
=1
(4.2)
Performance results in the experiments are reported as the average of relative errors measured by applying 10-fold cross-validation on data sets.
4.2 Algorithms Used in Comparisons In this section the properties of algorithms used in experiments are brie y described.
CHAPTER 4. EMPIRICAL EVALUATIONS
69
4.2.1 RPFP K is the parameter of RPFP that de nes the minimum number of instances allowed for a region determined by the partitioning algorithm; and is set to 10. An other parameter is the windowing constant, cw , that is described in Section 3.1.4, and it is taken as 0:3. RPFP-N algorithm is also used for arti cial noisy domains extracted from real data sets, to measure robustness to noise.
4.2.2 KNN The distance weighted KNN algorithm [40] is used here since it performs better than simple KNN that employs simple averaging. The instances close to the query have larger weights, and these weights are determined by inverse squared distance. The distance measure is Euclidean distance. A normalization on test and train input feature values is applied in order to obtain a value range between 0 and 1. For matching nominal values, the di�erence is measured as 0, and for the di�erence between di�erent nominal values on a single dimension 1 is assigned. Missing values are lled with mean values of the feature if it is continuous, or lled with the most frequent categorical value, if that feature is nominal. K is set to 10 for all experiments.
4.2.3 RULE The latest rule-based regression implementation, written by Weiss and Indurkhya [59, 60] is used in experiments. The program is available in the data mining software kit (DMSK), attached to [60].
4.2.4 DART It is the latest regression tree induction program developed by Friedman [23]. It avoids limitations of disjoint partitioning, used for other tree-based regression
CHAPTER 4. EMPIRICAL EVALUATIONS
70
methods, by producing overlapping regions with increased training cost. In the experiments, the maximum dimension (features) parameter, is increased from 100 to 200, in order to enable experiments for irrelevant features.
4.2.5 MARS The latest shared version of MARS, mars3.6, is used in experiments, which is developed by Friedman [19]. The highest possible interaction level is enabled and linear spline approximation is set, it generally produces better results than cubic splines on most real data sets.
4.3 Real Data Sets It is possible to obtain large number of real world data sets for classi cation, however this is not easy for regression. That is why, data sets used in the experiments are collected mainly from three sources [37, 8, 51]. Properties of all data sets are shown in Table 4.1. Detailed information about these data set is available in Bilkent Function Approximation Repository [28]. In order to save space, they are coded with two letters (e.g., AB for Abalone).
4.4 Accuracy The relative errors of algorithms on 27 real data sets are shown in Table 4.2. The best results, smallest relative errors, are typed in boldface. RPFP achieves best results in 9 of these data sets. DART and MARS achieves the best in 7 and 6 of these data sets, respectively. In the remaining 6 data sets KNN and RULE achieves better accuracy. One important result extracted from Table 4.2 is the distribution of relative errors for di�erent data sets. We have computed the variance of errors for each algorithm on all data sets. These variance values show that the performance of RPFP is not e�ected much for di�erent domains. This is an important
CHAPTER 4. EMPIRICAL EVALUATIONS
Data Set
71
Code Instances Features Missing Target (C+N) values Feature Abalone AB 4177 8 (7+1) None Rings Airport AI 135 4 (4+0) None Tons of mail Auto AU 398 7 (6+1) 6 Gas consumption Baseball BA 337 16 (16+0) None Salary Buying BU 100 39 (39+0) 27 Husbands buy video College CL 236 20 (20+0) 381 Competitiveness Country CO 122 20 (20+0) 34 Population Cpu CP 209 7 (1+6) None CPU performance Electric EL 240 12 (10+2) 58 Serum 58 Fat FA 252 17 (17+0) None Body height Fishcatch FI 164 7 (6+1) 87 Fish weight Flare2 FL 1066 10 (0+10) None Flare production Fruit y FR 125 4 (3+1) None Sleep time Gss2 GS 1500 43 (43+0) 2918 Income in 1991 Homerun HO 163 19 (19+0) None Run race score Housing HU 506 13 (12+1) None House prices Normtemp NO 130 2 (2+0) None Heart rate Northridge NR 2929 10 (10+0) None Earthquake magnit. Plastic PL 1650 2 (2+0) None Pressure Poverty PO 97 6 (5+1) 6 Death rate Read RE 681 25 (24+1) 1097 Reader satisfaction Schools SC 62 19 (19+0) 1 Reading score Servo SE 167 4 (4+0) None Rise time of a servo Stock ST 950 9 (9+0) None Stock price Television TE 40 4 (4+0) None People per TV Usnews UN 1269 31 (31+0) 7624 Rate of Ph.D.'s Village VL 766 32 (29+3) 3986 Number of Sheep Table 4.1. Characteristics of the data sets used in the empirical evaluations. C: Continuous, N: Nominal.
CHAPTER 4. EMPIRICAL EVALUATIONS
72
result that shows the domain independence characteristic of RPFP, which is important for large databases today, where data that belong to large number of domains is collected together. Increasing number of di�erent domains in databases is one of the reasons that increase the need for automatic knowledge discovery tools and inductive learning algorithms. On the other hand, when the average relative errors of algorithms on real data sets are compared, RPFP again achieves the smallest average relative error. Also the variance of RE is the smallest. The nal column of Table 4.2 shows the standard deviation of results of algorithms for all data sets. The standard deviation values are used only to determine small number of data sets to be used for further comparisons of algorithms for noise, irrelevant features and missing values. We have determined a subset of data sets that have similar results for the comparison of algorithms for increasing missing values, irrelevant features and noise. Selected data sets with standard deviation less than 0:07 are typed in last column with bold font. Only in one of these selected data sets RPFP performs best, by chance.
4.5 Robustness to Irrelevant Features The performance of algorithms on selected data sets (AU, BU, CP, HU, PL and SC) by adding new irrelevant features are shown in Figure 4.1. From graphs it is seen that, the performance of RPFP is not e�ected from irrelevant features in all data sets except PL, by preserving nearly a straight line parallel to the horizontal axis. RULE and MARS are also robust to irrelevant features. It is a�ected from irrelevant features in PL probably because it is a low dimensional data set, initially having only two input features. Note that, in only one of these data sets (BU), RPFP performs best initially. Most advantages of RPFP are generally bene ted for high dimensions. These graphs show that RPFP is not a�ected much from irrelevant features. This is the major drawback of KNN, the other lazy algorithm in these comparisons, and this is apparent in the graphs. Robustness of RPFP to irrelevant features is achieved by the local weights assigned to each feature and by
CHAPTER 4. EMPIRICAL EVALUATIONS
Data Set RPFP KNN RULE AB 0.675 0.661 0.899 AI 0.473 0.612 0.744 AU 0.334 0.321 0.451 BA 0.664 0.441 0.668 BU 0.792 0.951 0.944 CL 0.692 0.764 0.290 CO 1.301 1.642 6.307 CP 0.650 0.603 0.678 EL 1.009 1.194 1.528 FA 0.667 0.785 0.820 FI 0.243 0.582 0.258 FL 1.218 2.307 1.792 FR 1.056 1.201 1.558 GS 0.566 0.654 0.218 HO 0.868 0.907 0.890 HU 0.618 0.600 0.641 NO 0.962 1.232 1.250 NR 0.947 1.034 1.217 PL 0.415 0.475 0.477 PO 0.703 0.796 0.916 RE 1.008 1.062 1.352 SC 0.319 0.388 0.341 SE 0.527 0.619 0.229 ST 0.729 0.599 0.906 TE 1.659 1.895 4.195 UN 0.666 0.480 0.550 VL 0.970 1.017 1.267 Mean 0.768 0.882 1.162 Variance 0.102 0.220 1.659 Table 4.2. Relative Errors of Algorithms. font.
73
DART 0.683 0.720 0.333 0.497 0.883 1.854 5.110 0.571 1.066
0.305 0.190 1.556 1.012 0.359
0.769
MARS StdDev 0.678 0.101 0.546 0.115
0.321 0.056 0.525 0.858
0.261
0.102
0.066
1.845
0.646 2.300
1.095 0.638 0.284 1.695 1.077 0.342 0.986
0.207 0.204 0.155 0.397 0.222 0.177 0.078
0.510 0.066
0.522 0.054 1.112 0.128 0.873 0.134 0.404 0.432 0.034 1.251 0.677 0.233 0.526 1.012 0.928 1.045
1.194 0.142 0.223 0.350 0.062 0.441 0.337 0.153 0.781 0.754 0.110 7.203 2.690 2.281 0.412 0.444 0.101 1.138 1.131 0.116 1.158 0.821 2.323 0.310 Best results are typed with bold
CHAPTER 4. EMPIRICAL EVALUATIONS
74
1
0.6
RE
RE
0.8
DART KNN MARS RPFP RULE
0.4 0.2
1.6 1.4 1.2 1 0.8 0.6 0.4 0.2 0
0 10 20 30 40 50 60 70 80 90 100 AU (Number of Irrelevant Features)
0.8
0.4
DART KNN MARS RPFP RULE
0
0 10 20 30 40 50 60 70 80 90 100 CP (Number of Irrelevant Features)
0 10 20 30 40 50 60 70 80 90 100 HU (Number of Irrelevant Features)
1 0.8
0.6
0.6
0
DART KNN MARS RPFP RULE
0.2
RE
RE
0.6
0.8
0.2
0 10 20 30 40 50 60 70 80 90 100 BU (Number of Irrelevant Features)
1
1
0.4
DART KNN MARS RPFP RULE
1.2
RE
RE
0
1.6 1.4 1.2 1 0.8 0.6 0.4 0.2 0
DART KNN MARS RPFP RULE
0 10 20 30 40 50 60 70 80 90 100 PL (Number of Irrelevant Features)
DART KNN MARS RPFP RULE
0.4 0.2 0
0 10 20 30 40 50 60 70 80 90 100 SC (Number of Irrelevant Features)
Figure 4.1. Relative errors of algorithms with increasing irrelevant features.
CHAPTER 4. EMPIRICAL EVALUATIONS
75
making computations on each feature separately. A comparison of algorithms on all data sets where 30 irrelevant features are added to each of them is shown in Table 4.3. RPFP and MARS outperform other algorithms for the robustness to irrelevant features according to this table.
4.6 Robustness to Missing Values With current relational databases, the issue of missing values is a common problem for most domains. RPFP handles missing values naturally by simply ignoring them, and using all other values available. A comparison of RPFP with other algorithms for increasing missing values on selected data sets is shown in Figure 4.2. As the values are removed from the data, information loss and performance degradation become obvious. However, the decrease in performance is smaller in RPFP than other algorithms, where the missing values are lled with means or most frequent nominal value. The error rate of RPFP becomes relatively minimal in all selected data sets, when proportion of missing values reaches 90%, except for low dimensional PL data set. According to these results, DART also performs well in robustness to missing values. A comparison of algorithms on all data sets, where 20% of the values of real data sets are removed, is shown in Table 4.4. According to these results RPFP outperforms other algorithms in terms of robustness to missing values.
4.7 Robustness to Noise It is apparent from the graphs in Figure 4.3 that RPFP-N outperforms other algorithms for most of the selected data sets. An interesting result is that RPFP also achieves better than other algorithms in most data sets. However, all algorithms except RPFP-N reaches unacceptable error rates with a small increase in the ratio of noise.
CHAPTER 4. EMPIRICAL EVALUATIONS
76
Data Set RPFP KNN RULE DART MARS AB 0.704 0.906 0.899 * 0.682 AI 0.500 1.539 0.744 0.658 0.682 AU 0.351 0.618 0.451 0.511 0.369 BA 0.670 0.723 0.668 0.641 0.573 BU 0.802 1.005 0.944 0.938 1.049 CL 0.716 1.320 0.290 0.306 2.195 CO 1.330 3.027 6.307 1.662 4.126 CP 0.753 1.214 0.678 0.668 0.590 EL 1.018 1.076 1.528 1.236 1.134 FA 0.698 1.058 0.820 0.877 0.249 FI 0.295 0.985 0.258 0.350 0.208 FL 1.038 1.537 1.792 1.490 1.629 FR 0.959 1.075 1.558 1.430 1.777 GS 0.568 0.893 0.218 0.573 0.404 HO 0.876 0.974 0.890 1.165 0.847 HU 0.642 0.963 0.641 0.653 0.521 NO 1.024 1.071 1.250 1.157 1.370 NR 0.979 1.149 1.217 * 0.916 PL 0.674 0.952 0.477 0.734 0.407 PO 0.775 0.934 0.916 1.013 1.005 RE 1.033 1.060 1.352 1.311 1.042 SC 0.362 0.673 0.341 0.391 0.305 SE 0.589 1.021 0.229 0.650 0.798 ST 0.782 1.151 0.906 0.756 0.818 TE 1.617 2.455 4.195 2.709 5.614 UN 0.671 0.856 0.550 0.906 0.394 VL 0.972 1.111 1.267 1.307 1.257 Mean 0.793 1.161 1.162 0.964 1.147 Variance 0.084 0.258 1.659 0.271 1.429 Table 4.3. Relative errors of algorithms, where 30 irrelevant features are added to real data sets. If the result is not available due to singular variance/covariance matrix, it is shown with (*). Best results are typed with bold font.
CHAPTER 4. EMPIRICAL EVALUATIONS
77
1
1.4 1.2 1
0.6
RE
RE
0.8
0.4
DART KNN MARS RPFP RULE
0.2
2 1.8 1.6 1.4 1.2 1 0.8 0.6 0.4 0.2 0
0
0 10 20 30 40 50 60 70 80 90 AU (Missing Values %)
DART KNN MARS RPFP RULE
1 0.8 0.6
DART KNN MARS RPFP RULE
0.4 0.2 0
0 10 20 30 40 50 60 70 80 90 CP (Missing Values %)
0 10 20 30 40 50 60 70 80 90 HU (Missing Values %)
1 DART KNN MARS RPFP RULE
0.6 0.4 0.2 0
0 10 20 30 40 50 60 70 80 90 BU (Missing Values %)
1.2
0.8 RE
RE
1 0.8
DART KNN MARS RPFP RULE
1.4
1.4 1.2
0.6 0.4 0.2
RE
RE
0
0.8
0.6
DART KNN MARS RPFP RULE
0.4 0.2
0 10 20 30 40 50 60 70 80 90 PL (Missing Values %)
0
0 10 20 30 40 50 60 70 80 90 SC (Missing Values %)
Figure 4.2. Relative errors of algorithms with increasing missing values.
CHAPTER 4. EMPIRICAL EVALUATIONS
78
Data Set RPFP KNN RULE DART MARS AB 0.739 0.750 0.962 0.688 0.748 AI 0.532 0.726 0.676 0.546 0.798 AU 0.393 0.414 0.526 0.363 0.414 BA 0.817 0.560 0.783 0.565 0.709 BU 0.881 0.964 0.989 0.983 0.877 CL 0.796 0.942 0.400 0.435 0.801 CO 1.439 1.856 3.698 2.377 3.733 CP 0.584 0.652 0.843 0.607 0.880 EL 1.029 1.097 1.537 1.191 1.074 FA 0.767 0.849 0.949 0.735 0.731 FI 0.273 0.584 0.336 0.320 0.348 FL 1.377 1.851 1.751 1.421 1.557 FR 1.033 1.711 1.557 1.347 1.012 GS 0.702 0.743 0.497 0.536 0.595 HO 0.889 0.911 1.040 0.974 0.836 HU 0.687 0.761 0.748 0.590 0.649 NO 0.986 1.229 1.363 1.222 0.989 NR 0.940 1.072 1.272 * 0.972 PL 0.668 0.733 0.686 0.420 0.679 PO 0.682 0.976 1.189 0.792 1.026 RE 1.007 1.059 1.364 1.229 1.048 SC 0.327 0.449 0.500 0.370 0.303 SE 0.938 0.921 0.849 0.495 0.733 ST 0.777 0.744 0.904 0.707 0.930 TE 1.810 4.398 3.645 2.512 16.503 UN 0.669 0.559 0.620 0.844 0.497 VL 1.014 1.056 1.410 * 1.090 Mean 0.843 1.058 1.152 0.891 1.501 Variance 0.110 0.587 0.670 0.323 9.372 Table 4.4. Relative errors of algorithms, where 20% of values of real data sets are removed. If the result is not available due to singular variance/covariance matrix, it is shown with (*). Best results are typed with bold font.
CHAPTER 4. EMPIRICAL EVALUATIONS
79
RPFP is generally more robust when compared to other methods even it produces complex models, that may cause large variance error which is sensitive to noise. The reason for that may be the decrease in variance error since the feature predictions are computed with di�erent neighbors in each feature dimension. This probably makes bootsrapping e�ect on prediction. Bootstrapping is a common method to decrease variance error by using multiple overlapping subsets of the same data instead of a single training set.
4.8 Interactions RPFP handles interactions in a similar way as the other eager partitioning approaches work, that is by partitioning the instance space. The best way to show how partitioning in RPFP handles interactions and generally increase accuracy for data sets having interactions is to compare it with its additive version. All other algorithms compared in the previous chapters have this property. The following experiments show that RPFP also has this property as other eager partitioning algorithms. The additive version of RPFP is obtained by excluding the partitioning from RPFP algorithm and simply by combining the feature predictions and obtaining the nal prediction after the rst step. We denoted the additive version as RPFP-A. The rst experiment is done with a simple arti cial data set having two interacting features and 100 instances formed as shown in Figure 4.4. Here x1 and x2 are the input features and y is the target. The feature x1 takes binary values while x2 and y take continuous values from 0 to 50. The relative error of RPFP on this data set is 0.31, which is much smaller than that of RPFP-A, whose relative error is 1.35. Another experiment is conducted on real data sets, and the results are shown in Table 4.5. The results show that RPFP signi cantly outperforms RPFP-A, which indicate the ability of RPFP in handling interactions.
CHAPTER 4. EMPIRICAL EVALUATIONS
80
6
30
5
DART KNN MARS RPFP RPFP−N RULE
3
20 RE
RE
4
DART KNN MARS RPFP RPFP−N RULE
2
10
1 0
0
10
20 30 AU (Noise %)
40
0
50
1.2
0
6 0.6
RE
RE
40
50
20 30 HU (Noise %)
40
50
20 30 SC (Noise %)
40
50
DART KNN MARS RPFP RPFP−N RULE
0.8 DART KNN MARS RPFP RPFP−N RULE
0.4 0.2 0
10
20 30 CP (Noise %)
40
4 2 0
50
12
0
10
1.6 DART KNN MARS RPFP RPFP−N RULE
10
DART KNN MARS RPFP RPFP−N RULE
1.2 RE
8 RE
20 30 BU (Noise %)
8
1
0
10
6
0.8
4 0.4 2 0
0
10
20 30 PL (Noise %)
40
50
0
0
10
Figure 4.3. Relative errors of algorithms with increasing target noise.
CHAPTER 4. EMPIRICAL EVALUATIONS
81
50
40
x1=1
y
30
20
x1=0
10
0
0
10
20
30
40
50
x2
Figure 4.4. Arti cial data set. x1 and x2 are input features.
D RPFP RPFP-A D RPFP RPFP-A D RPFP RPFP-A AB 0.675 0.815 FA 0.667 0.855 PL 0.415 0.819 AI 0.473 0.500 FI 0.243 0.334 PO 0.703 0.783 AU 0.334 0.430 FL 1.218 1.487 RE 1.008 1.000 BA 0.664 0.752 FR 1.056 1.041 SC 0.319 0.337 BU 0.792 0.896 GS 0.566 0.667 SE 0.527 0.944 CL 0.692 0.773 HO 0.868 0.939 ST 0.729 0.992 CO 1.301 1.354 HU 0.618 0.710 TE 1.659 1.629 CP 0.650 0.738 NO 0.962 0.958 UN 0.666 0.718 EL 1.009 1.019 NR 0.947 0.956 VL 0.970 0.988 Table 4.5. Comparison of RPFP with its additive version RPFP-A. Best results are typed with bold font.
CHAPTER 4. EMPIRICAL EVALUATIONS
82
4.9 Computation Times Since the computation times of lazy and eager approaches di�er signi cantly for training and prediction phases, training times of eager approaches and prediction or test times of lazy approaches are given in Table 4.6. Generally test times of eager approaches and training times of lazy approaches are close to zero. The time durations are measured on a Pentium450 personal computer running Linux operating system. The results justify the theoretical considerations in determining the computational complexity of RPFP such that it is proportional to the linear prediction complexity of KNN. On the average, prediction time of RPFP is 2.5 times higher than of KNN. This is more apparent for largest datasets (AB, GS, NR). In general computation performances of algorithms di�er for di�erent datasets.
CHAPTER 4. EMPIRICAL EVALUATIONS
Data Set
83
RPFP KNN RULE DART MARS RPFP/KNNR Test Test Train Train Train Ratio AB 40081.2 17217.1 6593.3 458503.0 7629.1 2.3 AI 7.5 3.0 248.4 57.8 153.5 2.5 AU 124.1 41.8 407.4 1772.2 573.9 3.0 BA 261.9 50.1 429.8 3022.1 912.4 5.2 BU 51.6 49.2 284.9 667.7 738.6 1.0 CL 150.9 35.6 464.0 708.6 1039.9 4.2 CO 32.0 31.7 396.5 459.4 484.8 1.0 CP 30.6 161.0 251.4 263.6 361.0 0.2 EL 141.1 19.5 389.1 933.2 385.6 7.2 FA 167.0 30.3 403.9 1654.4 755.8 5.5 FI 18.1 161.3 278.5 200.5 226.7 0.1 FL 1198.8 775.9 408.7 901.4 543.8 1.5 FR 9.0 44.0 234.5 42.8 99.9 0.2 GS 14241.0 6435.2 1236.6 23845.8 8797.0 2.2 HO 92.8 140.7 266.3 835.8 616.2 0.7 HU 449.2 98.9 594.4 7576.7 1186.2 4.5 NO 6.0 1.7 236.8 18.0 68.1 3.5 NR 24027.0 9346.7 7006.4 81984.0 4207.3 2.6 PL 1536.4 1415.5 503.3 9343.1 670.7 1.1 PO 6.1 2.0 250.3 41.1 121.6 3.1 RE 2717.0 674.6 625.2 35541.5 2260.1 4.0 SC 7.5 2.0 251.2 78.2 283.8 3.8 SE 6.9 4.0 221.6 78.2 109.0 1.7 ST 1173.8 759.8 845.6 16203.2 1839.2 1.5 TE 0.1 0.0 235.4 3.1 25.5 * UN 6459.7 3858.9 4834.2 153959.0 7287.0 1.7 VL 2113.9 1229.5 1101.0 107661.0 3082.9 1.7 Mean 2.5 Table 4.6. Time durations of algorithms for real data sets in milliseconds.
Chapter 5 Conclusion and Future Work In this thesis we have presented a new regression method called RPFP. It is an instance-based, non-parametric, nonlinear, context-sensitive, and local supervised learning method based on feature projections. It achieves higher accuracy results especially when compared to the most common lazy approach, KNN. Its performance is also signi cant when compared to important eager approaches of both machine learning and statistics. The main drawback of RPFP is the lack of interpretation and its high prediction time requirement, as other lazy approaches. Even though, RPFP is a lazy method, it eliminates most drawbacks of other lazy methods. The most important one is that it is robust to irrelevant features. The local weight associated with each feature enables this property. Besides, it is context-sensitive that is contribution of features are computed separately in di�erent regions of the instance space. Some features may be important only some regions of the instance space. RPFP also properly handles most problems belonging to all types of learners, eager or lazy. Those are curse of dimensionality, missing feature values, and noise, handled by a modi cation on RPFP algorithm. These are important and common problems especially with large databases today. RPFP outperforms all other important methods used in comparisons on domains having large number of missing values or noise. 84
CHAPTER 5. CONCLUSION AND FUTURE WORK
85
The advantages and limitations of RPFP is described in the previous chapter. Future work can be directed to overcome these limitations and to incorporate new properties to RPFP. Possible improvements are described in the following paragraphs. Redundant Features: If there are functional dependencies between some features, or some of the features give the same information, they can be factorized to a single feature, or some of them can be removed from the training set. Interpretation: Lack of interpretation of the underlying data is a common drawback of all lazy approaches. However further research can be directed for RPFP in order to determine relative importance of features by using the local weights of features determined for each query instance. Similar work can be done in order to determine interactions between features, by using the changes in the local weights of features at each partitioning step. Incorporating Domain Knowledge: The main motivation to develop machine learning algorithms or knowledge discovery tools is to extract knowledge without an expert, since number of domains in the databases is large. However for stand-alone applications, where the data belongs to a single domain, and where a domain knowledge is available, incorporating domain knowledge to these automatic tools, including RPFP, may increase the accuracy signi cantly. Misclassi cation Cost: Incorporating misclassi cation costs to classi cation algorithms is a current research topic. Misdiagnosing a patient as healthy is much important fault than vise versa. Given a misclassi cation function for continuous target values, similar research can be directed for regression algorithms, including RPFP. Feature Weighting and Selection: RPFP employs an implicit local weight for each feature at each step of RPFP algorithm. Incorporating feature weights computed by external weighting algorithms is not researched as well as feature selection algorithms. Classi cation Tasks: Some authors describe classi cation as a sub-category of regression. By associating a feature having binary values for each class value of a categorical target, the performance of RPFP for classi cation tasks can
CHAPTER 5. CONCLUSION AND FUTURE WORK
86
be evaluated. Bootstrapping: Bootstrapping is a sampling method used to increase the performance of learning algorithms by decreasing the variance error. However for lazy approaches, where variance error is small when compared to bias error, this method does not work and they are called stable because of this property. The same thing may not occur for RPFP since it an adaptive partitioning method, and whether boosting increase its performance can be researched.
As a nal word, instance-based regression by partitioning feature projections is a successful technique in regression. RPFP method can compete with the most famous and successful methods of both machine learning and statistical literature. Some important properties of RPFP that are missing in many important other methods such as handling missing values naturally, robustness, and domain independence enable it to become an important tool for knowledge discovery and data mining systems.
Bibliography [1] Adeli, H., Knowledge Engineering Vol.1, McGraw Hill, 1990. [2] Aha, D., Kibler, D., and Albert, M., Instance-based Learning Algorithms, Machine Learning, 6, 37-66, 1991. [3] Aha, D., Special Issue on Lazy Learning, Arti cial Intelligence Review, Vol.11, No.1-5, 1997. [4] Aha D. W., Salzberg, S. L., Learning to Catch: Applying Nearest Neighbor Algorithms to Dynamic Control Tasks, Selecting Models from Data: Arti cial Intelligence and Statistics IV., New York, NY: Springer-Verlag, 1994. [5] Akku�s, A. and Guvenir,H. A., k Nearest Neighbor Classi cation on Feature Projections, In Proceedings of the 13th International Conference on Machine Learning. Lorenza Saitta (Ed.), Bari, Italy: Morgan Kaufmann, 12{19, 1996. [6] Akku�s. A., Batch Learning of Disjoint Feature Intervals. Bilkent University, Dept. of Computer Engineering and Information Science, MSc. Thesis, 1996. [7] Atkenson, G. C., Moore, A. W., Schaal, S., Locally Weighted Learning, Arti cial Intelligence Review, Vol.11, No.1/5, 11-73, February 1997. [8] Blake, C., Keogh, E. and Merz, C. J., UCI Repository of Machine Learning Databases, [http://www.ics.uci.edu/mlearn/MLRepository.html], Irvine, CA: University of California, Department of Information and Computer Science, 1998. 87
BIBLIOGRAPHY
88
[9] Breiman, L., Friedman, J. H., Olshen, R. A., and Stone, C. J. Classi cation and Regression Trees. Wadsworth, Belmont, Calif., USA, 1984. [10] Breiman, L., Bagging Predictors, Machine Learning, 24, 123-140, 1996. [11] Dasarathy, B. V. (Ed.), Nearest Neighbor(NN) Norms: NN Pattern Classi cation Techniques, CA:IEEE Computer Society Press, Los Alamitos, 1991. [12] De Boor, C., A Practical Guide to Splines, Springer, New York, 1978. [13] Demiroz, G., Non-Incremental Classi cation Learning Algorithms Basedon Voting Feature Intervals, Bilkent University, Dept. of Computer Engineering and Information Science, MSc. Thesis, 1997. [14] Domingos, P., Occam's Two Razors, The Sharp and the Blunt, Proceedings of KDD'98, 1998. [15] Domingos, P., Context-sensitive Feature Selection for Lazy Learners, Arti cal Intelligence Review (Special Issue on Lazy Learning), 11, 227-253, 1997. [16] Duda, R. and Hart,P.E., Pattern Classi cation and Scene Analysis, Wiley, 1973. [17] Fayyad, U.M., Piatetsky-Shapiro, G., Smyth, P., Uthurusamy, R., Advances in Knowledge Discovery and Data Mining, AAAI Press, MIT Press, Menlo Park, Cal., 1996. [18] Fayyad, U.M., Piatetsky-Shapiro, G., and Smyth, P., The KDD Process for Extracting Useful Knowledge from Volumes of Data, Communications of the ACM, Vol.39, No.11, 27-34, 1996. [19] Friedman, J. H., Multivariate Adaptive Regression Splines, The Annals of Statistics, 19 (1) 1-141, 1991. [20] Friedman, J. H. and Stuetzle, W., Projection Pursuit Regression. J. Amer. Statist. Assoc., 76, 817-823, 1981.
BIBLIOGRAPHY
89
[21] Friedman, J. H. and Tukey, J. W. A Projection Pursuit Algorithm for Exploratory Data Analysis, J. Amer. Statist. Assoc., C-23, 9, 881-890, 1974. [22] Friedman, J. H., On Bias, Variance, 0/1-loss and the Curse of Dimensionality, Data Mining and Knowledge Discovery, 1, 55, 1997. [23] Friedman, J. H., Local Learning Based on Recursive Covering, [ftp:// stat.stanford.edu/pub/friedman/dart.ps.Z], 1996. [24] Guvenir, H. A. and S�irin, I_., Classi cation by Feature Partitioning, Machine Learning, 23:47-67, 1996. [25] Guvenir, H. A. and Ko�c, H. G., Concept Representation with Overlapping Feature Intervals, Cybernetics and Systems: An International Journal, 29(3), 263-282, 1998. [26] Guvenir, H. A. and Demiroz, G., Ilter N., Learning Di�erential Diagnosis of Erythemato Squamous Diseases using Voting Feature Intervals, Arti cial Intelligence in Medicine, 13:147-165, 1998. [27] Guvenir, H. A., Alt�ngovde S., Uysal, I_., and Erel E., Bankruptcy Prediction Using Feature Projection-based Classi cation, Proceedings of Fifth International Conference on Information Systems Analysis and Synthesis, Florida, 1999. [28] Guvenir, H. A. and Uysal, I_., Bilkent Function Approximation Repository, [http://funapp.cs.bilkent.edu.tr/], 1999. [29] Hall, P., On Projection Pursuit Regression, The Annals of Statistics, Vol. 17, No.2, 573-588, 1989. [30] Hastie, T., Tibshirani, R., Generalized Additive Models (with discussion) Statistics Science, 1, 297-318, 1986. [31] Holte, R. C., Very Simple Classi cation Rules Perform Well on Most Commonly Used Datasets, Machine Learning, 11,63-91, 1993. [32] Imielinski, T., Mannila, H., A Database Perspective on Knowledge Discovery, Communications of the ACM, Vol.39, No.11, 58-64, 1996.
BIBLIOGRAPHY
90
[33] Karalic, A., Employing Linear Regression in Regression Tree Leaves, In Proceedings of ECAI'92 (European Congress on Arti cial Intelligence), Vienna, Austria, Bernd Newmann (Ed.),440-441, 1992. [34] Karalic, A., Linear Regression in Regression Tree Leaves, In Proceedings of ISSEK'92 (International School for Synthesis of Expert Knowledge) Workshop, Bled, Slovenia, 1992. [35] Kaufman, L. and Rousseeuw, P.J., Finding Groups in Data - An Introduction to Cluster Analysis, Wiley Series in Probability and Mathematical Statistics, 1990. [36] Kibler, D., Aha D. W., Albert, M. K., Instance-based Prediction of Realvalued Attributes, Comput. Intell., 5, 51-57, 1989. [37] Lock, R. H. and Arnold, T., Datasets and Stories: Introduction and Guidelines, Journal of Statistics Education [Online], 1 (1), [http:// www.amstat.org/publications/jse/v1n1/datasets.html], 1993. [38] Matheus, C. J., Chan, P. K., Piatetsky-Shapiro, G., Systems for Knowledge Discovery in Databases, IEEE Transactions on Knowledge and Data Engineering, 5(6), 903-913, 1993. [39] McTear, M.F., Anderson, T.J., Understanding Knowledge Engineering, Ellis Horwood, 1990. [40] Mitchell, T.M., Machine Learning, McGraw Hill, 1997. [41] Niblett, T. and Bratko I., Learning Decision Rules in Noisy Domains, Developments in Expert Systems, Cambridge University Press, 1986. [42] Peterson, M., Lundberg, D., Ek, A., Knowledge Engineering System Design in Di�use Domains, Studentlitteratur, Chartwell-Bratt, 1990. [43] Press, W. H., Flannery, B.P., Teukolsky, S.A., and Vetterling, W.T., Numerical Recipes in C, Cambridge University Press, 1988. [44] Quinlan, J. R., Combining Instance-based and Model-based Learning, International Conference on Machine Learning , pp. 236-243, 1993.
BIBLIOGRAPHY
91
[45] Quinlan, J. R., Learning with Continuous Classes, In Proceedings AI 92 (Adams and Sterling Eds.), 343-348, Singapore, 1992. [46] Quinlan, J. R., Induction of Decision Trees, Machine Learning, 1, 81-106, 1986. [47] Quinlan, J. R., Unknown Attribute Values in Induction, In A. Segre (Ed.), In Proceedings of the 16th International Workshop on Machine Learning, 164-168, San Mateo, CA:Morgan Kaufmann, 1989. [48] Quinlan, J. R., C4.5: Programs for Machine Learning, Morgan Kaufmann, California, 1993. [49] Rawlings, J. O., Applied Regression Analysis: A Research Tool, Wadsworth , Belmont, California, 1988. [50] Rosenbrock, H.H., An Automatic Method for Finding the Greatest or Least Value of a Function, Computer Journal, 3, 175-184, 1960. [51] SPSS Sample Data Sets, [ftp://ftp.spss.com/pub/spss/sample/datasets/], 1999. [52] Tukey, J. W., Exploratory Data Analysis, Addison-Wesley Publishing Company, Inc., 1977. [53] Uysal, I_. and Guvenir, H. A. An Overview of Regression Techniques for Knowledge Discovery, Knowledge Engineering Review, Cambridge University Press, Vol.14, No.4, 319-340, 1999. [54] Uysal, I_. and Guvenir, H. A., Regression by Feature Projections, Proceedings of Third Eurepean Conference on Principles and Practice of Knowledge Discovery in Databases (PKDD'99), Springer-Verlag, LNAI 1704, Jan. M. Zytkow and Jan Rauch (Eds.), Prague, Czech Republic, 568-573, 1999. [55] Uysal, I_. and Guvenir, H. A., An Application of Inductive Learning for Mining Basket Data, Proceedings of TAINN'99, I_stanbul, 30-39, 1999. [56] Webb, G. and Kuzmycz, M. Further Experimental Evidence Against the Utility of Occam's Razor. Journal of Arti cial Intelligence Research, 4, 397-417, 1996.
BIBLIOGRAPHY
92
[57] Weiss, S. and Indurkhya, N., Optimized Rule Induction. IEEE Expert, 8(6), 61-69, 1993. [58] Weiss, S. and Indurkhya, N., Rule-based Regression, In Proceedings of the 13th International Joint Conference on Arti cial Intelligence, pp10721078, 1993. [59] Weiss, S. and Indurkhya, N., Rule-based Machine Learning Methods for Functional Prediction, Journal of Arti cial Intelligence Research, 3 383403, 1995. [60] Weiss, S. and Indurkhya, N., Predictive Data Mining: A Practical Guide, Morgan Kaufmann, San Francisco, 1998. [61] Wettscherect, D., Aha, D.W., and Mohri, T., A Review and Empirical Evaluation of Feature-Weighting Methods for a Class of Lazy Learning Algorithms, AI Review, Vol.11, No.1-5, 273-314, 1997.