Instantiating a Global Network Measurement Framework Jeff Boote1 , Eric Boyd1 , Aaron Brown1 , Maxim Grigoriev2, Joe Metzger3 , Martin Swany4 , Brian Tierney3 , Matt Zekauskas1, Yee-Ting Li5 , and Jason Zurawski1 1
Internet2 {aaron, boote, eboyd, matt, zurawski}@internet2.edu 2 Fermi National Accelerator Laboratory
[email protected] 3 Lawrence Berkeley National Laboratory {metzger, bltierney}@es.net 4 University of Delaware
[email protected] 5 SLAC National Accelerator Laboratory
[email protected]
Abstract. perfSONAR is a web services-based infrastructure for collecting and publishing network performance monitoring. A primary goal of perfSONAR is making it easier to solve end-to-end performance problems on paths crossing several networks. It contains a set of services delivering performance measurements in a federated environment. These services act as an intermediate layer, between the performance measurement tools and the diagnostic or visualization applications. This layer is aimed at making and exchanging performance measurements across multiple networks and multiple user communities, using well-defined protocols. This paper summarizes the key perfSONAR components, and describes how they are deployed by the US-LHC community to monitor the networks distributing LHC data from CERN. All monitoring data described herein is publicly available, and we hope the availability of this data via a standard schema will inspire others to contribute to the effort by building network data analysis applications that use perfSONAR.
1 Introduction perfSONAR is a framework that enables network performance information to be gathered and exchanged in a multi-domain, federated environment. The goal of perfSONAR is to enable ubiquitous gathering and sharing of this performance information to simplify management of advanced networks, facilitate cross-domain troubleshooting and to allow next-generation applications to tailor their execution to the state of the network. This system has been designed to accommodate easy extensibility for new network metrics and to facilitate the automatic processing of these metrics as much as possible. perfSONAR is a joint project started by several national R&E networks and other interested partners. The complete set of participants is available from the perfSONAR web site[24]. The aim of this project is to create an interoperable framework to be gathered and exchanged in a multi-domain, heterogeneous, federated manner. perfSONAR
is targeting a wide range of use cases. For example current use cases include: collection and publication of latency data, collection and publication of achievable bandwidth results, publication of utilization data, publication of network topology data, diagnosing performance issues, and several others. While perfSONAR is currently focused on publication of network metrics, it is designed to be flexible enough to handle new metrics from technologies such as middleware or host monitoring. We envision a number of future, higher-level services that will use the perfSONAR data in interesting ways. For example, data transfer middleware could use perfSONAR to locate the best replica/copy of a file to request, or to help determine the optimal network protocol to use for a given link. Network engineers could use perfSONAR to help automate the detection of large bulk data flows that may require special handling, such as tagging the flow as high- or low-priority, depending on its source or destination. Finally, network researchers will find perfSONAR-enabled networks a convenient source of performance and topology information. A focus of the perfSONAR project has been to define standard schemas and data models for network performance information. Development of actual, interoperable implementations has followed the Internet Engineering Task Force (IETF) spirit of multiple working interoperable implementations. There are at least 10 different organizations producing perfSONAR-compliant software implementations at this time. The work described in this paper is focused around a collection of perfSONAR services written in Perl collectively called perfSONAR-PS, freely available for download at http://www.perfsonar.net/download.html. Previous papers on perfSONAR have described the original overall architecture[9], the data model and schemata [34], and the perfSONAR Lookup Service [33]. The topic of this paper is the large-scale deployment of perfSONAR for a single community, how it has been used thus far, and how it is intended be used in the future. The contribution of this paper is to demonstrate that the perfSONAR approach is real, practical and useful. We also hope to inspire others to contribute to the effort by building network-aware middleware and analysis applications on top of perfSONAR, and to help us find to help us find solutions to the security and privacy issues for this type of looselycoupled system. 1.1 LHC Use of perfSONAR Much of the current perfSONAR effort targets the immediate needs of the Large Hadron Collider (LHC) community. The LHC, located at CERN near Geneva Switzerland, will soon be generating about 100 Terabytes of data per day. The LHC data distribution model is a multi-tiered where data source is called “Tier-0” and the first level processing and storage is called “Tier-1.” There are 11 Tier-1 sites; each site is expected to handle and store about one Petabyte of raw data per month. The 140 “Tier-2” sites are based at research universities and other scientific facilities and will play the major role in data analysis. There will be continuous exchange of high volumes of physics data between various Tier-1 and Tier-2 centers because Tier-1 centers are playing a "data-hub" role and data will be replicated among several Tier-1 sites. The expected wide area data rates into and out of the Tier-1 sites will be at least 20 Gbps, so this traffic will be segregated from the general Internet whenever possible, and the ability to collect both 2
active and passive monitoring data is important. Although network circuits between Tier-0 and Tier-1 sites are built on a very well provisioned private optical network, called LHCOPN [15], the mesh of network connections between Tier-1 and Tier-2 sites might have frequent problems with connectivity and data transfer performance. To make it easy for LHC sites to deploy, we have packaged perfSONAR-PS tools in a Knoppix-based [13] bootable CD, called the pS-NPToolkit. Sites only need to insert the pS-NPToolkit CD, boot up the host, and answer a few configuration questions to have an operational measurement point. As of October 1, 2008, the US-ATLAS part of LHC has committed to deploy perfSONAR-PS hosts at 10 sites. Each site will be running two monitoring hosts, one for latency services, and one for bandwidth services, as bandwidth testing adversely affects latency tests. These services are described in more detail below. US-ATLAS is planning to use perfSONAR to help monitor its circuits, and to provide realistic bandwidth expectations to its users. For US-CMS collaboration of the LHC, the plan is to deploy perfSONAR-based monitoring at Tier-1 sites and complete deployment for the Tier-2 sites by the end of the year 2008.
2 Related Work The idea of deploying global network monitoring system is not new. Several research and community based projects were trying to achieve some level of coverage in the past. Among them were AMP [20], RIPE [26], NIMI [23], PingER [19], Surveyor [12], Skitter [10], Archipelago [2] and others. Each project was trying to cover as much Internet space as possible to be as useful as possible. A major challenge that these projects (except the current Archipelago) have not overcome is closely related to the centralized model of the data collection and processing. It is hard to maintain interest in the community (and funding) for long periods of time, and also motivate administrators of the remote monitoring probes to keep them running. Moreover, none of these different monitoring frameworks were interoperable. As perfSONAR is based on WS-I complaint interoperable Web Services, it has aspects in common with Grid software such as the Globus Monitoring and Discovery System (MDS)[7], which is able to summarize resources and federate with related monitors. In a paper presented at PAM2008, Allman et. al. described a "Community-Oriented" network monitoring architecture [1] that has much in common with the perfSONAR architecture first presented at ICSOC 2005 [9]. A key difference between the system they outlined is that their lookup service is based on OpenDHT, while perfSONAR is based on a hierarchical distributed service with redundant top level servers.
3 perfSONAR-PS components In this section, we briefly describe the applications and services that make up the perfSONAR-capable pS-NPToolkit, as deployed for monitoring LHC-related networks. The core components of the perfSONAR architecture used in this case are the data producers - Measurement Point (MP) and Measurement Archive (MA) services, data consumers (Analysis clients) and discovery - Information Services (IS). The MPs and MAs are 3
responsible for exposing performance metrics, and, in the MA case, in potentially accepting metrics for later retrieval. The IS is responsible for helping clients find available services and even finding relationships between specific network topology elements. 3.1 Information Service The perfSONAR Information Service (IS) is used for service registration, service discovery, data discovery, and network topology representation. These services were previously separated into a Lookup Service (LS) and a Topology Service (TS), but those systems overlap significantly in some cases. The query syntax of the two is essentially the same, and the infrastructure used to support local registration and global discovery is common as well, so these were merged into a single IS. The discovery function of the IS involves accepting registration information from perfSONAR services. As each component updates its information, other components and clients may locate these deployed services via queries. All service descriptions and network metrics, (both actual data and descriptions of the types of data an MP may collect) are defined using XML schema and encoded in XML. The topology service functionality within the IS stores a representation of the elements of the network topology. This is used for pathfinding, representing relationships between elements about which performance data has been gathered, and to make decisions about topologically-appropriate network services. Local IS instances accept XML-based information and make it available via XQuerybased queries. These local instances must facilitate discovery of what information sets are contained, but at the same time must constrain the volume of information that is propagated. To address this, IS instances compute “summaries” and register these summaries with higher-level IS instances. Where a local IS instance would have complete information about the data in a given MA, the summarized information would contain information saying “I have metric X for some interfaces in network W.X.Y.Z/24.” These summaries can be further summarized to the higher levels of the hierarchy. When an entity is launching a query against the system, it can first engage in a “discovery phase” during which candidate IS instances are identified, then it can query the set of candidate IS instances for the desired information. Architecturally, there can be multiple levels in the hierarchy, but the currently-deployed software only supports 2 levels: a local and global scope. Additionally, services can be configured to register with multiple IS instances for redundancy. 3.2 Diagnostic Tools A couple of high-level user network diagnostic tools, NDT and NPAD, are provided on the pS-NPToolkit. NDT [5] allows end users to test the network path for a limited number of common problems, such as inadequate TCP buffer sizes and duplex mismatches. NDT attempts to determine what kind of performance the user should expect, and what the current limiting factor is. NPAD [18] allows end-users to test limited portions of the network path and attempts to determine if there are issues that would adversely effect longer paths. The user provides a target data rate and round-trip-time (RTT) and NPAD attempts to determine if that should be possible, given the infrastructure on that limited 4
portion of the path. Both NDT and NPAD are registered with the perfSONAR IS so that they can be easily located. 3.3 Measurement Tools The pS-NPToolkit contains a collection of tools for collecting passive and active measurements. The specific tools were selected based on two criteria. One, they provide the specific metrics LHC Network administrators determined they needed for monitoring[14]; and, two, they have been extended, in some way, to integrate with the perfSONAR infrastructure. SNMP Passive interface statistics delivered via SNMP [6], are a common non-intrusive health indication of the network. Metrics, such as utilization, errors, and discards at both the octet and packet level, can be especially important when detecting performance and related problems. The pS-NPToolkit incorporates a Cacti [4] instance that can be configured to collect these interface metrics using web-menus. The resulting Cacti roundrobin database [27] of metrics is then published using a perfSONAR MA interface. PingER ping-based monitoring is frequently used by many wide area network monitoring projects. ping monitoring is particularly useful because it is lightweight and only requires ICMP traffic to be allowed through a firewall. The perfSONAR PingER-MA supports the same set of measured metrics as the PingER project [19], but is built on a completely new code base and integrates perfSONAR functionality. The perfSONAR PingER-MA is configurable using a web-based GUI; it utilizes the perfSONAR IS to find other existing measurement nodes to which to run tests. PingER includes a perfSONAR MA interface for publishing the end-to-end connectivity metrics. OWAMP and perfSONAR-BUOY owamp[22] is an implementation of RFC 4656[29] and is used to run active tests to collect one-way latency and other related metrics such as loss and delay variation. One-way latencies are useful for isolating the direction of performance issues and can also be used to look for routing problems as well as interface queueing. perfSONAR-BUOY is a perfSONAR service that can be used to define sparse sets of active measurements to be performed and archived. The web-based configuration GUI utilizes the IS to find owamp test peers, again allowing user-specified affinities. perfSONAR-BUOY then exposes the owamp data using a perfSONAR MA interface. BWCTL and perfSONAR-BUOY bwctl[3] is a tool that adds distributed scheduling and policy capabilities to the well known Iperf[11] throughput testing tool. This allows ad-hoc throughput tests to occur on the same host as regular measurements without worry of overlapping tests skewing the results. For the LHC project, deployments will run regular TCP throughput tests. By default a 30 second test is run every 2 hours.The archived achievable throughput metrics are useful to the LHC participants as a way to set expectations. If the LHC data transfers 5
are not performing similarly to the regular throughput tests, then further analysis is warranted. As in the owamp case, perfSONAR-BUOY is used to configure the set of active throughput tests using bwctl in addition to making the archived metrics available through the perfSONAR MA interface.
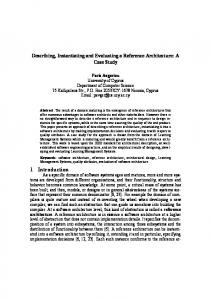
4 Experimental Results As of this writing, the full-scale deployment of perfSONAR in the LHC community is underway. To see a list of currently active public perfSONAR tools and services, go to http://www.perfsonar.net/activeServices.html. As of October 1, 2008, there were 14 hosts running perfSONAR services from which anyone can request data. The current plan for monitoring LHC network traffic is that by the end of 2008 there will be roughly 100 hosts running perfSONAR services on over 30 independent networks. A simple example of what is possible today is the ability to answer the question: “Give me all the network monitoring data along the path from Host A at Fermi National Lab (FNAL), a Tier-1 site, and Host B at the University of Michigan, a Tier-2 site.” This network path crosses four network domains (FNAL, ESnet, Internet2, and U Mich), all of which are publishing SNMP data via a perfSONAR MA. There are perfSONAR MP’s on every network segment collecting regular latency measurement, using PingER, and achievable bandwidth [17] measurements, using iperf. Using perfSONAR’s Information Service, one can easily determine all available data related to the network path from Host A at FNAL to Host B at UMich. For example, if an LHC user wanted to know what the typical achievable bandwidth was from FNAL to UMich, they can query the perfSONAR-BUOY MA at FNAL for recent iperf results, as shown in Figure 1 . This type of data helps greatly set performance expectations for users, allowing users to know what rates are possible on any given path.
Fig. 1. 8-hour history of achievable bandwidth
If one wanted to look to see if cross traffic was affecting achievable throughput on a given path, they could query for all SNMP data along the path, and compare it with achievable bandwidth and latency data, as shown in Figure 2. This plot shows both ping and iperf results for an 8 hour window on the network path from FNAL to UMich. Note the latency spikes around 11:30 that are clearly related to the traffic spike on the UMich router during that same time. 6
Fig. 2. Example comparison of multiple metrics
This is a very simple example of the types of analysis that is enabled by wide deployment of perfSONAR services. A few prototype visualization and analysis tools have been written such as GMAPS (http://packrat.internet2.edu:8008/), which provides a Google Maps interface to locate perfSONAR data, and perfsonarUI [25], which provides a large number of ways to view various types of perfSONAR published data. There are also command line tools that allow one to query for raw data, as was used of the plots in this paper.
5 Future Work The perfSONAR architecture enables a large number of opportunities for higher-level services and functionality. Current and planned uses for perfSONAR services for the LHC community include: – monitoring link-by-link status of network circuits to provide general health and performance metrics – using published topology to implement path-finding algorithms – locating Inter-Domain Controllers for dynamic circuits – notification services (e.g. generate an alarm whenever link utilization goes above 90% ) – publishing of middleware and application log data – publishing of flow-related passive network data (e.g. note specific patterns which could indicate an event such as an intrusion) 7
As more perfSONAR hosts are deployed, we have quickly discovered the need for better scoping abilities in the IS user interfaces. For example, the query “show me all LHC-related bwctl services” currently returns a rather unwieldy list of URLs. Users will need to be given good ways to sort and group related services, perhaps based on administrative domains or geography. Scoping information can be represented in the IS schemas, but has not been used much yet. Growth in perfSONAR deployments will begin to require this use in practice. Additionally, there is the potential for client applications to utilize perfSONAR published performance data to modify application behavior. For the specific LHC use case, the performance data might allow a client application to determine which copy of a remote dataset can be most efficiently retrieved.
6 Security Considerations Authentication and authorization will be critical for expanding perfSONAR usage. The US LHC sites will be using perfSONAR to make available data that their community policy has determined to be public. However, we are working with several groups that want to use perfSONAR to publish summaries of flow records, but only to a select group of network engineers. Other networks are reluctant to publish network utilization data, and network topology data is almost always deemed sensitive. For the perfSONAR components to be generally useful, they must integrate with existing authentication and authorization deployments. The wide-variety of existing SAML[28] based mechanisms such as [21][16][31][30][32] used in the R&E community led the perfSONAR group to work with the eduGAIN[8] developers to define mechanisms for bridging authentication and authorization requests from perfSONAR to the SAML-based infrastructures. The perfSONAR architecture therefore includes an authentication and authorization-related service (AS), which is used by the other perfSONAR services. The AS enables domains to centralize their authentication and authorization interactions. Other perfSONAR services interact with the AS, which then is responsible for communicating with the specific authentication and authorization architectures in use by the domain. This solution requires domains to federate their authentication mechanisms to work. Because federated authentication and authorization architectures are still relatively immature, perfSONAR developers isolated these issues to the AS service, which can more easily be modified without causing excessive changes to the rest of the perfSONAR architecture. Even without authentication there are a number of protections in place on the USATLAS deployment. The owamp and bwctl tools both give sites rudimentary control over who can request tests, what kinds of tests they can request, and how much network resources they can consume. Tools like TCP wrappers and firewalls can also be used to restrict access to the perfSONAR services.
7 Conclusion We described a measurement framework for characterizing the behavior and usage of the network. Our approach for the implementation of the system is a scalable, dis8
tributed, service-oriented architecture. The framework combines information from different kinds of measurement tools that currently exist and is able to easily accommodate new ones. Full scale deployment of these services is currently underway, and early results show promise. Clearly we have barely begun to scratch the surface on the types of analysis that is enabled by wide deployment of perfSONAR services. We hope the network research community will take advantage of this wealth of publicly available information and develop additional interesting analysis tools and techniques that use the perfSONAR services.
8 Acknowledgements This work was supported by the Director, Office of Science, Office of Basic Energy Sciences, of the U.S. Department of Energy under Contract No. DE-AC02-05CH11231. This document is report number LBNL-1452E.
References 1. M. Allman, L. Martin, M. Rabinovich, and K. Atchinson. On community-oriented internet measurement. In M. Claypool and S. Uhlig, editors, Passive and Active Measurement (PAM), volume 4979 of Lecture Notes in Computer Science, pages 112–121. Springer, 2008. 2. Archipelago Measurement Infrastructure. http://www.caida.org/projects/ark/. 3. Bandwidth Test Controller (BWCTL). http://e2epi.internet2.edu/bwctl/. 4. Cacti Network Monitoring Tool. http://www.cacti.net/. 5. R. Carlson. Developing the Web100 based network diagnostic tool (NDT). In Passive and Active Measurement (PAM), 2003. 6. J. Case, M. Fedor, M. Schoffstall, and J. Davin. A Simple Network Management Protocol (SNMP). RFC 1157, May 1990. 7. K. Czajkowski, S. Fitzgerald, I. Foster, and C. Kesselman. Grid information services for distributed resource sharing. In 10th IEEE High Performance Distributed Computing, HPDC10, 2001. 8. edugain.org. http://www.edugain.org/. 9. A. Hanemann, J. Boote, E. Boyd, J. Durand, L. Kudarimoti, R. Lapacz, M. Swany, S. Trocha, and J. Zurawski. Perfsonar: A service oriented architecture for multi-domain network monitoring. In Third International Conference on Service Oriented Computing - ICSOC 2005, LNCS 3826, Springer Verlag, pages 241–254, Amsterdam, The Netherlands, December 2005. 10. B. Huffaker, D. Plummer, D. Moore, and k. claffy. Topology discovery by active probing. In Symposium on Applications and the Internet, Jan. 2002. 11. Iperf. http://dast.nlanr.net/Projects/Iperf/. 12. S. Kalidindi and M. J. Zekauskas. Surveyor: An Infrastructure for Internet Performance Measurements. In Proceedings of INET ’99, June 1999. 13. Knoppix Linux Distribution. http://www.knoppix.net/. 14. Tier 2 Best Common Practices. http://code.google.com/p/perfsonar-ps/wiki/Tier2BCP. 15. LHC Optical Private Network. http://lhcopn.cern.ch. 16. D. R. López and R. Castro-Rojo. Ubiquitous Internet Access Control: The PAPI System. In 13th International Workshop on Database and Expert Systems Applications, 2002.
9
17. B. Lowekamp, B. Tierney, L. Cottrell, R. Hughes-Jones, T. Kielmann, and M. Swany. Enabling Network Measurement Portability Through a Hierarchy of Characteristics. In 4th International Workshop on Grid Computing (Grid2003), 2003. 18. M. Mathis, J. Heffner, P. O’Neil, and P. Siemsen. Pathdiag: Automated TCP Diagnosis. In Passive and Active Measurement (PAM), April 2008. 19. W. Matthews and L. Cottrell. The PingER Project: Active Internet Performance Monitoring for the HENP Community. IEEE Communications Magazine on Network Traffic Measurements and Experiments, May 2000. 20. T. McGregor, H. Braun, and J. Brown. The NLANR network analysis infrastructure. In IEEE Communications, volume 38, May 2000. 21. R. L. Morgan, S. Cantor, S. Carmody, W. Hoehn, and K. Klingenstein. Federated Security: The Shibboleth Approach. EDUCAUSE Quarterly, 27(4), 2004. 22. One-way Ping (OWAMP). http://e2epi.internet2.edu/owamp/. 23. V. Paxson, J. Mahdavi, A. Adams, and M. Mathis. An architecture for large-scale internet measurement. IEEE Communications, 36:48–54, 1998. 24. Performance focused Service Oriented Network monitoring ARchitecture. http://www.perfsonar.net. 25. perfsonarUI. http://wiki.perfsonar.net/jra1-wiki/index.php/PerfsonarUI. 26. RIPE NCC. http://www.ripe.net/ttm/. 27. Round robin database. http://people.ee.ethz.ch/ oetiker/webtools/rrdtool/. 28. SAML. http://docs.oasis-open.org/security/saml/v2.0/saml-2.0-os.zip, March 2005. 29. S. Shalunov, B. Teitelbaum, A. Karp, J. Boote, and M. Zekauskas. A One-way Active Measurement Protocol (OWAMP). RFC 4656 (Proposed Standard), Sept. 2006. 30. simplesamlphp. http://rnd.feide.no/simplesamlphp. 31. T. Verschuren, M. Koopmans, and A. Odaci. Introducing A-select, a Web Initial Sign-On System. In TERENA Networking Conference, 2003. 32. V. Welch, T. Barton, K. Keahey, and F. Siebenlist. Attributes, Anonymity, and Access: Shibboleth and Globus Integration to Facilitate Grid Collaboration. In 4th Annual PKI R&D Workshop, 2005. 33. J. Zurawski, J. Boote, E. Boyd, M. Glowiak, A. Hanemann, M. Swany, and S. Trocha. Hierarchically federated registration and lookup within the perfsonar framework (short paper, poster session). In Tenth IFIP/IEEE International Symposium on Integrated Network Management (IM 2007), 2007. 34. J. Zurawski, M. Swany, and D. Gunter. A scalable framework for representation and exchange of network measurements. In IEEE/Create-Net Conference on Testbeds and Research Infrastructures for the Development of Networks and Communities, Barcelona, Spain, March 2006.
10