in the High School Algebra I Inclusive Classroom. Lillian M. ... of high school in fiscal year 2000 faced new mathematic
Instructional Strategies and Practices Used to Enhance Student Success in the High School Algebra I Inclusive Classroom Lillian M. Lowery
Dissertation submitted to the Faculty of the Virginia Polytechnic Institute and State University in partial fulfillment of the requirements for the degree of
DOCTOR OF EDUCATION in Educational Leadership and Policy Studies
Jean B. Crockett, Chair Alice Farling Steve Parson Richard Salmon Jennifer Sughrue
June 2003 Blacksburg, Virginia Keywords: Algebra I, Inclusion, Instructional Strategies, and Disabilities Copyright 2003, Lillian M. Lowery
Instructional Strategies and Practices Used to Enhance Student Success in the High School Algebra I Inclusive Classroom
Lillian M. Lowery Dr. Jean B. Crockett, Chair (ABSTRACT) The purpose of this qualitative study was to examine the instructional conditions and practices described as successful for teachers in the Algebra I inclusive classroom. In the southeastern suburban school district used for this study, students who began their freshman year of high school in fiscal year 2000 faced new mathematics requirements for high school graduation, including taking Algebra I and passing an Algebra I end-of-course standards-based test. The new mathematics requirements presented a daunting challenge to general and special educators as increasing numbers of students with disabilities began to receive their instruction in the general education classroom. This school district targeted schools based on student performance on standards-based end-of-course tests and provided extra support and resources to enhance teaching and learning; however, other schools in the district had to reach the same goal - improved student achievement -- without the extra resources. Based on a comparative case study of three separate inclusive classrooms from three separate schools, findings were presented through a discussion of the theoretical framework. The theoretical framework for this study included theories from Skinner (1953) and Gagné (1985). Data were collected through interviews with teachers and their students with and without disabilities, through observations in classrooms, and by review of student data. Four major domains were addressed in this study. Those domains included instructional conditions, climate
and planning, and instructional interventions, the use of time and teacher adaptations and accommodations. This study supported the notion that an affective classroom climate coupled with collaborative planning among team teachers, general educators and special educators who co-teach in the inclusive classroom, promotes an instructional environment conducive to learning. The effective use of time along with teacher adaptations and accommodations appeared to keep students engaged in the learning process. However, other influences, including insufficient teacher training, negative student behaviors, and inappropriate student placement, were found to affect student achievement in the inclusive classroom.
iii
ACKNOWLEDGEMENTS Although ultimately the dissertation process is individualistic as it relates to personal focus, single-minded commitment, and sheer tenacity, I acknowledge that without the support of invaluable mentors, family, and friends, I could have easily lost focus and failed to complete the dissertation process. With this acknowledgement in mind, I share my sincerest appreciation to the following people. First, I extend my appreciation and total respect to the administrators, teachers, and students who participated in this study. Their time, energy, and passion about teaching and learning made me extremely proud to be a public school educator. Of course, without Dr. Jean B. Crockett, this process might have been simply a futile effort by an inexperienced researcher and writer. So, for all the nights that Dr. Crockett spent with me via the telephone to compensate for my being hundreds of miles away from her and my committee members, my most heartfelt thanks. Dr. Crockett, thanks for keeping me centered and for listening as I rambled on about life and work in general. A special thank you is extended to Dr. Steve Parson for agreeing to serve on my dissertation committee, after the fact, and for assisting me with my educational administration certification some eight years ago. I extend a sincere appreciation for Dr. Richard G. Salmon and his voice of reason. My first in-depth research related to students with disabilities was done as an assignment for Dr. Salmon; it was an investigation into the state’s funding process as it related to the cost to a specific school district to transport students with disabilities to sites offering a continuum of services. I extend my gratitude to Dr. Jennifer Sughrue. Dr. Sughrue was my entrée into the doctoral program, teaching my cohort’s first class. It was Dr. Sughrue who first piqued my interest in standards-based education. To Dr. Alice Farling, I extend my utmost gratitude and respect for her thoughtfulness and support. Dr. Farling’s
iv
commitment to public school students, especially students with disabilities, was a source of inspiration throughout this process. I extend a special debt of gratitude to Dr. M. David Alexander, Department Chair of the Department of Educational Leadership and Policy Studies. His quiet and constant support throughout my affiliation with Virginia Polytechnic Institute and State University has not gone unnoticed or unappreciated. (The trip to Oxford, England, is one that I will forever cherish.) A special sense of recognition is offered in memory of Dr. Joan Curcio. Had Dr. Curcio not been instrumental in navigating my graduate school admissions process, I may have never acted to make my dream a reality. The irony that at the last minute a Dr. Curcio had to serve on my Preliminary Paper Committee was Joan’s way of letting me know that she would be with me in spirit until the very end. So, Dr. Joan Curcio, in memory of you, here we are. Finally, I offer my love and appreciation to my family and friends who patiently gave me my space as I single-mindedly committed myself to completing this process. My commitment to completing the process was one way of thanking them for their unyielding support, patience, and understanding. Thank you, with love, Mr. and Mrs. (Mama) James Bagley, Jr.; Judge and Mrs. (Juanita) Ralph C. Gingles, Jr.; Lisa Lowery; Zenobia L. Campbell; Lisa Oglesby; Mr. and Mrs. Carl (Rosemary) Odrick; Henry Johnson, Jr.; and Lynn T. Brown.
v
TABLE OF CONTENTS Page Abstract .............................................................................................................................. Acknowledgements............................................................................................................. List of Tables ...................................................................................................................... List of Figures.....................................................................................................................
ii iv x xi
Chapter I The Problem ........................................................................................................ Context of the Study ................................................................................................ Historical and National Context ............................................................................... National Commission on Excellence in Education Report: A Nation at Risk ............................................................................... Goals 2000: Educate America Act of 1994................................................... No Child Left Behind (NCLB) Act of 2001.................................................. State Context ........................................................................................................... Local Context .......................................................................................................... Statement of Problem .............................................................................................. Purpose of the Study................................................................................................ Research Questions ................................................................................................. Methodology ........................................................................................................... Theoretical Context and Framework ........................................................................ Behavioral Learning Theory......................................................................... Cognitive Learning Theory .......................................................................... Definition of Terms ................................................................................................. Limitations and Delimitations.................................................................................. Summary of the Dissertation....................................................................................
1 1 1 2 3 3 4 5 6 7 8 8 9 9 10 11 13 14
Chapter II Review of Literature........................................................................................... Access to Research Databases ................................................................................. Critical Issues in Mathematics Reform..................................................................... The Effects of Change on Teachers and Teaching ........................................ New Standards, New Students...................................................................... Critical Issues in Teaching in the Inclusive Classroom............................................. The Creation of a Conducive Learning Climate............................................ Planning for the Inclusive Classroom ........................................................... The Use of Time in the Inclusive Classroom ................................................ The Use of Adaptations and Accommodations ............................................. Teacher-Directed Instruction ............................................................ Peer Groups...................................................................................... Pacing and Sequencing ..................................................................... Student Outcomes.................................................................................................... Concerns about Inclusion......................................................................................... Ensuring a Free Appropriate Public Education......................................................... Structuring the Study ...............................................................................................
16 16 17 17 20 22 24 26 28 31 32 32 33 34 37 41 42
vi
Chapter III Methodology..................................................................................................... Purpose of the Study................................................................................................ Theoretical Framework............................................................................................ Research Questions ................................................................................................. Implication of the Study .......................................................................................... Procedures............................................................................................................... Assumptions and Rationale for a Qualitative Design .................................... The Type of Design...................................................................................... The Researcher’s Role ................................................................................. Gaining Access and Entry ............................................................................ Setting Selection .......................................................................................... Participant Selection .................................................................................... Assurance of Confidentiality ........................................................................ Data Collection Procedures...................................................................................... Means of Collecting Data: Instrument Construction ..................................... Teacher Discussions ......................................................................... Interviews......................................................................................... Observations..................................................................................... Documents ....................................................................................... Member Checks................................................................................ Interview Procedures and Protocols .................................................. Observation Procedures .................................................................... Document Data Collection................................................................ Assessing the Cultural Context ......................................................... Pilot Study........................................................................................ Data Analysis and Management Procedures............................................................. Basic Operations in Data Analysis ............................................................... Coding Data Pages to Their Sources ................................................. Unitizing the Data ............................................................................ Discovery ......................................................................................... Inductive Category Coding ............................................................... Refinement of Categories ................................................................. Data Management ........................................................................................ Scheduling Teacher Data Discussions............................................... Transcripts........................................................................................ Document Management.................................................................... Addressing Quality ...................................................................................... Credibility ........................................................................................ Transferability .................................................................................. Dependability ................................................................................... The Qualitative Narrative: Presenting the Results ....................................................
43 44 44 45 47 47 48 48 49 50 51 52 53 56 56 57 59 59 60 60 61 62 62 63 63 64 64 65 67 67 68 69 69 69 71 72 72 73 73 73 74
Chapter IV Findings............................................................................................................ Demographic Profile of Participants ........................................................................ The Participating Jurisdiction and School District ........................................
76 76 77
vii
School One .................................................................................................. School Two.................................................................................................. School Three................................................................................................ Relating the Findings to the Theoretical Framework ................................................ Student Learning .............................................................................. Instructional Conditions and Interventions........................................ Student Outcomes............................................................................. Student Outcomes: A Cross-Case Comparison......................................................... Major Domains........................................................................................................ Classroom Climate....................................................................................... Fostering Opportunities for Personal Instruction............................... Creating Engaging Learning Environments....................................... Interpretive Commentary on Climate................................................ Planning....................................................................................................... Coping with Curricular Constraints .................................................. Coping with Contextual Constraints ................................................. Interpretive Commentary on Planning .............................................. Time ............................................................................................................ Using Time Efficiently and Effectively............................................. Interpretive Commentary on the Use of Time ................................... Adaptations and Accommodations ............................................................... Integrating Adaptations and Accommodations to Benefit All Students .......................................................................... Teaching Actions that Monitor Student Comprehension ................... Interpretive Commentary on the Use of Adaptations and Accommodations .................................................................. Other Influences: Participants’ Reflections and Insights ............................... Teacher Training .............................................................................. Student Behaviors............................................................................. Student Placement ............................................................................ Interpretive Commentary on Other Influences .................................. Discussion ............................................................................................................... Prominent Domains...................................................................................... Relating the Findings and Research to Climate ................................ Relating the Findings and Research to Planning............................... Relating the Findings and Research to Time .................................... Relating the Findings and Research to Adaptations And Accommodations........................................................... Chapter V Conclusions, Implications, and Recommendations ............................................. Conclusions ............................................................................................................. Conclusion 1: The Selected Domains ........................................................... Conclusion 2: The Achievement Gap ........................................................... Conclusion 3: Teacher Training ................................................................... Conclusion 4: Diversity in the Inclusive Classroom...................................... Implications and Recommendations for Teacher Practice ........................................
viii
80 85 90 95 95 95 98 98 103 103 103 104 105 107 107 109 110 111 111 114 115 115 117 118 119 120 121 123 124 126 127 129 130 131 133 135 135 135 136 137 138 138
Principles of Instruction........................................................................................... 140 Recommendations for Future Research.................................................................... 142 Commentary............................................................................................................ 144 References .......................................................................................................................... 146 Appendix A......................................................................................................................... Appendix B......................................................................................................................... Appendix C......................................................................................................................... Appendix D......................................................................................................................... Appendix E ......................................................................................................................... Appendix F ......................................................................................................................... Appendix G......................................................................................................................... Appendix H......................................................................................................................... Appendix I .......................................................................................................................... Appendix J.......................................................................................................................... Appendix K......................................................................................................................... Appendix L ......................................................................................................................... Appendix M ........................................................................................................................ Appendix N......................................................................................................................... Appendix O.........................................................................................................................
155 158 161 162 163 164 165 166 167 168 169 170 171 173 175
Vita..................................................................................................................................... 177
ix
LIST OF TABLES Page Table 3.1
Reference Guide for Internal Documentation of Data Sources......................
66
Table 3.2
Time Spent Collecting Data from Case Sites ................................................
70
Table 4.1
Demographic Profile of Participating School Districts for fiscal year 2001-2002 ............................................................................................
79
2001-2002 Statewide Spring Passing Rates for Non-disabled and Disabled Students on Algebra I SOL Test ....................................................
81
Table 4.3
School One: Student Data ............................................................................
82
Table 4.4
School One: 1999-2002 Passing Rates for Algebra I SOL Test.....................
84
Table 4.5
Focus Group One: Student Outcomes...........................................................
86
Table 4.6
School Two: 2001-2002 Student Data ..........................................................
88
Table 4.7
School Two: 1999-2002 Passing Rates for Algebra I SOL Test ....................
89
Table 4.8
Focus Group Two: Student Outcomes ..........................................................
91
Table 4.9
School Three: 2001-2002 Student Data ........................................................
92
Table 4.10
School Three: 1999-2002 Passing Rates for Algebra I SOL Test ..................
94
Table 4.11
Focus Group Three: Student Outcomes ........................................................
96
Table 4.12
Cross-Case Comparison of Student Course Grades and SOL Test Results.... 102
Table 4.2
x
LIST OF FIGURES Page Figure 1.1............................................................................................................................
11
Figure 2.1............................................................................................................................
37
Figure 3.1............................................................................................................................
46
Figure 3.2............................................................................................................................
58
Figure 4.1............................................................................................................................
99
xi
CHAPTER I THE PROBLEM Context of the Study At the close of the 20th century, the job of the educator remains unchanged: to make tough decisions that guide the effective delivery of instruction to all students, front row or back row, eager or reluctant. (Crockett & Kauffman, 1998, p. 489) In their efforts to comply with federal, state, and local mandates, educators struggle with the many interpretations of mandated laws, especially the interpretations of “least restrictive environment” (Individuals with Disabilities Education Act, 1997). Consequently, the number of students with disabilities being mainstreamed into the general education classroom is growing, and so is the expectation that these students meet the same academic standards as students without disabilities. This expectation has proven to be challenging for general educators who often feel unprepared and ill equipped to address the special needs of such an eclectic group of students in the same classroom. So one may question why general educators should be faced with the inclusion of these students with disabilities in the general education classroom. Allow me to put the challenge in context. Historical and National Context Education for all is not a new concept. As early as the 1760s and 1770s, our nation’s forefathers developed the idea that there should be a free system of education “that would provide for a general diffusion of knowledge, cultivate new learning, and nurture the democratic ideals of government” (Alexander & Alexander, 1998, p. 23). Horace Mann (1847) who saw education as a natural right believed that this free system of education should include everyone. In keeping with this belief, Mann argued that “the state has an obligation to every child to enact a
1
code of laws establishing free public schools” (pp. 124-125). Then class distinctions would be reduced because all children could be given a free education with support from taxpayers and without undue burden on or degradation of any one segment of society. Subsequently, states were charged with educating their citizenry (Alexander & Alexander, 1998). The earliest known school for students with disabilities was established in Hartford, Connecticut, in 1817. By the early twentieth century, students with disabilities had gained entry into the public schools in several states; some state courts, however, did move to exclude students with disabilities. Nevertheless, in 1972, the groundwork for future legislation in the area of students with disabilities’ rights to an education was laid in the historic Mills v. Board of Education of District of Columbia (1972), which emphasized the need for a free appropriate public education for all students. And then came the 1980s. National Commission on Excellence in Education Report: A Nation at Risk Beginning in the 1980s with A Nation at Risk (National Commission on Excellence in Education, 1983), a more conservative approach to educating the nation’s children shaped the purpose of public education and the fundamental rights of all children to access the educational system. Commissioned by the Carter administration and finalized during the Reagan administration, this report on the state of affairs in the United States educational system set in motion a wave of reform initiatives based on a perceived threat to national security and the notion that Our Nation is at risk. . . . The educational foundations of our society are presently being eroded by a rising tide of mediocrity that threatens our very future as a nation and as a people. (p. 5)
2
This report set in motion a reactionary approach to school reform that still influences philosophical, curricular, and financial decisions related to our nation’s public schools. The Commission’s report perpetuated a set of educational reforms that began a national focus on standards-based teaching and learning, which was intended to enhance the quality of public education. Conservative reformers believed that having students demonstrate academic success based on prescribed standards would ensure student and teacher accountability and serve to develop a more economically and internationally competitive citizenry. The conservative belief collided with progressive educators’ focus on incorporating diverse methods of instruction and assessment to meet the varied needs of individual students, including many students from diverse ethnic backgrounds as well as students with disabilities (Kohn, 2000). Goals 2000: Educate America Act of 1994 Subsequent to the release of the Commission’s report, almost 11 years later President George Bush appealed to the nation’s governors to consider national standards for education. Present at the Governors Conference when President Bush made his plea was then Governor of Arkansas, William Jefferson Clinton, who succeeded President Bush to the presidency. In 1994, President Clinton enacted Goals 2000, legislation that awarded states money for the purpose of developing statewide educational standards. Additionally, the 1994 revisions of the Elementary and Secondary Education Act (ESEA) required schools receiving federal funds under the law’s Title I program to adopt rigorous state standards and tests for all students. Educators were charged with providing a standard-based education for all public schools receiving federal funds. No Child Left Behind (NCLB) Act of 2001 Then on January 8, 2002, President George W. Bush signed the revised Elementary and Secondary Act (ESEA), which was drafted in 2001, into law. The revised ESEA, referred to as
3
No Child Left Behind (NCLB), represents the most significant federal education policy initiative in decades. The NCLB Act builds on the foundation of the ESEA and preserves the prior legislation’s basic framework of standards, assessments, and accountability. The new Act, however, requires states to expand the scope and frequency of student testing, revamp the accountability systems, and guarantee that every classroom is staffed with a highly qualified teacher by the 2005-2006 school year. The legislation also requires states to demonstrate progress from year to year in raising the percentage of students who are proficient in reading and mathematics, and in narrowing the achievement gap between advantaged and disadvantaged students. State Context In 1998, the Commonwealth of Virginia instituted a continuum of standards in the four core areas--English, mathematics, history and social science, and science--known as Standards of Learning (SOLs) for Virginia Public Schools (Virginia Department of Education, 1998). The Virginia Board of Education promulgated high standards which when fully implemented included serious penalties for those students, teachers, administrators, and schools that did not comply with state requirements. Initially, each Virginia public school district was under mandate to submit a plan of action for training teachers and administrators charged with instructional and assessment accountability. In addition, beginning with the ninth grade class of 2000-01, students must earn verified units of credit as well as earn the requited standard units of credit. A verified unit of credit is awarded when, in addition to successfully meeting course requirements, the student passes a SOL test for certain courses in high school. By 2007, in order to maintain accreditation, schools must have at least 70% of the students passing the required end-of-course tests.
4
The demands of the Commonwealth’s SOL curriculum and assessment program subsequently determined the instructional objectives and benchmarks that students, teachers, and schools had to meet in order to be deemed successful. The Commonwealth’s Board of Education approved a plan that required public schools to raise student performance on SOL tests (or possibly advanced placement or International Baccalaureate tests) or face the prospect of losing school accreditation as well the prospect of students leaving high school without a standard high school diploma. Local Context In 1999, in compliance with the Commonwealth’s revised mathematics requirements, Virginia school districts changed the mathematics requirements that students needed to earn a high school diploma (Virginia Department of Education, 1995). Consequently, a student had to earn three credits in mathematics to earn a standard diploma and four credits to earn an advanced diploma. Every student who expected to receive a standard or advanced diploma was required to take Algebra I and pass the Algebra I SOL end-of-course test. Additionally, in compliance with the revised Individual with Disabilities Education Act (IDEA) Amendments of 1997, there was the continued requirement that schools give students with disabilities a free and appropriate education in the least restrictive environment. The law presumes that students with disabilities will be educated in regular classrooms “unless their academic and/or social needs [could] not be adequately met there.” Thus, more and more students with disabilities were being included in the general education classroom, alongside their peers without disabilities.
5
The growing number of students with disabilities included in the general education classroom has presented an instructional challenge for general educators who are now faced with a classroom of students with diverse academic skills and learning styles. Teachers are charged with structuring the classroom around task-oriented goals that emphasize learning mastery. They must provide positive reinforcement to students for setting and achieving personal learning goals, with an emphasis on how students perform relative to the students’ past academic performances (Montague, 1995). In order to meet student needs, general educators are working collaboratively with special educators and resource personnel to share strategies and practices that enhance student outcomes for all students in the inclusive classroom. Statement of the Problem Before us is a challenge to reshape mathematics education. This challenge to reshape curriculum and instruction is in response to changes in the nature of the mathematics discipline and to changes in our capacity to nurture mathematics growth in inclusive classrooms. Instructional conditions and changes will affect all students, and require reconsideration of the whole curriculum and the assumptions on which the curriculum rests (Meiring, Rubenstein, Schultz, Lange, & Chambers, 1992). Although new approaches to instruction and assessment can make it possible to increase the scope and depth of the study of mathematical topics for wider and more diverse populations, some researchers (Schumm & Vaughn, 1995) question the extent to which general education teachers are prepared to meet a full range of student needs, particularly those of students with high-incidence disabilities such as learning disabilities. Additionally, researchers have provided evidence supporting the fact that continual failure to collaborate and negative interactions between general and special education faculty place students at great risk for experiencing negative effects (Yasutake & Bryan, 1995). “Most
6
studies concur that in terms of providing intense and individualized instruction to students with special needs, teachers in general education might be willing, but are not quite up to speed” (Crockett & Kauffman, 1998, p. 515). Purpose of the Study The purpose of this study was to examine the instructional conditions and interventions employed by teachers whom administrators deemed successful with students in the Algebra I inclusive classroom. Crockett and Kauffman (1998) observed that of the 2.5 million students with learning disabilities receiving services in the United States as early as 1994-95, 39% of those students spent 80% of their instructional time in the general education classroom. “Frequently, it is the performance of these students in the general education setting that calls for a special instructional response” (Crockett & Kauffman, 1998, p. 492). Unfortunately, “students with disabilities have almost twice the rate of dropping out of high school as their non-disabled peers” (Hehir, 1999, p. 34). Hehir found that once they drop out of school, few students with disabilities ever return. Many general educators do not feel they have the knowledge or skills to plan appropriately for or instruct students with learning disabilities (Schumm, Vaughn, & Gordon, 1994). Classroom observations revealed that many classroom teachers make few adaptations to meet unique needs of students with learning disabilities (McIntosh, Vaughn, Schumm, Hager, & Lee, 1993). Furthermore, Cawley, Miller, and School (1987) found that a typical mathematics class for students with learning disabilities does not emphasize problem solving and higher-level mathematics. Rather, teachers emphasized basic mathematics and conceptual skills. Teachers interviewed by Schumm et al. (1994) identified lack of adequate resources and materials as barriers to successful inclusive instruction.
7
This study addresses current successful teaching practices and resources being used in the Algebra I inclusive classroom. Some teachers are skillful at teaching students with learning disabilities and should be recruited and provided with adequate support for teaching these students (Vaughn & Schumm, 1995). This study will help identify teaching conditions and strategies that foster teacher collaboration and preparation as well as draw attention to the challenges that general educators in the inclusive classroom face when serving a diverse group of learners. Research Questions The fundamental question directing this study was: What strategies and practices do teachers use in the inclusive classroom to enhance achievement for students with diverse academic abilities and needs? Sub-questions for this study included: (a) What do teachers do to create instructional conditions that offer opportunities to provide effective teaching interventions for students with diverse academic abilities and needs? (b) How do general educators and special educators plan for the inclusive classroom? (c) How do teachers use allotted time to maximize teaching and learning capabilities for the instructional period? (d) What adaptations or accommodations do teachers use to differentiate teaching and learning activities to meet diverse student needs? (e) How are students performing in the inclusive classroom? Methodology The methods used in this study are based on qualitative research design, specifically collective case studies. Data were gathered from three separate schools in the form of field observations, teacher and student interviews, and document analysis. Then based on the theoretical framework, data source was selected as a means of gathering data to gauge theories in practice in the inclusive Algebra I classroom.
8
Theoretical Context and Framework Theories of learning attempt to explain why teachers and students behave as they do. Because theory is a research tool, it can be right or wrong, useful or not useful (Hergenhahn, 1976). Hergenhahn offered that if the hypothesis generated is confirmed, the theory gains strength. He surmised that learning is “a relatively permanent change in behavioral potentiality that results from experience and cannot be attributed to temporary body states, induced by illness, fatigue, or drugs” (p. 9). This definition left it to the theorist to specify the kind of experience that he felt was necessary for learning to take place (Hergenhahn, 1976). This study was ground in the context of Hergenhahn’s definition, as it related to the learning theories proposed by Skinner (1953) and Gagné (1985). Behavioral Learning Theory Skinner, renowned as a behaviorist, based his theory on functionalism. Functionalists valued the use of consciousness and behavior in adjusting to the environment. These fundamentalists based their theory on Darwin’s doctrine of evolution and believed that “consciousness functions as a entity whose purpose is to allow the organism to adjust to his environment” (Hergenhahn, 1976, p. 48). With the view of a functionalist, Skinner (1953) developed his theory of learning on the concept of operant conditioning. He offered that the organism operates in the environment doing whatever it does. According to Skinner, while operating, the organism encounters stimuli to which he referred as reinforcing stimuli. As a result, the reinforcing stimuli affect the behavior occurring just before interaction with the stimuli. The operant condition then is the behavior followed by a consequence of interaction with stimuli; the nature of the consequence modifies the organism’s tendency to repeat the behavior in the future (Hergenhahn, 1976). Skinner argued that learning proceeds most effectively (a) if the
9
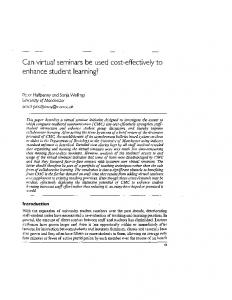
information to be learned is presented in small steps; (b) if the learner is given rapid feedback concerning the accuracy of his learning; for example, he is shown immediately after a learning experience whether he has learned the information correctly or incorrectly; and (c) if the learner is able to learn at his own pace. Cognitive Learning Theory A founding father of Cognitive Learning Theory, Gagné (1985) contended that it is more realistic to assume that there are different kinds of learning, arranged in a hierarchy, with one sort being the prerequisite for the next. For example, solving an algebraic problem depends on understanding algebraic functions, which depends on knowing basic mathematical skills and computations, which depends on recognizing simple numbers and symbols. For Gagné, simple conditioning only provided the basis for more advanced kinds of learning. He built on the behaviorist model by adding a processing or cognitive component to Skinner’s model. In his model (see Figure 1), Gagné (1985) reasoned that each individual processes information differently, based on a variety of factors including prior knowledge and innate ability and using long-term and short-term memories together to process received information in an effort to achieve a learning goal. Gagné believed that within any learning hierarchy, less complex skills are transferred positively to more complex skills (Gagné, Briggs, & Wager, 1992). Once skills are taught, these simple skills can be generalized to other situations. Therefore, Gagné believed that learning is cumulative. That is, new skills build upon prior skills to achieve higher levels of learning, and teachers through planned or directed instruction develop the learning itself intellectually. Figure 1.1 illustrates a combination of behavioral and cognitive theories. I have fully described in Chapter III the model based on these learning theories.
10
Instructional conditions that offer opportunities for teacher Student Ability
Experience
Learning Outcomes
student interactions
Learning
Behavioral Changes
Figure 1.1. Not only should teachers help students to build on skills through creating instructional conditions that offer opportunities for effective teacher inventions, but the student learning must be translated into observable behaviors--learning outcomes--that result from experience and practice.
Definition of Terms The following definitions highlight terminology that was used throughout the study: Adaptations and Accommodations refer to changes or modifications to the curriculum without sacrificing the integrity of the basic curriculum. Adaptations and accommodations can include the use of high interest materials, manipulable, hands-on materials, visual aids, technology, and timing and scheduling of tests and setting. Affect refers to the personal emotions and effects on the individual in response to his environment. Climate refers to the affective tone of the classroom environment. Teachers can establish a positive learning climate by (a) presenting smaller materials at any time; (b) guiding student practice as students work problems; (c) providing for student processing of new materials; (d) checking the understanding of all students; and (e) attempting to prevent students from developing misconceptions.
11
Cognition refers to the process of knowing or perceiving information and concepts presented in the learning environment. Differentiated instruction entails the flexible use of time and resources to engage in ongoing assessments of student readiness and interest and to pre-assess students to determine who needs more support. Inclusion is the provision of education and related services to students whose IEPs stipulate that they receive special education in the general education classroom for all or a substantial part of the day. Inclusionary is the adjectival form of inclusion, describing environments or philosophies that promote instructional placement of students with disabilities in the general education classroom. The inclusive classroom is a classroom in which the general educator, with or without a special educator, simultaneously instructs both students with and without disabilities. The term individualized education program (IEP) refers to a written statement for each child with a disability that is developed, reviewed, and revised, including (a) the child’s present levels of educational performance; (b) measurable annual goals with benchmarks or short-term objectives; (c) special education and supplementary aids and services to be provided to the child, including the program modifications or supports for school personnel; (d) an explanation of the extent, if any, to which the child will not participate with students without disabilities in the general education classroom; (e) individual modifications in the administration of state or districtwide assessments of student achievement that are needed in order for the child to participate in such assessment; (f) the projected dates for the beginning of the services and modifications; (g) the
12
transitional service needs related to the child’s courses of study; and (h) statements that describe how the child’s progress toward annual goals will be measured and how the parents will be regularly informed of the child’s progress. (IDEA, 1997) The term special education will refer to “specially designed instruction, at no cost to parents to meet the unique needs of the child with a disability, including instruction conducted in the classroom.” (IDEA, 1997) The term students with disabilities refers to children who have one or more disabilities in the categories of mental retardation, hearing impairment, speech or language impairments, emotional disturbance, orthopedic impairment, autism, traumatic brain injury, other health impairments, or specific learning disabilities. Because of their disabilities, students with disabilities require special education and related services. (IDEA, 1997) The term team teachers refers to two teachers, a general educator and a special educator, who simultaneously co-teach the same group of students during an instructional period. The verb form of team teachers is team-taught. Limitations and Delimitations In any study, certain boundaries are incorporated that limit the resultant findings. Therefore, limitations and delimitations are outlined below as a means of identifying the variables that limits the ability to apply the findings in this study to all situations. Limitations: 1. The research focused exclusively on those schools identified as performing below state expectations on end-of-course Standards of Learning tests. 2. The sample of teachers was selected from one county’s school division.
13
3. The researcher presumed that students had been placed appropriately, according to their educational needs, by a group of thoughtful people and based on IEPs, if applicable. Delimitations: 1. School administrators, based on their perception of effectiveness, selected the participants in the sample. 2. The success of teaching strategies was determined by teachers’ evaluative measures and procedures and mandated end-of-course test results. 3. The researcher characterized the inclusive classroom as a general education classroom that included students with learning disabilities. 4. Summary of the Dissertation This research study is divided into five parts. Chapter I included a description of the following: (a) the problem and its context, (b) the statement of the problem to be studied, (c) the purpose of the study, (d) the theoretical framework of the study, (e) definitions that were used throughout the study, (f) the research questions that were to be answered by the study, and (g) limitations and delimitations. Chapter II consists of a literature review of studies relative to the use of teaching strategies associated with student success in the inclusive classroom. This chapter begins with an overview of research related to mathematics teaching and learning and successful strategies used in the inclusive classroom. Subsequently, there is a review of research literature and studies related to the theoretical framework, followed by experts’ concerns about inclusive classrooms.
14
Chapter III is a discussion of the methodology used in this study. The study consists of qualitative research design, collective case studies. Included in this chapter are descriptions of the research procedures, data collection procedures, method of data analysis used to determine research findings and conclusions, and an overview of the qualitative narrative. Tables and figures used to summarize the data gathered from interviews, observations, and documents are also presented in this chapter as well as in the appendices. Chapter IV is a presentation of the findings obtained through the field observations, teacher and student focus group interviews, and a review of pertinent documents. This section of the study also contains a description of the participants and a narrative summary of the prominent domains based on data collected from the case sites. Finally, Chapter V provides a defense of the evidence presented to reveal instructional conditions and interventions used to address the needs of students with diverse abilities and needs in the inclusive classroom. This chapter includes conclusions drawn from the study, implications and recommendations for teaching practice, and recommendations for further research.
15
CHAPTER II REVIEW OF LITERATURE The purpose of this review of literature was threefold: (a) to review the complexities associated with reform initiatives in mathematics; (b) to share investigative studies of instructional conditions and interventions used in inclusive classrooms; and (c) to highlight educational issues critical to the inclusive classroom. To that end, research literature was reviewed from the early 1980s, when the National Commission on Excellence in Education’s (1983) A Nation at Risk Report introduced the idea of standards-based learning, through 2002 and the effects that Commission report has had on public education. Access to Research Databases Several key words were used to access information from research databases for the literature review for this study. The keywords that proved to be most instrumental in addressing the guiding questions (see Chapter I) were as follows: Algebra I, high school mathematics, inclusion, instructional strategies, and disabilities. Chiefly important was that selected studies included research on mathematics, preferably high school mathematics and Algebra I instruction. Next, it was necessary to review researchers who had had experience with both general education and special education services and issues, or in the inclusive classroom environment. Emphasis was placed on instructional strategies believed to produce positive student outcomes in the inclusive classroom, based on the learning theories of Skinner (1953) and Gagné (1985). Some databases yielded pertinent literature related to the selected keywords. OVID Web Gateway presented search opportunities in varied databases by simply clicking on the “Change Database” icon and then selecting a new database or database segment from the list of available databases. OVID offered searches by subject, author, title, or journal. InfoTrac, an index to
16
periodical and newspaper articles, was useful in finding information in the area of social sciences. A search in the Educational Abstracts database in OCLC FirstSearch proved to be especially helpful in locating materials in Virginia Tech’s Newman Library. Critical Issues in Mathematics Reform The Effects of Change on Teachers and Teaching Cathy Seeley, addressing the 1994 National Council of Teacher of Mathematics Annual Meeting, captured the essence of the challenge for teachers of mathematics in her following remarks: So, basically, I’m supposed to create a rich and safe environment where all students develop mathematical power by working actively together in heterogeneous groups doing meaningful and worthwhile mathematical tasks using state-of-the-art technology as an appropriate problem-solving tool at the appropriate time, to reach deeper levels of understanding than ever before, largely because of my carefully timed and well phrased probing questions, while I convince my fellow teachers that this is how they, too, should teach, and while I sell the idea that this is how it really should be to parents, taxpayers, administrators and school board members, most of whom think I should really be spending my time raising my test scores by just doing a better job of what we used to do 20 year ago, in an environment that most of them wouldn’t dare set foot into? (Middleton & Goepfert, 1996, p. vii) Seeley’s characterization of the challenge for teachers captured the fact that change in any domain is difficult, and that change in mathematics education is made more difficult with the multiplicity of interested parties making suggestions, recommendations, and mandates that teachers are expected to implement. The nature and mission of the public school has broadened.
17
Our knowledge of how students learn has deepened. The field of mathematics itself has undergone dramatic change (Middleton & Goepfert, 1996). Change is a necessary part of classroom life and the teaching profession. “Understanding the internal processes individual teachers go through as they change is critical to researchers and educators during this era of reform” (Senger, 1999, p. 199). Senger conducted a case study in one school for an entire school year wherein she examined the inner reflections and decisions in the area of mathematics reform. The participants were three intermediate-grade teachers who volunteered for the study. One participant had 20 years of experience, one had 7 years of experience, and one had 4 years of experience. Each taught mathematics differently. Senger engaged participants in systematic reflection on everyday classroom assumptions to reveal implicit beliefs that did not hold up under scrutiny and that related to the teachers’ deeper values. Through observation, reflective dialogue, and group processes, Senger found that the teachers espoused reform innovations that were not a part of their actual practice. The data that emerged as a result of constant comparative analyses were as follows: (a) growth and change require complex mental and classroom experimentation; (b) trial and adjustment are necessary elements to adapting or rejecting new mathematical ideas; and (c) time is vital to the process of change, with consistent reflection on ideas and experimentation and practice that embody those ideas. Senger noted that further study is needed, related to experimental change in teaching practice and experimental change in verbalization–reasoning and logic in mathematics class, rather than just computation. Stodolsky and Grossman (2000) used the case study approach augmented by a large sample survey to explore the dynamics of teacher adaptation to a changing student population. In this study, the researchers documented adaptations in curriculum, instruction, and assessment
18
made by mathematics and English teachers. Stodolsky and Grossman were interested in how individual teachers thought about adapting their curriculum and instruction for a changing student population; how individual teachers’ determined their pedagogical goals and beliefs; and how the subject matter contexts affected teachers’ instructional decisions. Stodolsky and Grossman studied four teachers: two English teachers and two mathematics teachers. The behaviors of the mathematics teachers in the Stodolsky and Grossman study were reviewed for the purpose of this study. Using a mathematics curriculum developed by the state of California for pre-algebra students, mathematics teachers were expected to cover a broad range of math topics thought to be helpful in preparing students for algebra and in increasing student interest and attitudes toward math. The researchers found that mathematics teachers generally considered their subject to be sequential, requiring topic coverage in a set order. Mathematics teachers also perceived mathematics as being relatively static, viewing knowledge as “cut and dry” and subject to little change (Stodolsky & Grossman, 2000, p. 129). Teachers of mathematics focused primarily on student mastery of specific content and were more likely to coordinate with colleagues so that the curriculum sequence could be preserved. As a matter of fact, the researchers found that the department to which a teacher belongs can represent one of the most important influences on professional attitudes, knowledge, and behavior. Their data also revealed that individual attributes might make it more likely that a teacher will consider using new approaches with new students or seek opportunities to learn new strategies (Stodolsky & Grossman, 2000). Johnston-Wilder, Johntson-Wilder, Pimm, and Westwell (1999), a group comprised of university and secondary teachers of mathematics, addressed the need for prospective teachers to prepare themselves for increasingly complex classroom environments. As a part of their teacher
19
preparation program development suggestions, they asked teachers to consider the following question, “Who was your best mathematics teacher?” (p. 7). Subsequently, they challenged teachers to think about what it was about that person that impressed them. Next, teachers were asked to exemplify all that was good about their own teaching, based on a specific belief. That belief was that it was the responsibility of the teacher to create an appropriate learning environment, both in terms of stimulating resources and supportive social dynamics. JohnstonWilder et al. reminded educators that children are to be treated as individuals and allowed to learn at different rates. Furthermore, they encouraged teachers to recognize and celebrate student and individual success so that records of achievement and criteria-based assessment may be well received. Celebration of student accomplishment was deemed important because research data have revealed that repeated failure and negative interactions place students at great risk for experiencing negative affect (Yasutake & Bryan, 1995). New Standards, New Students In 1994, the Algebra Working Group, established by the National Council of Teachers of Mathematics (NCTM), stated that “all students can learn algebra” and that “children can develop algebraic concepts at an early age” (NCTM, 1994, p. 5). Grounded in research and based on a set of values about developing the mathematical power of all students, the Council’s statement was one of belief and commitment (Middleton & Goepfert, 1996). To that end, the NCTM supported a comprehensive mathematics program that featured multiple strands of algebra and functions. However, Battista and Clements (2000) contended that “the development of mathematics curricula in the United States is chaotic and suffers from major methodological flaws” (p. 738). Battista, a professor at Kent State University, and Clements, a professor at the State University of New York-Buffalo, found the development of mathematics curricula to be totally disconnected
20
from research related to students’ mathematical learning processes. Instead they found curricula to be based on brainstorming sessions that included traditional “prerequisite analysis” (p. 738). As a matter of fact, the National Council of Teachers of Mathematics (1995) announced that the reform standards were designed to reflect the mathematics and pedagogy requisite for success in an increasingly complex and information-oriented society. This premise for creating standards did not include the reality in actual classrooms with knowledgeable and reflective teachers. To further exemplify the need for attention to mathematics instruction, student performance on standardized mathematics tests has indicated an area of concern for American students and educators. According to the Third International Mathematics and Science Study or TIMSS (International Association for the Evaluation of Educational Achievement, 1996), American eighth-grade and twelfth-grade students scored significantly below the international average. The reasons reported for this student performance varied. Maccini and Gagnon (2000) cited discrepancies in the nature of classroom activities and the diverse profiles of students. United States students spend 96% of their seatwork time practicing routine procedures and 1% of their time inventing new solutions, proofs, or creative procedures. Additionally, like general educators, special educators have experienced less success than hoped for in increasing basic skills achievement among students with disabilities. Ysseldyke, O’Sullivan, Thurlow, and Christenson (1989) found that students with mild disabilities constituted 90% of students with disabilities and that these students’ achievement tended to fall farther behind that of their peers over time. Yet, more students with disabilities are being educated in general education classes and exposed to the same curricula and academic expectations as their peers without disabilities. Therefore, it is important for teachers to understand how the conflicting philosophical issues inherent in the selection of the mathematics standards and the concept of education for all
21
students may significantly impact classroom practice (Johnston-Wilder et al., 1999). JohnsonWilder et al. found that teachers prepare to teach the mathematics skills that they may deem the most important priority for survival in a classroom full of students. They cautioned teachers to be cognizant of their aim and their challenge. One of the aims of education on which JohnstonWilder et al. focused was provision for the comprehensive development of the individual, with the desired outcome being a fulfilled and autonomous people who have well-developed selfawareness and who continue to grow and mature in adult life. Teachers face the challenges of responding successfully to diverse learners, building a strong professional learning community, and maintaining a conversation within schools and departments that can provide the necessary support and resources for teachers as they experiment with their teaching (Johnston-Wilder et al., 1999). Critical Issues in Teaching in the Inclusive Classroom The notion that a state can mandate changes in what happens between teachers and students in classrooms is defective at its core because it does not take into account the nature of a teacher’s teaching and learning relationships with students. . . . Reforming a relationship between teachers and children by remote control simply cannot be done. (Cuban, 1987, p. 23) Mandated teacher and student accountability programs can impact interactions between teachers and students. Prescribed curriculum and assessment standards tend to dictate the pacing and sequencing of instruction. With a focus on teacher and student accountability through standards-based curricular and assessment programs, relationships between teachers and students can move from affective to effective. This single-minded preoccupation with academic reform and accountability may negatively influence how teachers relate to students and how students
22
relate to teachers. Yet, as Cuban stated relationships between teachers and students cannot be done by remote control, or in this case by mandated curricular and assessment programs. Sowell and Zambo (1997) found that change in practice was preceded by changes within the people who used them. Their case study data revealed that compelling teachers to change their instructional strategies and practices involved complex and resource-intensive processes, and often seemed left to chance. The participants in the Sowell and Zambo study were k-12 mathematics teachers, principals, and department chairs from 135 public and 42 private schools in Arizona. The schools for their study were selected through stratified sampling from urbanrural locations and high-low socioeconomic status levels. Although participants were originally surveyed, interviews were used to provide additional information about teachers’ evaluation of content for students. High school teachers were interviewed about essential topics in Algebra I because this course was deemed a necessary step to subsequent courses and the work force. Although most of the teachers reported that they taught algebraic equations, some teachers mentioned that they taught steps for solving equations. Sowell and Zambo reported that the focus on teaching steps for mathematical problem solving by some algebra teachers might have indicated a view of mathematics as facts and rules. They found that standards-based reform had produced little reform in classrooms in the area of higher order thinking skills. The evidence of little reform grounded in higher order thinking skills in mathematics teaching and learning activities compelled researchers to propose the question, “The students are changing. Is teaching?” (Stodolsky & Grossman, 2000, p.167). The following research studies and articles address Stodolsky and Grossman’s question.
23
The Creation of a Conducive Learning Climate Teachers are key contributors to the affective nature of classroom environments. Their attitudes and perceptions are reflected in their interactions with students and may be communicated to other students, affecting peer interactions (Haager & Vaughn, 1995). Children’s experiences in school are enhanced or diminished by the affective tone of the classroom as well as by the content and organization of the classroom and instructional program (Keough, 1998). Frederico, Herrold, and Venn (1999) presented a first-person account related to Federico’s experiences as a general educator in an inclusive classroom over three years. This account detailed what Frederico learned as a result of action research. Frederico began the project by asking one of his graduate school professors, Herrold, to help him continue his professional development through action research at an elementary school in North Florida. Herrold invited Venn, one of his colleagues who had expertise in special education, to join the research group. Frederico met with his school principal and decided to keep the study low key by simply keeping a yearlong, anecdotal record of daily inclusive class experiences. The anecdotal record was supported by weekly observations and informal conferences with a team that included Frederico, a fellow teacher who was a special educator, and the two professors. As the data emerged over the three years, Frederico et al. developed a checklist for successful inclusion. The Checklist for Successful Inclusion, divided into six sections, included a section on Beliefs about Teaching Inclusion. These beliefs cited were as follows: a. Maintain a sense of humor; b. Treat the inclusive class as “Our Class,” not “My Class”; c. Become a community of inclusive learners;
24
d. Avoid labeling children in the inclusive program; e. Treat all students as equals; and f.
Use appropriate behavior management. (Frederico et al., 1999, p. 81)
Kortering and Braziel (1999) sought to gain insight into student perceptions of secondary special education programs. Choosing a rural county school district in a southeastern state, these researchers selected a sample of 52 ninth-grade students from the 1995-1996 school year for their case study. The students were enrolled in one of the four district high schools. Ninety percent of the participants were students with disabilities receiving special education services for one or more classes per semester in school. After teachers and students from neighboring schools field-tested structured interview questions, Kortering and Braziel interviewed students in the selected sample during regular school hours. Ultimately, all 52 students provided at least one general recommendation for improving schools. The suggestions for teachers included domains for having a better attitude, being more helpful, and making classes more interesting. In an article describing various characteristics that must go into a four-year secondary school curriculum designed to provide a sound mathematics background for all secondary students, Alper, Fendel, Fraser, and Resek (1997) examined the principles of designing an inclusive high school mathematics curriculum. These four authors were directors of the Interactive Mathematics Program (IMP). The challenge of meeting the call for equity and the inclusion of all students in the study of mathematics was the main emphasis of their IMP focus. Alper et al. suggested that one way to make many students feel comfortable in the classroom was to create a classroom environment with more student interaction so that students could speak openly and easily with their peers about learning activities.
25
Planning for the Inclusive Classroom Middleton and Goepfert (1996) found that teachers engaged in eight different levels of planning as they mapped out instruction for the year: daily, lesson, weekly, unit, short-range, long-range, term and yearly plans. However, they found the most important levels of planning to be unit, weekly, and daily because these are the levels that teachers should constantly adjust to pace and sequence instruction based on student needs. Defining plans as goals that teachers have for themselves and their students, Middleton, a professor at Arizona State University, and Goepfert, a seventh-grade teacher of mathematics, discovered that “most plans are done mentally, and in fact, most are mere outlines or lists of topics instead of specific objectives to be covered or mastered” (p. 59). Schumm, Vaughn, Haager, McDowell, Rothlein, and Saumell (1995) conducted a study to examine how teachers planned and made accommodations for students with special needs and to determine what some students could expect when included in the general education classroom. The study involved an in-depth analysis of 12 general educators who had been identified as effective in accommodating students with learning disabilities, based on the recommendation of the principal, confirmation by the special education teachers, and self and peer confirmation. Schumm et al. surveyed teachers about planning practices and engaged in 60 intensive classroom observations. Through the data collection, Schumm et al. gathered information that validated the anticipated experiences that students with disabilities encountered in the general education classroom, including the possibilities that a. Teachers were not likely to develop individualized lesson plans; b. Teachers were likely to employ adaptations that promote the social adjustment of students with learning disabilities;
26
c. Teachers viewed the special education teacher as a primary resource in planning for students with special needs but rarely used individualized education programs; d. Teachers would check on students’ understanding of concepts and provide adaptations to facilitate learning for the whole class; and e. Teachers at the elementary and middle school levels were more likely to revise plans for subsequent lessons, based on student performance on assignments and tests, than high school teachers were. (p. 336) Schumm et al. surmised that it was imperative to familiarize teachers with engagement and concept understanding for all students within the content area curriculum. They based this conclusion on the premise that if the instructional conditions that offer opportunities for teacher interventions developed for general educators’ use with students with learning disabilities required preplanning that could not be used with the entire class, then teachers were unlikely to be successful using effective instructional strategies. Therefore, Schumm et al. found that the development of collaborative relationships between general and special educators increases general educators’ awareness that they can provide effective services to students with disabilities. Phillips, Fuchs, Fuchs, and Hamlett (1996) employed case study methodology to identify key planning and instructional variables of teachers who differentiated instruction. These researchers observed two teachers from two separate schools who appeared to differ in promoting achievement in their students. The population from which the two teachers were selected was a pool of 20 teachers participating in an ongoing research project on curriculumbased measurement. Teacher observations were conducted independently, but concurrently. Each teacher was interviewed twice during the study, once prior to and once following the observed
27
lessons, as a means of obtaining information about the teachers’ planning and instruction. Phillips et al. found five critical variables to distinguish the planning and instruction of an effective teacher. These variables were instructional pacing and format, active student involvement, delivery of planned activities, motivational strategies and emphasis, and judgments of student learning. The data revealed that (a) instructional format should maximize students’ active cognitive engagement while minimizing the time students spend sitting passively or engaged in busy work; (b) planning should ensure that instructional activities are implemented feasibly under the time constraints of the instructional period in order for students to complete activities with a sense of closure and accomplishment; and (c) motivational delivery styles should be chosen deliberately because achievement-oriented styles can cause lower performing students to disengage from learning activities rather than risk the loss of self-esteem by failing (Phillips et al., 1996). The Use of Time in the Inclusive Classroom “Time is an important resource in school. Although it is a fixed, finite resource, time is considered to be an ‘alterable’ variable, or one over which educators have some control and influence” (Christenson, Ysseldyke, & Thurlow, 1989, p. 25). These researchers clearly defined the difference between scheduled time, allocated time, academic engaged time, and active academic responding time. Scheduled time referred to the time the teachers planned to spend in various activities. Allocated time referred to the amount of time actually devoted to various activities and tasks for the student. Academic engaged time referred to the time spent by each student making different kinds of academic responses. Active academic responding time referred to the time spent by a student making active, observable learning responses. Christenson et al. viewed allocated, academic engaged, and active academic responding times as different from
28
scheduled time in that these times denoted what actually occurred in classrooms and were measurable by direct observation. Christenson et al. deduced that without effective instruction, large increases in instructional time could produce relatively small changes in achievement. These researchers acknowledged the importance of allowing additional time to complete assignments for students with special needs and providing more opportunities for practicing new skills. Florian (1999) offered a pragmatic perspective of teachers’ assessment of the time actually required to implement standards-based education. The resulting data revealed a major flaw between theory and practice. Florian, a researcher with the Mid-continent Research for Education and Learning (McREL), completed a study entitled Teacher Survey of StandardsBased Instruction: Addressing Time for the Office of Education Research and Improvement. To complete this study, Florian recruited teachers from school districts with which McREL had a working relationship, including Colorado (1 school), Wyoming (2 schools), and North Dakota (1 school), with the purpose of estimating the amount of time required to teach standards at four grade levels as compared to time available for instruction. In this study, the researcher made the assumption that teachers had adequate knowledge of and experience with standards-based instruction and could, therefore, estimate the amount of classroom time needed to instruct students in specific content and skills. Florian also included teachers’ judgments of the importance and appropriateness of content standards for their instructional grade level. The researcher instructed teachers to make three types of judgments regarding each benchmark within a standard as they completed the survey. First, teachers estimated the amount of time in hours that it would take to teach a given benchmark to an average class of students at the grade level they taught. Second, teachers indicated to what extent they agreed that the
29
benchmark was important for students to know or do. Third, teachers indicated to what extent they thought that each benchmark was appropriate for students in each grade to know or do prior to or during this grade level. “Importance” and “appropriateness” were measured using a fourpoint scale ranging from “strongly agree” to “strongly disagree.” For each page of the survey, the teachers were asked to do the following: 1.
Complete the “Estimated time in hours” column. Provide a time estimate, in hours, for how long it would take you to teach each standard’s benchmarks to a class of average students at the grade level you currently teach. By this, we mean how much class time you would need to devote to the skill or knowledge contained in the benchmark until a class of average students at the grade level you teach would master that skill or knowledge.
2.
Fill out the column headed “I think this is important for students in this grade to know/do.” On a four-point scale (where the four choices correspond to Strongly Disagree, Disagree, Agree, and Strongly Agree), indicate the degree to which you agree that a benchmark is important for students at the grade level you teach to know.
3.
Fill out the column headed “I think this is appropriate for students in this grade to learn.” On a four-point scale, indicate the degree to which you agree with this statement for each benchmark.
4.
In addition to these responses, please feel free to edit the content of the benchmark to what you, as a teacher, believe is appropriate. Editing benchmarks is an optional part of this survey. (p. 21)
30
The results of Florian’s data analyses suggested that an average of 1100 hours of instructional time were needed at each grade level to address the standards in four domains: language arts, civics, mathematics, and science. Thus, this finding suggested that teachers did not have enough time to teach all standards and benchmarks. Florian concluded that teachers were given less than the needed time to teach each standard and, consequently, may have omitted teaching some standards or benchmarks that they deemed less important or less appropriate to their grade level of instruction. Florian cautioned that omitting a benchmark judged “not appropriate” may have been compounded by low teacher expectations for students. She found that teachers’ effective use of available instructional time was inhibited because standards-based instruction took much more time than was available. Nevertheless, Florian concluded that adding academic time to classrooms where time was not well utilized did not produce gains in student achievement. The Use of Adaptations and Accommodations One aspect of helping students with disabilities become successful in an integrated class setting is the use of instructional adaptation that facilitates student learning (Friend & Bursuck, 1996). Instructional adaptations have been characterized as the process of choosing and applying appropriate teaching action after student assessment has revealed a lack of student success. However, when Vaughn and Schumm (1994) looked for evidence of planned accommodations for students with disabilities among secondary educators, they found that specific learning outcomes for either students with or without disabilities to be a low priority for observed teachers. Secondary educators reported a desire to initiate more accommodations but did not feel equipped to do so.
31
Teacher-Directed Instruction Keel, Dangel, and Owens (1999) discussed inclusive intervention strategies, providing a rationale for each, in their article based on selecting instructional interventions for students with disabilities in the inclusive classroom. They found that teacher-directed interventions could be implemented with the whole class or in small groups. Defining direct instruction as a system of teaching with a range of students, Keel et al. included such strategies as immediate feedback, practice, and gradual fading from teacher direction. For mathematics in particular, they suggested that after the teacher has determined the instructional objectives, the teacher should immediately determine the prerequisite skills necessary to meet the stated objectives. Then the skills should be sequenced so that pre-skills are taught prior to the strategy, introducing easier skills before introducing more difficult skills. Keel et al. cautioned that skills and information that may be confused should not be presented consecutively. Peer Groups Alper, Fendel, Fraser, and Resek (1997) began their work with the belief that a secondary mathematics curriculum could be developed that would teach needed skills as well as develop mathematical power, and would still be successful with a full range of students. In the Interactive Mathematics Program (IMP) curriculum, these authors introduced new ideas as concretely as possible. However, the IMP staff incorporated challenging problems within the concrete work for students who may have already known the basic skill. The Program also required teachers to use heterogeneous groups so that each student could hone and add personal strengths to problem solving. These mathematicians suggested that having students work in groups allowed them to pool their strategies and develop their own problem-solving procedures.
32
Vaughn, Schumm, Klingner, and Saumell (1995) conducted individualized interviews with middle- and high-school students to better understand their perceptions of teachers’ adaptations to meet the special learning needs of diverse students in the general education classroom. They examined the responses of students with learning disabilities, students with English as their second language, low-achieving, average-achieving, and high-achieving students. Vaughn et al. found that most students were anxious to receive assistance from their peers, although preferences for group patterns varied. To that end, Vaughn et al. suggested that grouping practices need to reflect students’ learning styles and that teachers must consider using student pairing as well as small teacher-selected groups. Furthermore, they concluded that teachers needed to consider the learning needs of all students, including high and low achievers, in grouping practices. Vaughn et al. shared that they particularly believed that considering one form of grouping, homogeneous or heterogeneous, best practice for all students to be in contrast with students’ experiences. The students wanted variety (Vaughn et al., 1995). Pacing and Sequencing In examining students’ perceptions of instructional practices in the inclusive classroom, Vaughn, Schumm, Klingner, and Saumell (1995) found that approximately 91% of the students who participated in their study felt that teachers should slow down or change lessons when some students did not understand the lesson content. The students believed changing the pacing or sequencing of instruction facilitated their learning. Middleton and Goepfert (1996) cautioned teachers to keep in mind that although planning is essential to establishing a focused, interactive learning process, “nothing ever goes exactly as planned” (p. 58). Students can come to a standstill on ideas and skills that teachers may assume
33
students should know. These researchers urged teachers to abandon the lesson plans when activity flow is threatened and rely on their information about the students’ prior knowledge. Student Outcomes Outcomes are defined in dictionaries as results, effects or consequences of events, processes, or experiences. Schleisman and King (1990) found the following definitions of outcomes through their research: (a) products of a curriculum, a structured series of intended learning outcomes and (b) end products of learning that result in changes in student behavior. Ysseldyke, Thurlow, Bruininks, Deno, McGrew, and Shriner (1991) defined an outcome as the result of interactions between individuals and the schooling experience, citing three key terms as a part of their definition: educational experiences, interactions, and results. Educational experiences were described as the learning experiences that were planned, managed, or organized by schools to serve children. Interactions were described as the products of recurring interaction between the individual and school experiences, influenced by the individual’s life experiences. Results were described as the effects of learning experiences such as achievement, graduation, and dropout rate. Although outcomes of education became a significant concern of educational reform during the 1980s, Ysseldyke, Thurlow, and Bruininks (1992) discovered that general education policy was being established with limited recognition of students receiving special education services. Furthermore, Ysseldyke’s (1992) perusal of general education outcomes suggested that “the primary focus was on students bound for post-secondary education, particularly college. Yet only half of America’s students proceed to college” (p. 238). Even though they found the language of reform policies stressed a need to concentrate on the quality of educational experiences for students with disabilities, Ysseldyke et al. (1992) posed the question, “Should we
34
measure outcomes in the same domain for all students with disabilities, no matter how severe their disabilities?” (p. 28). Researchers with the National Center for Educational Restructuring and Inclusion (1995) completed a national study of school districts that resulted in evidence that students with disabilities were making academic gains. These gains included improved performance on standardized tests and mastery of IEP goals as well as improved grades, on-task behavior, and motivation to learn. On the other hand, data from the United States Department of Education (1995) revealed that many secondary students with disabilities, especially in ninth and tenth grades, experienced high rates of failure. In relation to students without disabilities, Hunt, Staub, Alwell, and Goetz (1994) used a pre-test/post-test design to compare the mathematics achievement of ten students without disabilities participating in cooperative learning groups with classmates with disabilities to a group of students without disabilities who worked in cooperative learning groups with classmates without disabilities. They found that both groups increased their mastery of targeted mathematics objectives. Students with disabilities performed as well as the students without disabilities in the control group. This study, focused primarily on the performance of students with disabilities, might indicate an instructional strategy that warrants further investigation for the inclusive classroom. Christenson, Ysseldyke, and Thurlow (1989) identified nine factors deemed critical for student achievement. These researchers concluded that instructional outcomes for students were enhanced when 1.
Classrooms were managed effectively.
2.
There was a sense of positiveness in the school environment.
35
3.
There was an appropriate instructional match.
4.
Goals were clear, expectations were explicitly communicated, and lessons were presented clearly.
5.
Students received good instructional support.
6.
Sufficient time was allocated to instruction.
7.
Opportunity to respond was high.
8.
Teachers actively monitored student progress and understanding.
9.
Student performance was evaluated appropriately and frequently. (pp. 21-31)
Ysseldyke (1992) suggested that educators must form hypotheses for what will work with students, teach in accordance with those hypotheses, and continually evaluate the effectiveness of the intervention. Ysseldyke found that “[e]ffective teachers believed that student success and failure depended on what happened in the classroom” (p. 231). The evolution toward inclusion has created an emphasis on educating students with disabilities in general education classrooms (Salend & Duhaney, 1999). Inclusive schools seek to establish communities of learners by educating all students together in age-appropriate, general education classrooms in their neighborhood schools. Although the inclusion movement has focused on individuals with disabilities, it is designed to alter philosophy for educating all students (Ferguson, 1996). Figure 2.1 illustrates the instructional conditions and interventions that emerged from this review of the research literature emphasize the most effective domains for enhancing student achievement in the inclusive classroom.
36
Domains
The Establishment of Classroom Climate The Use of Planning Student Outcomes
The Use of Time
The Use of Adaptations and Accommodations
Figure 2.1. This figure contains four domains that emerged from the research literature as effective teaching instructional conditions or interventions that enhanced student achievement in the inclusive classroom. Concerns about Inclusion Special education advocates include two groups: full-inclusionists and inclusionists. Fullinclusionists support full inclusion of students with disabilities into the general education program while inclusionists support a continuum of placement or services for students with disabilities. In their article entitled “Constructive Tension and the Potential for Reflective Reform,” Ferguson and Ferguson (1998), both university professors, examined the polarization between advocates for and those opposed to inclusion for all. Advocates of full inclusion, Ferguson and Ferguson suggested that polarization resulting from self-contained special education classes for students with disabilities served to highlight the disconnect between what is being said and what is being done. These authors focused on two tensions that they considered
37
fundamental to the debate about inclusion: the tension of time and the tension of difference. Proponents of full inclusion ground their advocacy in a long history of the exclusion and marginalization of students with disabilities, or the amount of time that students with disabilities were denied access to programs. Full-inclusionists view as paramount the social relationships that students with disabilities form in the inclusive environment as well as the civil rights of students with disabilities. Yet, standards-based educational reform underscores the question as to whether educators should emphasize the differences or the similarities between students with disabilities and their peers without disabilities. Ferguson and Ferguson asked, “Does ‘standard’ mean standardization in the sense of every student accomplishing exactly the same learning to the same picture of mastery, performance or other measurement? If so, how can a standard accommodate all students?” (pp. 301-307). On the other hand, inclusionists believe that inclusion revolves around evidence of academic achievement (Manset & Semmel, 1997). Fuchs and Fuchs (1998), both professors of special education at Peabody College of Vanderbilt University and former teachers of young children with and without disabilities, used two beliefs to guide their work as practitioners and researchers: support for teachers who teach children with special needs and support of the inclusion of children with special needs in general education programs. Inclusionists believe that general educators and special educators should help students with special needs learn important skills, knowledge, and self-control that will facilitate graduation from high school or college and help them get a good job. Such achievements, inclusionists argue, depend on the regular classroom and a continuum of special education placements. Inclusionists, however, recognize that there is a limit on what one can realistically expect in the inclusive setting and believe that “special education’s effectiveness should be defined primarily in terms of student outcomes and
38
moving students ‘up’ the continuum into regular classrooms” (Fuchs & Fuchs, 1998, p. 315). These researchers concluded that most special educators might be considered “inclusionists,” advocating for the placement of students with disabilities in the least restrictive appropriate environment. Nevertheless, Fuchs and Fuchs shared that they were well aware that fullinclusionists advocate for the instructional placement of all students, especially students with severe disabilities, in regular classes primarily for social benefits. They underscored the fact that full-inclusionists believed that educators’ primary responsibility for students with disabilities is to help them establish friendships with non-disabled peers in an effort to change stereotypical thinking about disabilities and help students with disabilities develop social skills. Fuchs and Fuchs surmised that full-inclusionists supposed that all things were possible. In a research article related to program design for students with disabilities, Smith and Dowdy (1998) found that how students with disabilities were placed and what curricular approach was used varied from school to school and classroom-to-classroom. Smith, a professor and associate dean at the University of Arkansas at Little Rock, and Dowdy, an associate professor at the University of Alabama at Birmingham, noted that special services for students with disabilities have expanded significantly since the passage of Public Law 94-142 in 1975, and it subsequent reauthorizations including IDEA 1990 and 1997. Smith and Dowdy also pointed out that how students are placed and what curricular approach is used varied considerably from school to school and classroom to classroom. “The trend has favored increased inclusion of all children with disabilities in general education settings” (p. 317). These researchers identified several factors affecting educational programs for students with disabilities, including philosophy of the special education program, state mandates, and the orientation of individual teachers and administrators. Smith and Dowdy suggested that
39
educational programs for students with disabilities be based on individual needs rather than clinical labels or philosophical issues. They based their beliefs on the words of Byrnes (1990): “Our challenge is to identify the environment and program that work best for each child – ideally for all children” (p. 348). Crockett (1999) clarified the legal principles and educational strategies that guide placement alternatives for students with disabilities. Arguing that least restrictive environment (LRE) included a continuum of services based on individual needs, Crockett urged readers to implement IDEA with integrity. To that end, the researcher offered five prominent domains to educators charged with making decisions about IEPs for students with disabilities. The following domains emerged from Crockett’s historical review of the origins and implementations of LRE: 1. Make ethical and legally defensible decisions; 2. Focus on individuality and exceptionality in learning; 3. Provide equity under the law; 4. Ensure effective programming; and 5. Establish productive partnerships. Regardless of the differentiated philosophies related to inclusion, the responsibility for instructing students with disabilities in the inclusive classroom is the critical issue (Ysseldyke, 1992). Teachers’ responses to inclusive programs are shaped by a variety of variables and change over time. These variables include their success in implementing inclusion, student characteristics, the availability of resources, instructional and ancillary supportive services, and time to collaborate and communicate with others (Salend & Duhaney, 1999).
40
Ensuring a Free Appropriate Public Education Whether special and general education can successfully merge and generate the resources to support individualized services for students at risk of failure, including students with disabilities, is problematic (Huefner, 1997). Nevertheless, the primary mandate of IDEA is the provision of a free appropriate public education for all students. The term “free appropriate public education” refers to special education and related services that (A) have been provided at public expense, under public supervision and direction, and without charge; (B) meet the standards of the State educational agency; (C) include an appropriate preschool, elementary, or secondary school education in the State involved; and (D) are provided in conformity with the individualized education program required under section 614(d). (IDEA, 1997) In summary, decisions guiding effective inclusion should be driven by individual student needs and then continuously assessed and monitored. A shared sense of vision among general educators and special educators is important for securing and maintaining support necessary for program success. However, the term “appropriate” mandates a continuum of services that meets the academic and social needs of students. “Some of the current reform thrusts seem to presume that one place and a generic disability label is best for students. May not such a presumption devalue the complexity of individual needs and actually undermine these needs?” (Huefner, 1997, pp. 361-2). This study presents a qualitative research study that explores whether or not teaching strategies and practices in the Algebra I classroom can effectively address the needs of
41
individual students and affect positive performance outcomes for students with and without disabilities. Structuring the Study The theoretical approach (see Figure 1.1, p. 11) that guided this literature review was based on the research questions stated in Chapter I. Consequently, this case study was structured around the literature review in this chapter, through the use of field observations and interviews. Areas of focus in the literature related to instructional conditions that offer opportunities for effective teacher interventions that may enhance student achievement and performance outcomes. The prominent domains addressed in this literature review that will be used in the present study include the following: the establishment of classroom climate (Alper, Fendel, Fraser, & Resek, 1997; Frederico, Herrold, & Venn, 1999; Haager &Vaughn, 1995; Keough, 1998; Kortering & Brazil, 1999), the use of planning (Meddleton & Goepfert, 1996; Phillips, Fuchs, Fuchs, & Hamlett, 1996; Schumm, Vaughn, Haager, McDowell, Rothlein, & Saumell, 1995), the use of time (Christensen, Ysseldyke, & Thurlow, 1989; Florian, 1999), and the use of adaptations and accommodations (Alper, Fendel, Fraser, & Resek, 1997; Friend & Bursuck, 1996; Keel, Dangel, & Owens, 1999; Meddleton & Goepfert, 1996; Vaughn & Schumm, 1994; Vaughn, Schumm, Klingner & Saumell, 1995). The research revealed that to influence student outcomes, educators should continually evaluate the effectiveness of the instructional conditions that offer opportunities for teacher and strategies used in teaching and learning (Christenson, Ysseldyke, & Thurlow, 1989; Hunt, Staub, Alwell, & Goetz, 1994; Salend & Duhaney, 1999; Schleisman & King, 1990; United States Department of Education, 1995; Ysseldyke, 1992; Ysseldyke, Thurlow, & Bruininks, 1992; Ysseldyke, Thurlow, Bruininks, Deno, McGrew, & Shriner, 1991).
42
CHAPTER III METHODOLOGY This chapter discusses the methodology used in this study. The results were based on qualitative research design, specifically collective case studies. Included in Chapter III are descriptions of the research procedures, data collection procedures, and method of data analysis used to determine research findings and conclusions. Tables and figures used to summarize the data gathered from interviews, observations, and documents are also presented in this chapter as well as in the appendices. According to Vaughn, Schumm, Klinger, and Saumell (1995), the student’s voice is important in highlighting the implications for inclusion (see Chapter II). What most interested me about this Vaughn et al. report was that the researchers presented the implications for inclusion from the students’ points of view. Using structured questions, these researchers examined middle- and high-school students’ perceptions of teacher adaptations to meet the special learning needs of students in the general education classroom. Students included in the study represented low achievers, average achievers, high achievers, students with learning disabilities, and English Speakers of Other Languages. Vaughn et al. found that the success of the inclusive classroom centered on teachers’ incorporating strategies and practices that were helpful to all students in the teaching-learning environment. Central to this discussion is what educators should do to address individual needs of students in the inclusive environment. Researchers have suggested that decisions guiding teaching and learning in the inclusive classroom should be driven by individual student needs and then continuously assessed and monitored. Research findings have revealed the need for a shared sense of vision among general and special educators in order to secure and maintain the
43
support necessary for developing successful teaching and learning models. Additionally, small class sizes and teacher training in the area of inclusive teaching and learning have been found to affect the efficacy of teaching students with disabilities in the inclusive classroom. Purpose of the Study The purpose of this study was to examine how strategies and practices used by teachers in the inclusive Algebra I classroom influenced student performance outcomes. Virginia high school students who began their freshman year of high school in fiscal year 2000 and wished to earn a standard or an advanced diploma faced new mathematics requirements for high school graduation. The new requirements included passing an Algebra I course and SOL end-of-course test. The Virginia mandate was supported by the National Council of Teachers of Mathematics who purported as early as 1994 that “all students can learn algebra” (NCTM, 1994, p. 5). The qualitative research method of case study proved to be an appropriate research design for exploring aspects of teaching and learning. Through the use of case study methodology, complex casual links during real-life instructional conditions that offered opportunities for effective teacher interventions were explained, real-life contexts in which the instructional conditions that offered opportunities for effective teacher interventions were described, specific instructional conditions that offered opportunities for teachers to enhance student achievement were documented, and situations in which instructional conditions that offered opportunities for effective teacher interventions being assessed had no clear set of outcomes were explored (Yin, 1994). Theoretical Framework The theoretical framework for this study was grounded in two theories of learning. It includes elements of both behavioral and cognitive theories based on the integration of Skinner’s
44
(1953) theory of operant conditioning and Gagné’s (1985) theory of cognitive conditions that affect learning outcomes (see Chapter I). To that end, the framework suggests that although cognitive theory focuses on building on skill acquisition, learning must also be translated into observable behaviors that result from experience and practice in which students engage in the learning environment. Five domains are cited in the theoretical framework. Four domains relate to effective instructional conditions and interventions for the inclusive classroom that were prevalent in the literature review (see Figure 2.1, p.37). Many researchers in the field of general and special education found the following to influence student success: the establishment of a classroom climate that is conducive to learning, the use of planning, the use of time, and the use of adaptations and accommodations. The theoretical framework portrayed in Figure 3.1 combines a portrait of how theoretical beliefs combined with instructional conditions and teaching interventions can affect student achievement. The framework also includes a fifth domain to allow for study participants' reflective feedback concerning factors both inside and outside of the school environment that affect student learning. Research Questions Research questions were based on the theoretical framework. The fundamental question directing this study was: What strategies and practices do teachers use in the inclusive classroom to enhance achievement for students with diverse academic abilities and needs? Sub-questions for this study included: (a) What do teachers do to create instructional conditions that offer opportunities for them to provide effective teaching interventions for students with diverse academic abilities and needs? (b) How do general educators and special educators plan for the
45
DOMAINS The Establishment of Classroom Climate The Use of Planning Desired Learning Outcomes
The Use of Time
Student Outcomes
The Use of Adaptations and Accommodations
The Effect of Other Influences: (a) Teacher Training (b) Student Behaviors (c) Student Placement
Figure 3.1. Combining behavioral and cognitive theories from Skinner (1953) and Gagné (1985) with prominent domains from the research literature, this model constitutes a holistic approach to effecting successful student outcomes in the Algebra I inclusive classroom.
46
inclusive classroom? (c) How do teachers use allotted time to maximize teaching and learning capabilities for the instructional period? (d) What adaptations or accommodations do teachers use to differentiate teaching and learning activities to meet diverse student needs? (e) How are students performing in the inclusive classroom? Implication of the Study Crockett and Kauffman (1998) observed that of the 2.5 million students with learning disabilities receiving services in the United States as early as 1994-95, 39% of those students spent 80% of their instructional time in the general education classroom. “Frequently, it is the performance of these students in the general education setting that calls for a special instructional response” (p. 492). To that end, this study provides an examination of teachers whom administrators deemed successful in providing strategies and practices that enhanced student achievement and performance in the inclusive classroom. It offers a comparative analysis of triangulated data (observations, interviews, and pertinent documents) provided from three separate case studies. At each case site, teachers were observed as they made efforts to meet the demands of implementing a mandated Algebra I curriculum and assessment program. This report incorporates a multi-case descriptive case study that will provide educators with a view of strategies, practices, and perceptions of teachers and students in classrooms serving students with diverse academic abilities. Procedures The following sections describe the design of the study, data collection procedures, and data analysis procedures. This study was based on a qualitative design using descriptive case study methodology. Detailed procedures delineated in the proposal of the study indicated the initial structure to the process. Data were collected for cross-case data analysis. Procedures for
47
interviews and field observations were based on Merriam’s (1998) guidelines for collective or cross-case method of case study. Merriam pointed to Miles and Huberman (1994) who found that “by looking at a range of similar cases, we can understand a single-case finding, grounding it by specifying how and where and, if possible, why it carries on as it does, we can strengthen the precision, the validity, and the stability of the findings” (p. 29). Assumptions and Rationale for a Qualitative Design The use of a qualitative research design, specifically the collective method of case study, resulted in a descriptive study of teaching and learning. This type of design enabled me to distinguish between explanation and understanding as a purpose of inquiry, to distinguish between a personal and impersonal role for me as the researcher, and to maximize what was learned (Stake, 1995). The empathetic nature of case study methodology allowed me to develop a thorough description of the classroom experiences, findings, and conclusions about strategies, practices, and perceptions of Algebra I inclusive classrooms. The cases for this study included professionals and students in their classroom environments. The Type of Design The collective or cross-case study methodology provided a means of gathering data to consider teaching strategies and practices in inclusive classrooms. In this comparative case study, there were two stages of analysis: the with-in case analysis and the cross-case analysis (Merriam, 1998). Within-case analysis entailed gathering data to get a comprehensive picture about the contextual variables that impacted each case. After analysis of each individual case was completed, cross-case analysis began. Cross-case analysis included comparing data from each case to find patterns in processes and outcomes that occurred across the cases, to understand how cases were qualified by contextual conditions, and to develop refined descriptions and powerful
48
explanations (Miles & Huberman, 1994). This cross-case analysis provided a view of teachers in a suburban school district, teaching high school students in inclusive Algebra I classrooms. The Researcher’s Role A qualitative researcher must have three skills: “tolerance for ambiguity, sensitivity, and communication skills” (Merriam, 1998, p. 24). In addition to being able to tolerate ambiguity and behave as a sensitive observer, being a good communicator and a good listener was a necessity. Merriam stated that “[t]he good qualitative researcher looks and listens everywhere” (p. 23). However, I also discovered that an important part of communication in qualitative research is one’s ability to write and to understand the writing process because there is an enormous amount of writing in this type of research. My educational and professional experiences contributed to my choice of qualitative research. Having been a secondary English teacher and department chairperson before becoming a high school administrator, I had experience in writing curriculum and facilitating curriculumassessment alignment. During my tenure as a teacher, I acquired supervisory skills as a peer observer participating in the Teacher Performance and Evaluation Program in the same suburban school district in which this study was completed. As a peer observer, I observed teachers in assigned classrooms across the school district, scripted “literal and copious” notes, and wrote observation reports based on the school district’s standards of performance for teachers. These reports were reviewed by curriculum specialists, revised, and then given to the teachers’ evaluators. Subsequently, as a high school assistant principal responsible for teacher recruitment, supervision, and evaluation, I became aware of the need to enhance my knowledge and expertise in the area of leadership. Consequently, I began a doctoral program in Educational Leadership
49
and Policy Studies. Then as an area administrator responsible for monitoring student achievement, I worked with approximately 25 schools, K-12, on closing the achievement gap between majority and minority students. This area office experience afforded me the opportunity to work with many educators engaged in creative and productive teaching and learning models. When I began this study, I was a high school principal faced with facilitating teachers as they prepared both general education students and students with disabilities to meet state-mandated end-of-course requirements for high school graduation. My work experience provided me with the skills and opportunity to complete a qualitative study. The methods of data collection, interviews, field observations, and document analysis were areas in which I had had previous professional experience and guidance. My ability to tolerate ambiguity, to be sensitive to the needs of students and staff, and to communicate effectively was enhanced by years of beneficial professional practice. Consequently, the tasks of gaining access and entry into the research sites, interviewing teachers and students, recording observations within the teaching and learning environment, and engaging in collaborative conversations related to data results were research skills with which I was at ease. Gaining Access and Entry There were several steps to gaining access and entry to the case sites used in this study. “Gaining entry into a site [began] with gaining the confidence and permission of those who [could] approve the activity” (Merriam, 1998, p. 98). First, a research proposal for the study was submitted for approval to the university’s Internal Review Board and then the school district’s review board. After receiving approval to proceed, gaining entry to the case sites “[was] more easily accomplished through mutual contact[s] who [could] recommend [me] to the gatekeepers
50
involved” (p. 99). I discussed my research proposal with five colleague principals at high school principals meetings. Three of the five were amenable to proposing the research idea to their staff. Once the principals discussed the research proposal with their staff and agreed to participate in the study, I gave each principal a copy of teacher and student consent forms which summarized the elements of the study. Later we discussed the method of selecting teacher participants. Setting Selection Selecting the specific setting or case was a critical first step. As a high school principal accountable for facilitating teacher and student compliance with state-mandated course and graduation requirements, I found one of the most challenging academic settings for teachers and students to be the inclusive Algebra I classroom. The need to determine what was happening and what needed to happen in inclusive Algebra I classrooms to enhance student achievement and outcomes was a high priority for our staff. With this challenge in mind, the settings for this study were selected, three Algebra I classrooms serving students with diverse academic abilities. The selected school district used for this study was the one in which I served as an administrator. This district, located in a suburban county in the northern part of Virginia, had many positive attributes. Almost one-half of the adult population held a college degree. With curricula ranging from traditional to innovative and providing a vast continuum of services for students, the county’s public school system had been acclaimed as one of the best in the United States. A more comprehensive description of the county and school district will be presented in Chapter IV. Three individual case sites were chosen based on demographic similarities and a focus on improved achievement for populations with diverse needs. In 1998, the state developed the Standards of Learning (SOL) program, including curricular standards and assessments for
51
specific courses. This state-mandated assessment program required students to earn a 70% pass rate, or a minimum scale score of 400 points, on specified end-of-course tests in order to fulfill course and graduation requirements. In an effort to support its low-performing schools, the school district designated some schools as EXCEL schools. EXCEL schools were designated as such based on overall student performance on the 1999 Virginia Standards of Learning end-ofcourse tests. The EXCEL schools had some of the lowest SOL test scores in the school district and were deemed “Accredited with Warning” by the state. As a result of their EXCEL status, the schools were given extra resources that would enable faculty and staff to incorporate flexible scheduling, more staff development and training, and creative instructional initiatives to enhance student achievement. Of the four principals at EXCEL schools, two seemed agreeable to participating in the study. Therefore, I approached a principal of a high school with demographics similar to the two EXCEL schools. This non-EXCEL school was geographically located less than five miles from one of the EXCEL schools that participated in this study, and had failing results on as many SOL end-of-course tests as the other EXCEL school included in this study. For future reference, the three case sites will be referred to as School One, School Two, and School Three. Participant Selection Patton (1990) maintained that selecting information-rich cases for in-depth study is vital. “Information-rich cases are those from which one can learn a great deal about the issues of central importance to the purpose of the research” (p. 169). Merriam (1998) suggested that “if your interest is in programs that are successful in addressing learning disabilities, you would establish criteria for what constitutes a successful program and select a program that meets those criteria” (p. 65). Therefore, I first established the criteria that guided the case selection based on
52
issues confronting students and teachers in the selected school district. The criteria included overall student achievement for both general education students and students with disabilities, student performance on end-of-course tests, and teaching strategies and practices used in the inclusive classroom. Principals, assistant principals, and department chairpersons at each case site were instrumental in recommending teacher participants. A team at each site collaboratively identified Algebra I teachers in inclusive classrooms whom they deemed effective in using strategies and practices that enhanced student achievement and performance. After receiving referrals from each site, I simply selected a designated teacher from each site who team-taught in an inclusive classroom as either a general or special educator. Focusing on the member of each pair of teamteachers who was deemed effective by the administrative staff, the designated teacher participants selected for the study included two general educators and one special educator and their team-teachers. Participants had to have active roles in the data collection process. Teachers who teamtaught in the inclusive Algebra I participated in discussions and interviews. Administrators and teachers agreed to field observations. Students contributed through focus-group interviews, after designated teachers had secured signed parent-student consent forms. Designated teachers and administrators collected and provided needed documents. Consequently, students in these teachers’ inclusive classrooms were also participants in this study. Assurance of Confidentiality Because this study included human subjects, including minor children, the assurance of confidentiality for participants was mandatory. Therefore, consent forms approved by both the university’s Internal Review Board and the selected school district’s review board had to be
53
signed by teachers and students and students’ parents or legal guardians. The signed consent forms provided contractual agreements for confidentiality among participants. Only the interviews were audio-taped, with tape recorders being placed in plain view for all participants to see. Although individual teachers and members of student focus groups were audio-taped, teacher and student anonymity were maintained. There was no videotaping. I personally scripted and transcribed field observation notes, and taped interviews were transcribed by a bonded vendor. All records with names of students, audiotapes, and transcripts were destroyed as soon as the study had been verified and approved by the dissertation committee. Surnames of teachers and all names of students and schools were omitted in the final report. Throughout the report, case sites are referred to as Schools One, Two, or Three; teachers by their given names only; student focus groups as Focus Groups One, Two, or Three; and student class members by assigned numbers. General education students and students with disabilities were distinguished in tables of class rosters (see Appendices F-H) by placing a subscripted letter by the names of students with disabilities. The school district’s criteria for identifying students with learning disabilities were as follows. Specific learning disability was described as a disorder in one or more of the basic psychological processes involved in understanding or in using language, spoken or written, that may manifest itself in an imperfect ability to listen, think, speak, read, write, spell or to do mathematical calculations, including conditions such as perceptual disabilities, brain injury, minimal brain injury, minimal brain dysfunction, dyslexia, and developmental aphasia. The term did not include learning problems that were primarily the result of visual, hearing, or motor disabilities; or of mental retardation, emotional disturbance, environmental, cultural, or economic
54
disadvantage. An eligibility committee could determine that a child had a specific learning disability if: 1. The child did not achieve commensurate with age and ability levels in one or more of the areas listed below when provided with learning experiences appropriate for the child’s age and ability levels; and 2. The child demonstrated a severe discrepancy between intellectual ability and achievement in one or more of the following areas: (a) oral expression, (b) listening comprehension, (c) written expression, (d) basic reading skills, (e) reading comprehension, (f) mathematics calculation, and (g) mathematics reasoning. A student with a specific learning disability who required special education had to meet all of the following criteria: 1. The student had had learning experiences appropriate for age and ability levels. 2. The student demonstrated a disorder in one or more of the basic psychological processes (processing deficit) involved in understanding or in using language, spoken or written. 3. The student was not achieving commensurate with age level and demonstrated a severe discrepancy between ability and achievement. 4. The eligibility committee considered the following exclusionary factors and ruled them out as the designated cause of the severe discrepancy: visual, hearing, or motor impairment; mental retardation; emotional disability; environmental, cultural, or economic disadvantage; and lack of instruction in reading and math or limited English proficiency.
55
5. The eligibility committee considered the relevant behavior noted during the observation of the child and the relationship of that behavior to the child’s academic functioning. The committee had to describe these behaviors. 6. The eligibility committee considered any educationally relevant medical findings. The committee had to describe these findings. 7. The student required instruction in the area(s) of underachievement that could not reasonably be provided solely through regular education. The committee had to specify why (from Parent Handbook for the selected school district, August 2002). Data Collection Procedures Data were gathered from three separate schools from the same suburban school district. The number of sites for data collection and the types of data collected were determined based on the demographic criteria established for selecting the samples and “reasonable coverage of the phenomenon given the purpose of the study” (Patton, 1990, p. 186). Data collection was conducted during six to seven visits to each case site and via electronic mail and telephone conversations. The amount of time spent in each school was bounded by teacher-student daily schedules and the time needed to collect data and corroborate findings and analyses through member checks. Means of Collecting Data: Instrument Construction Data were collected at each site in the form of interviews, observations, and documents. Based on the theoretical framework (see Figure 3.1, p. 46) developed for this study, data type was selected as a means for determining theories in practice in the inclusive Algebra I classroom. Although cognitive theory focuses on building on skill acquisition, learning must be also be translated into observable behaviors that result from experience and practice in the teaching and
56
learning environment (Gagné, 1985). The literature review in Chapter II revealed four domains for effective teaching in the inclusive classroom: climate, planning, time, and adaptations and accommodations. The three methods of data collection yielded information needed to examine interactions in the classroom environments and to gauge individual perceptions of teaching and learning. Patton (1990) reasoned that Multiple sources of information are sought and used because no single source of information can be trusted to provide a comprehensive perspective. . . . By using a combination of observations, interviewing and document analysis, the fieldworker is able to use different data sources to validate cross-check findings. (p. 244) Patton characterized on-site investigation cases as observing what is going on, talking to people, and examining documents. These methods of data collection proved to be beneficial in the case study process. The process used for data collection in this study is illustrated in Figure 3.2. Teacher Discussions Discussions and visits with teachers formed a basis for clarifying the purpose, procedures, and significance of the study. Discussions provided clarifications of data assessments and enabled collaboration with teachers regarding the level of student participation in the study. “One of two methods of data collection predominate; the other(s) play a supporting role in gaining an in-depth understanding of the case” (Merriam, 1998, p. 137). Although interviews, field observations, and documents provided data needed for triangulated comparisons, discussions with teachers provided an in-depth understanding and context of the study.
57
The Data Collection and Analysis Process
Teacher Discussions: Building relationships, discussing the demographics of the classes to be observed, and selecting student focus groups.
Teacher Interviews: Teacher perceptions of strategies and practices used in the inclusive classroom.
Field Observations: Strategies, practices, and interactions observed in the inclusive classroom.
Student FocusGroup Interviews: Student perceptions of strategies and practices used in the inclusive classroom.
Member Checks: Teacher review of and feedback on data results related to quantitative results.
Data Analysis: Prominent domains resulting from qualitative data and review of quantitative data: teacher grades and end-of-course test results.
Figure 3.2: Three forms of qualitative data were triangulated to assess the influence of teaching strategies and practices on the performance of students with diverse academic abilities in the inclusive Algebra I classroom. Teacher discussions and member checks strengthened the accuracy of the data summaries and analyses.
58
Interviews Interviews offered a view of teacher and student insights into the case environments. “We interview people to find out from them those things we cannot directly observe. . . . We cannot observe feelings, thoughts, and intentions. . . . The purpose of interviewing, then, is to allow us to enter into the other person’s perspective” (Patton, 1990, p. 196). Because the research literature not only focused on teachers and their perceptions but also gave credence to students and their perceptions, I employed the use of student focus-group interviews to include the student voice in the study. Because being interviewed one-on-one by an unfamiliar person may have made students hesitant to provide information, focus-group interviews with students proved to be advantageous. Students openly shared opinions and perceptions related to their inclusive classrooms. “Care [was] taken to encourage all participants to talk and to monitor individuals who may [have] dominate[d] the conversation” (Creswell, 1998, p. 124). Student focus groups were composed of general education students and students with learning disabilities. More detail about the focus group participants is presented in Chapter IV of this report. Observations Field observations afforded a first-hand view of teacher and student practices and interactions. “As an outsider an observer will notice things that have become routine to the participants themselves, things that may lead to understanding the context. . . . Observations are also conducted to triangulate prominent findings” (Merriam, 1998, pp. 95-96). In addition to formal classroom observations in the team-taught inclusive classrooms, I informally observed designated teachers as they taught in other assignments. I observed the special educator teaching a self-contained class and the two general educators teaching classes for gifted and talented students. Although notes from informal classroom observations were filed apart from data
59
collected and reported related to the inclusive classrooms, they provided me with a better sense of how designated teachers did or did not differentiate instruction in the inclusive classroom. Documents Documents in the form of student course grades and SOL end-of-course test results were used as measures of student success. As a reminder, success was defined as the students’ passing the Algebra I course and SOL end-of-course test. Therefore, determining the authenticity and accuracy of documents was part of the research process. “It is the investigator’s responsibility to determine as much as possible about the document, it origins and reasons for being written, its author, and the context in which it was written” (Merriam, 1998, p. 121). Member Checks Member checks permeated an eight-month period of study, from November 2001 through July 2002. Member checks included “taking data and tentative interpretations back to the people from whom they derived and asking them if the results [were] plausible” (Merriam, 1998, p. 204). Checking the validity of the data was done through the use of triangulation and member checks. Following Morehouse and Maykut’s (1994) guidelines for a cross-comparative analysis of triangulated cross-case data, the design for data reporting evolved. The constant comparative method of analyzing qualitative data combined inductive category coding with a simultaneous comparison of all units of meaning from data sources. Merriam (1998) found that “[c]ross-case analysis can result in little more than a unified description across cases; it can lead to categories, domains, or typology that conceptualize the data from all cases; or it can result in building substantive theory offering an integrated framework covering multiple cases” (p. 195). Member checks regarding data triangulation validated the findings addressed in the study.
60
Interview Procedures and Protocols Interview questions (see Appendices D-E) were developed around the research questions. A survey of questions based on the five domains of the theoretical framework (see Figure 3.1) were perused and culled by mathematics teachers from inclusive Algebra I classrooms not used in this study. A more detailed description of the selection and piloting of interview questions can be found later in this chapter, cited as Pilot Study. Subsequently, formal interviews were conducted with designated teachers and student focus groups. A total of three teachers and 14 students participated in audio-taped interviews. A comprehensive description of interview participants can be found in Chapter IV of this report. Each interview session began with a review of the purpose of the study, the procedures for the interview, and the assurances of confidentiality as outlined on the signed consent forms. The designated teachers chosen for the study determined the interview times. Teachers were interviewed during their planning periods, and students were interviewed during the regularlyscheduled time period for the inclusive Algebra I classes selected for the study. Any follow-up contacts with teachers or students were made either during the teachers’ planning periods or at times collaboratively agreed upon with teachers. All interview participants were interviewed in their school environments. “For the most part, interviewing in qualitative investigation is more open-ended and less structured” (Merriam, 1998, p. 74). Merriam cited tape-recording the interview as the most common way to record interview data. This practice ensures that everything said is preserved for analysis. Structured, open-ended interview questions were determined in advance and “designed with the theoretical framework in mind to increase the comparability of responses” (Patton, 1990, p. 289). Each designated teacher was asked the same set of questions developed for teachers, and each student
61
focus group was asked the same set of questions developed for students. The final question asked of teachers and students was, Is there any information that you would like to share about your inclusive classroom that was not covered in the structured questions? Interviews lasted between 25-30 minutes. Audio-tapes were professionally transcribed by a bonded vendor for subsequent data analysis. Observation Procedures Field observations were the designated source of collecting data inside the teachinglearning environment. Classroom observations provided a view of what actually happened in the natural field setting. As an outside observer, I was able to notice interactions and behaviors that had become routine to the participants themselves and which lead to understanding the context of the case (Merriam, 1998). “What to observe is determined by several factors. The most important is the researcher’s purpose in conducting the study in the first place. In other words, the conceptual framework, the problem, or the questions of interest determine what is to be observed” (pp. 95-96). Notes detailing field observations were scripted during the observations and then typed and coded to identify source (field observations), school (case site), and page number, e.g., O/SOn-1. These data were eventually analyzed and compared to data sources from each case site. Additional observation notes of secondary field observations and interactions with individual teachers were scripted and filed. Document Data Collection Collected documents included class rosters, students’ quarter and final grades, and students’ SOL end-of-course test results (see Appendices F-H). During initial meetings with designated teachers at each case site, teachers provided me with class rosters identifying students as general education students or students with disabilities and with student grades for the first
62
semester of the school year. At the end of the school year, designated teachers provided students’ first- and second-semester grades. Administrators at each site provided final course grades and end-of-course test results for students in classes that participated in the study. Assessing the Cultural Context Creswell (1998) suggested that culture is inferred from the words and actions of members of the group and by what participants do and say. The cultural portrait of this study was an overview of all aspects learned about the group. An overview of the selected school district provided an understanding of the complexities and challenges at the individual case sites. A closer look at the cultural context of the study is presented in Chapter IV. Pilot Study Interview guides (lists of questions) for designated teachers and student focus groups were prepared in advance to ensure that the same information was obtained from each case site. These guides were field tested by general and special educators who taught in Algebra I inclusive classrooms in a school that was not used as a case for this study. First, a survey of questions was designed based on the theoretical framework (see Figure 3.2, p. 58) which included the domains of interest. The adherence to the framework increased the comparability of responses (Patton, 1990). Five mathematics teachers, including the department chairperson, the articulation facilitator for grades 7-12, two special educators and one general educator who teamtaught in inclusive classrooms, reviewed a survey of questions. They maintained or eliminated questions by deeming them as either closely or not closely associated to the five suggested domains, and as either clearly or not clearly stated. As a result, a final list of questions for the interview guides evolved. Merriam (1998) shared that “pilot interviews are crucial for trying out your questions. Not only do you get some practice in interviewing, you also quickly learn which
63
questions are confusing and need rewording, which questions yield useless data, and which questions as suggested by your respondents, you should have thought to include” (p. 76). Data Analysis and Management Procedures Data analysis was completed using Morehouse and Maykut’s (1994) research on using the constant comparative method. Their approach to data analysis focused on understanding more about the phenomenon being investigated and describing what was learned with minimum interpretation. Morehouse and Maykut proposed that by incorporating a rigorous and systematic analysis of the data, one could develop inductive resultant propositions or proposed statements of fact. “In arriving at these propositions, we want to stay close to the research participants’ feelings, thoughts and actions as they broadly relate to our focus of inquiry” (p. 126). The constant comparative method of data analysis included procedural detail for the steps involved in analyzing data. The inductive approach to data analysis centered on prominent data. To that end, data were screened to find words, phrases, or paragraphs that appeared most frequently. Then these data excerpts were catalogued according to domain. Although no hypotheses were generated or predetermined, the prominent domains were balanced against the five domains of the theoretical framework. What became important to analyze and compare to the domains of the model addressed in the data itself, derived from a process of inductive reasoning. “This method provide[d] . . . a clear path for engaging in analysis of substantial amounts of data in a way that [was] both challenging and illuminating” (Morehouse & Maykut, 1994, p. 127). Basic Operations in Data Analysis Preparing the data for analysis was the first step in the constant comparative method to data analysis. Field observation notes, audiotapes, and documents were transformed into a
64
systematic form for examination. After amassing transcripts of field notes and audio-taped interviews and creating tables to clarify unclear documents, I coded data pages to their sources (Morehouse & Maykut, 1994). Coding Data Pages to Their Sources Data analysis was conducted using photocopies of all data. After field notes and audiotaped interviews were transcribed, each page was photocopied. Then pages were coded for data type: field observations, teacher interviews, and focus group interviews. Next, each page of data was coded for participant identification: designated teacher’s first name for teacher interviews; case numbers (One, Two, or Three) for each school and focus group. Numbers for student focus groups were correlated with the school that each group represented. Finally, each page of data was assigned a page number within data type. For example, the teacher interview with Jennifer is referred to as T (transcript), J (for Jennifer’s interview), and 1 (page one of Jennifer’s interview), or T/J-1. An excerpt from page four of the field notes from a formal observation (O) in the classroom at the school assigned case number two, or School Two (STw), is referred to as O/STw-4. An excerpt from pages 11 through 12 of student focus-group interview transcripts (FG) from the school assigned case number three (Th) is referred to as FG/Th-11-12. Finally, multiple copies of the coded data pages were duplicated. Table 3.1 serves as a reference guide for data sources.
65
Table 3.1 Reference Guide for Internal Documentation of Data Sources Case One
Case Two
Case Three
Field Observation
O/SOn
O/STw
O/STh
Focus Group Interview
FG/On
FG/Tw
FG/Th
T/J
T/D
T/I
Data Source
Teacher Interview
Note: See Data Source matrices in Appendices L-O.
66
The following paragraphs describe more specifically the coding procedures used during data analysis. The procedures include unitizing the data, discovery, inductive category coding, and refinement of categories. Unitizing the Data After all data had been photocopied, the next step was to identify the large pieces or units of meaning in the data (Morehouse & Maykut, 1994). The search for meaning was accomplished by “first identifying the smaller units of meaning in the data, which [later served] as the basis for defining larger categories of meaning. Each unit of meaning identified in the data [had to] stand by itself in order to be useful for analysis” (p. 128). Using varied colors of highlighter pens, I read through each data source separately, unitizing the data. Then a color chart which correlated the categories of unitized data to an assigned color was created. The color yellow was correlated with feelings and perceptions. The color purple was correlated with teacher planning. The color blue was correlated with teacher and student actions. The color green was correlated with differentiated instruction. The color pink was correlated with other influences. Then a computergenerated summary chart was created for each category of unitized data. Using color ink cartridges, I created charts to match the same colors as highlighted units of meaning from the pages of data sources. Each unit of data on each chart was immediately followed by the data source code, e.g., T/I-11 or teacher interview with Indira, page 11. Discovery The discovery process entailed a search for the important meanings in what people said in interviews, what was observed, and what was found in documents. Morehouse and Maykut (1994) suggested asking the following questions to determine prominent patterns: 1. What are the recurring words, phrases, and topics in the data?
67
2. What are the concepts that the interviewees use to capture what they say or do? 3. Can you think of other concepts that capture some recurring phenomenon in the data, that help sensitize you to recognize it when it occurs again? and 4. Can you identify any emerging domains in your data, expressed as a phrase, proposition or question? Do you see any patterns? Consequently, the categorized units of meaning were perused with the preceding questions in mind and then compared from one case to the other. Inductive Category Coding The inductive category coding included assistance from a colleague. After I completed a summary chart of each unit of meaning, computer-generated data charts were printed, cut into strips per unit of meaning, and glued to a poster board titled by units of meaning, e.g., Actions. Before matching the units of meaning as labeled in the initial unitizing (actions, influences, differentiations, feelings and perceptions, and other influences) to the thematic model, I sought help from a colleague who was the principal of one of the schools participating in the case study and a doctoral student himself. I showed him how I had unitized coded pages of data. Then I gave him a copy of the theoretical model (see Figure 3.1, p. 46) on which this study was based, a chart delineating and defining the five domains cited in the model, and coded copies of the data sources. He agreed to identify every word, phrase, or paragraph as a unit of meaning, labeling each unit as either climate (yellow), planning (purple), time (blue), accommodations and adaptations (green), or other influences (pink) based on the definitions of the domains. When my colleague completed the unitizing process, he returned the color-coded pages of data sources. His color-coded pages were then cut into strips by units of meaning and glued to poster boards labeled by domain.
68
Refinement of Categories The domains (see Appendix C) as defined and determined by the research literature in Chapter II served as guidelines for including data in each category. Data grouped under each domain included quotes from teachers and students and excerpts from field notes. My colleague and I discussed and matched or re-matched the units of data on the chart that I had completed with the chart that he had completed according to the domains in the theoretical model in Figure 3.1. We discussed conflicts in categorization of units of meaning in instances where we had placed the same or similar units of meaning in different categories. For example, I may have categorized a unit of meaning under the category of planning, and my colleague may have categorized that same unit of meaning under the category of time. After discussing the units of meaning, my colleague deferred final assignments of data categories to me. Then a chart of unitized data, including prominent categories or domains, was developed in preparation for writing up the research. Data Management Data from three separate case sites provided needed information and records. Table 3.2 is a graphic representation of the time spent to collect and confirm data with designated teachers. Scheduling Teacher Data Discussions The foundation for this study was access to the case sites and participants. After identifying the designated teacher participants, I contacted them to schedule meeting times. Before initial meetings, teachers were contacted via telephone and asked to have the following information for the team-taught class that would serve as the case site: class rosters distinguishing general education students and students with disabilities, first-semester course
69
Table 3.2 Time Spent Collecting Data from Case Sites 1st Contact
2nd Contact
3rd Contact
Teacher
TOTAL
4.25 hours
Discussions
School One
10 minutes (e-mail)
45 minutes
30 minutes
85 minutes
School Two
10 minutes (e-mail)
45 minutes
30 minutes
85 minutes
School Three
10 minutes (e-mail)
45 minutes
30 minutes
85 minutes
Teachers
Students
3 hours
School One
25 minutes
35 minutes
60 minutes
School Two
30 minutes
30 minutes
60 minutes
School Three
30 minutes
30 minutes
60 minutes
Interviews
Observations
5.75 hours
School One School Two
80 minutes 25 minutes
30 minutes
85 minutes
School Three
90 minutes
110 minutes 110 minutes
35 minutes
Member Checks
125 minutes 2 hours
School One
10 minutes (telephone) 10 minutes (e-mail)
20 minutes
40 minutes
School Two
10 minutes (telephone) 10 minutes (e-mail)
20 minutes
40 minutes
School Three
10 minutes (telephone) 10 minutes (e-mail)
20 minutes
40 minutes
70
grades for students, and lesson plans for the class sessions that would be observed during formal observations. Then via electronic mail (e-mail) teachers were provided with consent forms delineating the purpose of the study, the significance of the study, and the matters of confidentiality before our first meeting. The first meetings with designated teachers lasted approximately 45 minutes and centered on personal introductions, logistics of fact gathering, discussion of the consent forms for teachers and students, and the composition of student focus groups. We agreed to wait until after completed field observations to choose participants for student focus groups. Finally, we established a time for field observations and teacher interviews. Subsequent teacher discussions focused on selecting students for participation in focus groups, collecting student-parent consent forms from teachers, meeting the challenges of the inclusive classroom versus challenges in more homogeneous classrooms, and completing member checks related to data findings and analysis. Member checks entailed sending data summaries and conclusions to designated teachers via e-mail and then getting feedback via telephone or during personal visits to the case sites. Meeting summaries of teacher discussions were kept on file by school or case site. Transcripts Field notes and interviews were transcribed in preparation for data analysis. Formal observations consisted of class periods that ranged from 80-90 minutes in length. Inclusive classes were observed in their entirety to determine how classes were conducted from beginning to end, including established routines. Notes from formal field observations were personally transcribed. However, I also observed designated teachers in alternative teaching assignments as a means of noting possible differences in their planning, accommodations and adaptations, and 71
use of time in their more homogeneous classrooms versus their inclusive classrooms. Notes from informal observations of alternative teaching assignments were kept on file by school or case site for personal reference. Each interview was audio-taped. Interview tapes were submitted to a professional transcriber. Tapes were transcribed verbatim. The transcription service provided both paper copies of and computer disks with transcripts of the teacher and student focus-group interviews. Transcripts were kept in a three-ring binder. Document Management Documents were collected, analyzed, and put into table form (see Appendices F-H). These documents, including student course grades and SOL end-of-course test results, were used to exemplify student outcomes. Arrangements as to the logistics of document transfers occurred during initial contacts with school-based staff. Although students were enrolled in the same inclusive Algebra I class, their grades were maintained separately. General educators maintained grades and demographic information for general education students, and special educators maintained grades and demographic information for students with disabilities. Each teacher had access to her colleague’s database of student information. The designated teachers agreed to provide class rosters and student information. Site-based administrators provided final course grades and SOL end-of-course test results. Student demographic information was maintained in a three-ring binder. Addressing Quality “Ensuring [the quality of] qualitative research involve[d] conducting the investigation in an ethical manner” (Merriam, 1998, p. 198). Therefore, the concepts of credibility, transferability, and dependability were considered throughout the research process.
72
Credibility Ensuring the credibility of the research entailed many variables. The first variable was relationship-building. The study lasted for eight months, from November 2001 through July 2002. Throughout this period of time, I gained the trust and support of supervisors, administrators, teachers, and students who participated in the study. As a result, not only was I able to collect needed data and get consistent feedback related to data summaries and analyses, but I was also able to establish positive relationships and gain the trust of participants. Through these relationships, I was able to address the second variable, collecting comparable data from various sites. Because triangulation was the method of comparing and analyzing data, I needed access to three separate sites, including staff and students within each site. Participants had to agree to observations, interviews, and member checks. Consequently, time for member checks proved to be a most important variable. To make the point, through member checks, I learned that some students originally identified as students with disabilities at School Two were incorrectly identified. Without teachers checking and verifying data, results for student outcomes and success could have yielded faulty results. Transferability Using rich description of the case sites, I shared detailed information about the cultural context in which the study was planned and implemented. As a result, future researchers will have a clear picture of the demographic composition of the case sites, the strategies and practices used in the classrooms, the resulting student outcomes, and the methods used to collect the data. Dependability Merriam (1998) acknowledged that the best a researcher can do is to be conscious of ethical issues and, consequently, examine his or her own philosophical orientation. Merriam
73
stated that “[e]specially in terms of using multiple methods of data collection and analysis, triangulation strengthens reliability as well as internal validity” (p. 207). To that end, she offered the following challenges of the trustworthiness of qualitative research: 1.
What can you possibly tell from a n of 1 (3, 15, 29, etc.)?
2.
What is it worth to get one person’s interpretation of someone else’s interpretation of what is going on?
3.
How can you generalize from a small, nonrandom sample?
4.
If the researcher is the designated instrument for data collection and analysis, how can we be sure the researcher is a valid and reliable instrument?
5.
How do you know the researcher isn’t biased and just finding out what he or she expects to find?
6.
Doesn’t the researcher’s presence so alter the participant’s behavior as to contaminate the data?
7.
Don’t people often lie to field researchers?
8.
If somebody else did this study, would they get the same results? (p. 202) The Qualitative Narrative: Presenting the Results
The emphasis of narrative analysis is on the stories people tell (Merriam, 1998). Merriam indicated that one of the strengths of thinking about our data as narrative is that it opens up the possibilities for a variety of analytic strategies. Employing description and quotes from participants, this report presents to its audience, those interested in curriculum and instruction in inclusive classrooms, a comparative analysis of qualitative data in the forms of observations, interviews, and document analysis.
74
Chapter IV is a presentation of findings obtained through the field observations, teacher and student interviews, and a review of pertinent documents. This section of the study also contains a description of the participants and a narrative summary of the major domains that emerged from the triangulated data collected from the Algebra I inclusive classroom and the research literature. The constant comparative method (Morehouse & Maykut, 1994) is used to present the data results. The basic strategy of this method is to constantly compare data. Using data recorded in transcripts of field observations, interviews, and student records, I compared words, noted observations, and analyzed student records, first by analyzing individual cases and then by comparing the resultant data from the three cases. These comparisons led to possible categories that were then unitized to determine what similar domains similar to the domains found in the research literature evolved. Finally, documents from the three cases were analyzed and compared among the three cases to gauge how well teaching strategies and practices influenced student success in passing the Algebra I course and SOL end-of-course tests, with specific attention given to the success of general education students compared the success of students with disabilities. Finally, Chapter V provides a defense of the evidence presented related to strategies and practices used to address the needs of students with diverse abilities. This chapter includes conclusions drawn from the study, implications and recommendations for teaching practice, and recommendations for further research.
75
CHAPTER IV FINDINGS This research study examined how teaching strategies and practice were used to provide effective instruction in the inclusive Algebra I classroom. This chapter includes a crosscomparison of three case studies from a suburban school district. First, the reader is given an overview of the suburban school district, of the individual case sites, and of the designated participants. Then an explanation is offered as to how the theoretical framework was used to illustrate the findings. Next, based on constant comparative analysis, the findings are provided. These findings are based on the prominent domains, including general descriptions of the domains, descriptions addressed in data transcripts and documents, and interpretive commentary. Finally, a comprehensive and disaggregated description of student success is presented through a review of student documents, comprising course grades and SOL end-of-course test results. The chapter ends with a relationship of the findings to the theoretical framework and the research literature. Data sources are referred to using codes that identify the source type (O-observation; T-teacher interview transcript; FG-student focus-group transcript) followed by numbers that identify the school –School One (SOn); School Two (STw); School Three (STh) – the participants, and the page numbers of the transcripts or field notes. Demographic Profile of Participants A key advantage of case study is the rich description that affords the reader the vicarious experience of having been there. “The case study should take the reader into the case situation, a person’s life, a group’s life, or a program’s life” (Patton, 1990, p. 387). Therefore, the findings from this study are prefaced by a comprehensive overview of the school district and the three case sites used for this study.
76
The Participating Jurisdiction and School District With a population of more than 965, 000, the county in which the selected school case sites rest in one of the most populated jurisdictions in a large southeastern state. This large suburban county is located near a major metropolitan area. However, phenomenal growth during the past 70 years has caused the county to experience broad changes. The county changed from a rural, agriculturally oriented society to an urban, business-oriented one. Although this growth altered the county's lifestyle, it also provided county residents with one of the highest standards of living in the world. Residents now enjoy one of the highest median family incomes in the nation. They lay claim to one of highest rated public school systems in the country, beautiful parks, an international airport, numerous recreational facilities, and fine cultural opportunities. At the time of this study, the county’s school district was among the largest school districts in the nation. Serving more than 165,000 students, including 22,000 students who received special education services, the district had an operating budget of approximately 1.555 billion dollars and a per pupil expenditure of $9,388. Ninety-two percent of its high school graduates continued on to some form of postsecondary education, including 68% of the special education population. There were 21 high schools serving grades 9-12, and three secondary schools serving grades 7-12. Each of these schools provided special education students with a continuum of services that offered access to and participation in the activities of the school and community environments as appropriate to the age and educational needs of the student. Services for students with learning disabilities were provided through a broad continuum of delivery options. Instruction was based on the individualized needs of students as determined by the IEP team, and services ranged from support in general education classes to specialized instruction in specific curricular areas. Students with identified needs received instruction
77
through small group instruction, classes co-taught by special educators and teachers of general education programs, collaboration and consultation between educators for special and general education, and accommodations provided to facilitate access to the general education curriculum and instruction. At the same time, students received direct instruction aimed at improving their deficits in reading, writing, and mathematics. Emphasis was on skill remediation, development of compensatory strategies, and accommodation techniques to support student achievement. Learning disabilities staff assigned to every elementary, middle, and high school provided instruction to identified students, consultative support to general education staff, and diagnostic services to local screening committees (from School District’s Parent Handbook, August 2002). Table 4.1 represents a demographic profile of the district. The statewide passing rates on the end-of-course SOL tests, which included all students statewide who took the Algebra I SOL end-of course tests, indicated a challenge for students and teachers. The overall student performance of some districts and the performance gap between general education students and students with disabilities on the Algebra I end-of-course test were cause for action statewide. Because many students with disabilities received instruction in general education classrooms, they received additional services from special educators who team-taught with general educators in inclusive Algebra I classrooms. This study was focused on teaching strategies and practices in inclusive classrooms.
78
965, 000
County Population
22,000 (13.4%)
143,000 (86.6%)
Students
Students 165,000
Education
Education
Population
Special
General
Student
Demographic Profile of Participating School District for Fiscal Year 2001-2002
Table 4.1
79
$1.555 billion
Budget
Annual Operating
$9,388
Per Pupil Spending
The composition and selection of students in the inclusive class was noteworthy. The Algebra I course was needed by all students to meet high school graduation requirements. In this district, most gifted mathematics students took Algebra I as eighth graders. Students with disabilities who had limited mathematics ability were placed in self-contained classrooms for instruction. Therefore, many students with disabilities in the inclusive Algebra I classroom may not have had mathematics goals included in their IEPs. Students with disabilities in the inclusive classroom were usually placed there by teacher recommendation or parent request; these recommendations or requests were based on student data or parental expectations. Students with or without disabilities could choose to take the course as a regular class or as an advanced class for students with advanced skills in mathematics, based on their skill ability. Table 4.2 delineates the challenge denoted by the statewide passing rates on mandated Algebra I end-of-course tests. School One School One was an EXCEL school. EXCEL schools were described in Chapter III as schools receiving extra support. School One served approximately 1456 students: 1312 general education students (90%); 332 students (23%) receiving special education services, including 144 students receiving instruction in self-contained classrooms and 188 students receiving instruction in a team-taught class or receiving resource assistance; and 192 students (13%) receiving specialized instruction for English Speakers of Other Languages (ESOL). About 35% of the students were eligible to receive free or reduced (FRE or free and reduced eligibility) lunch prices. Addressing the diverse needs of students, school programs included general education, professional technical, special education, ESOL, and gifted and talented. The average daily attendance for the school was approximately 95%. Table 4.3 offers an overview of School
80
Table 4.2 2000-2002 Statewide Spring Passing Ratesa for Non-disabled and Disabled Students on Algebra I SOL Test
Non-disabled Students
a
Disabled Students
2000
68%
33%
2001
77%
40%
2002
81%
49%
The passing rate percentages include results of students statewide.
81
a
332 (23%)
(90%)
Disabilitiesa
Students
1312
Students with
General Education
Students receiving multiple services are counted more than once.
1456
Total Enrollment
School One: Student Data
Table 4.3
82
(13%)
192
ESOL Students
95%
Attendance
Daily
39%
Eligibility)
[Lunch]
Reduced
(Free and
FRE
One. In Table 4.3, notice that the combination of the number of students receiving general education and specialized services surpass the total number of students enrolled in the school. This seeming discrepancy is due to the fact that students receiving multiple services were counted more than once and that ESOL students were also educated on a continuum, with some ESOL students receiving education in self-contained classes structured for limited English proficient students. School One was designated an EXCEL school by the district based on its 1999 aggregate SOL end-of-course test performance and the state’s assignation of “accredited with warning” status. In 1999, School One failed to meet standards, or earn 70% or the minimum 400 points scale score, on six of the 11 SOL tests. Its Algebra I passing rates were among the lowest of the district’s 24 high schools. As an EXCEL school, given the choice to modify its yearly student attendance schedule, School One selected to choose an augmented yearly schedule. Simply, School One began two weeks before most district high schools and ended two weeks before most district high schools. The early start afforded students from School One the option to have more instructional time before end-of-course tests and to begin an early summer school program that offered enrichment and remediation year-round. Table 4.4 provides an overview of the school’s Algebra I end-of-course test performance. The designated participants from School One included a general educator and a fourmember student focus group. Jennifer was in her second year of teaching. A career-switcher, Jennifer was formerly an engineer who graduated from an Ivy League university. Influenced by her husband’s love of teaching, she became certified as a mathematics teacher. Not only did Jennifer teach advanced placement mathematics, but she also taught in one of the inclusive
83
Table 4.4 School One: 1999-2002 Passing Rates for Algebra I SOL Test 1999
2000
2001
2002
34.85%
48%
74%
76%
84
Algebra I classrooms used for this study. Jennifer team-taught in the inclusive Algebra I classroom with Daphney. Daphney was an experienced special educator in her ninth year of teaching. Jennifer and Daphney’s second-period Algebra I class consisted of 14 students, including 10 general education students and 4 students with identified learning disabilities. The focus group from School One consisted of four students, one female and three males. Their final grades were an average of teacher-generated grades based on graded assignments from four nine-week quarters and a teacher-developed final examination. Their SOL scores were the result of the state-generated mandated end-of-course test. Two of the male participants were general education students; one male and the only female focus group member were students with disabilities. Both male general education students received final grades of B+ for the Algebra I course and passed the Algebra I end-of-course test. The male student with disabilities received a final grade of C+ for the Algebra I course and passed the Algebra I end-of-course test. The female student with disabilities received a final grade of D+ for the Algebra I course and failed the end-of-course test by one point, with a score of 399. Table 4.5 presents a view of student outcomes for members of Focus Group One. School Two School Two, also an EXCEL school, served approximately 1767 students, grades 9-12. Of the 1767 students, there were 1545 general education students (87%); 441 students (25%) receiving special education services, including 222 students receiving instruction in selfcontained classrooms and 219 students receiving instruction in a team-taught class or receiving resource assistance; and 105 students (6%) receiving specialized instruction for English Speakers of Other Languages (ESOL). Students chose from a wide range of course offerings, including International Baccalaureate (IB) courses. The school lauded its diversity, with more than 50
85
Table 4.5 Focus Group One: Student Outcomes Gender
Classification
Final Grade
SOL Score (Pass = 400)
Male Male
Non-disabled Non-disabled
B+
481
B+
451
Male
Disabled
C+
432
Female
Disabled
D+
399
86
countries and 30 languages represented in its student population. The average daily attendance was approximately 94%, and about 35% of the students received free or reduced (FRE or free and reduced eligibility) lunch prices. Table 4.6 presents an overview of School Two. In Table 4.6, notice that the combination of the number of students receiving general education and specialized services surpass the total number of students enrolled in the school. This seeming discrepancy is due to the fact that students receiving multiple services were counted more than once and that ESOL students were also educated on a continuum, with some ESOL students receiving education in self-contained classes structured for limited English proficient students. School Two was also designated an EXCEL school by the district, based on its 1999 aggregate SOL end-of-course scores and state assignation of “accredited with warning” status. In 1999, School Two failed to meet standards, or earn the 70% passing rate or the minimum 400 points scale score, on eight of the 11 SOL tests. Notably, while showing yearly progress, School Two still failed to meet the 70% passing rate in Algebra I. Table 4.7 delineates the school’s Algebra I test results from 1999 through 2002. The designated participants from School Two included a general educator and a fourmember student focus group. Danette, an alumnus of School Two, was in her seventh year of teaching. She taught various levels of mathematics, from the inclusive algebra class to an advanced International Baccalaureate class. Danette team-taught the inclusive algebra class used for this study with Tracy. Tracy, a second-year special educator, was in her first year of teamteaching with Danette. Danette and Tracy’s third-period Algebra I team-taught class consisted of 21 students, including 14 general education students and 7 students with identified learning disabilities.
87
a
94.11%
441a (25%)
1545 (87%)
(6%)
105
Attendance
Disabilities
Daily
Students
ESOL Students
Students with
General Education
Students receiving multiple services are counted more than once.
1767
Total Enrollment
School Two: 2001-2002 Student Data
Table 4.6
88
35%
Eligibility)
Reduced [Lunch]
(Free and
FRE
Table 4.7 School Two: 1999-2002 Passing Rates for Algebra I SOL Test
1999
2000
2001
2002
40%
58%
54%
56%
89
The focus group from School Two consisted of four students, two general education students and two students with disabilities. Their final grades were an average of teachergenerated grades based on grades from four nine-week quarters and a teacher-developed final examination. Their SOL scores were the result of the state-generated mandated end-of-course test. One male general education student received a final course grade of D+ and passed the endof-course test. One male student with disabilities received a final course grade of D+ and failed the end-of-course test. One female general education student received a final course grade of B+ and passed the end-of-course test. Another female student with disabilities received an A as her final course grade and passed the end-of-course test with 81 points beyond the state’s cut score. Table 4.8 provides a view of student outcomes for Focus Group Two. School Three School Three served approximately 1944 students in grades 9 through 12. The composition of the student population was as follows: 1788 general education students (92%); 410 students with disabilities (21%), including156 students with disabilities receiving instruction in self-contained classes and 254 students with disabilities receiving special; and 180 students (9%) enrolled in classes for English Speakers of Other Languages (ESOL). School Three offered a diversified academic program, which included the second largest number of advanced placement (AP) courses in the school district. The average daily attendance was 94%, and approximately 25% of the students were eligible to receive free or reduced (FRE or free and reduced eligibility) lunch prices. Table 4.9 presents an overview of School Three. In Table 4.9, notice that the combination of the number of students receiving general education and specialized services surpass the total number of students enrolled in the school. This seeming
90
Table 4.8 Focus Group Two: Student Outcomes Gender
Classification
Final Grade
SOL Score (Pass = 400)
Female
Disabled
A
481
Female
Non-disabled
B+
456
Male
Non-disabled
D+
428
Male
Disabled
D+
389
91
a
410 (21%)
1788 (92%)
Disabilitiesa
Students with
Students receiving multiple services are counted more than once.
1944
Education
Enrollment Students
General
Total
School Three: 2001-2002 Student Data
Table 4.9
92
(9%)
180
ESOL Students
94%
Daily Attendance
25%
[Lunch] Eligibility)
(Free and Reduced
FRE
discrepancy is due to the fact that students receiving multiple services were counted more than once and that ESOL students were also educated on a continuum, with some ESOL students receiving education in self-contained classes structured for limited English proficient students. School Three was not designated an EXCEL school. However, the composition of its student population and overall student performance on SOL end-of-course tests were comparable to the two EXCEL schools. School Three was in the same geographical vicinity as School Two, less than five miles apart. School Three actually failed seven of the eleven SOL end-of-course tests, thus failing one more end-of-course test than School One. From 1999 through 2001, School Three failed to meet the 70% required passing rate for Algebra I. Table 4.10 delineates a fouryear history of School Three's Algebra I SOL test results. The designated participants at School Three included a special educator and a fivemember student focus group. Indira was a certified teacher of special education in her sixth year of teaching. At the time of this study, she was in the process of completing a doctoral degree in educational psychology. In addition to teaching self-contained mathematics classes for students with disabilities, she team-taught in the inclusive algebra class used for this study with Sam. Sam was a general educator in her fourth year of teaching. She had a bachelor’s degree in mathematics. Indira and Sam’s third-period class consisted of 21 students, including 13 general education students and 8 students identified with learning disabilities. The focus group from School Three consisted of five students, three general education students and two students with disabilities. Their final grades were an average of teachergenerated grades based on grades from four nine-week quarters and a teacher-developed final examination. Their SOL scores were the result of the state-generated mandated end-of-course test. One male general education student received a final course grade of A and passed the end93
Table 4.10 School Three: 1999-2002 Passing Rates for Algebra I SOL Test
1999
2000
2001
2002
49%
65%
64%
76%
94
of-course test, and one male general education student received a final course grade of D and passed the end-of-course test. The male student with disabilities received a final course grade of B+ but failed the end-of-course test by 15 points. The female general education student received a final course grade of D and passed the end-of-course test, and the female student with disabilities received a final course grade of A and passed the end-of-course test with 99 points beyond the needed cut score. Table 4.11 presents a view of student outcomes. Relating the Findings to the Theoretical Framework This section of the study contains a narrative summary of major domains addressed in the data. The findings are reported based on their relationships to the theoretical framework, which contains three levels: desired student learning outcomes, the domains delineating instructional conditions that offer the opportunities for teacher interventions, and student outcomes (see Figure 3.1, p. 46). Student Learning Combined theories of learning from Skinner (1953) and Gagné (1985) formed the basis for the theoretical framework. Thus, the fundamental theory on which this framework was based suggests that although cognitive theory focuses on building on skill acquisition (Gagné), learning must also be translated into observable behaviors that result from experience and practice in the learning environment (Skinner). According to this theory, instructional conditions and teacher interventions may enhance students' skills and desired learning experiences. Instructional Conditions and Interventions The central concern in this study was to gauge how designated teachers altered their instructional conditions, practices, and strategies in response to a changing student population,
95
Table 4.11 Focus Group Three: Student Outcomes
Gender
Classification
Final Grade
SOL Score (Pass = 400)
Male
Non-disabled
A
499
Female
Disabled
A
499
Female
Non-disabled
D
449
Male
Non-disabled
D
401
Male
Disabled
B+
385
96
specifically classes serving students with diverse abilities. Although the data analyses presented in this section suggested that teachers were willing to adapt their strategies and practices to enhance student achievement, the teachers' content knowledge of algebra also appeared to frame their instructional responses to students. Four major domains which seemed to influence student achievement were addressed in the data. The major domains addressed in these data appeared in the theoretical framework: (a) classroom climate, (b) planning, (c) use of time and (d) accommodations and adaptations. The domains were described as follows. Climate referred to an instructional condition related to the affective (feelings, emotions) nature of the classroom. In an effective classroom climate, teacher attitudes and perceptions reflected the ability to create for students an environment of understanding and mutual respect. Planning was an instructional condition that incorporated focused goals for students and teachers, including pre-planning and the ability to modify daily lessons when necessary and without interrupting student learning. The use of time was a teaching intervention related to how teaching and learning were scheduled, allocated, and used to keep students engaged and interested in learning activities. Adaptations and accommodations were teaching interventions that included choosing and applying appropriate teaching actions after assessing student success and then pacing and sequencing instruction based on student readiness. However, other influences were also found to impede student success, including teacher training, student behaviors, and student placement. For instance, insufficient teacher training prevented teachers from adequately creating instructional conditions or planning effective interventions. Negative student behaviors such as absenteeism, disciplinary infractions, or apathy, impeded student progress. Finally, inappropriate student placement may not have afforded students with special needs the appropriate accommodations. 97
Student Outcomes This study would be incomplete without a description of how the students performed in the course by the end of the year. The findings describe what teachers did, how students felt about the instructional conditions and interventions, and how students performed. There was a particular focus on the performance gap between general education students and students with disabilities in these classes. As shown in Figure 4.1, the performance gap between students with and without disabilities was narrower on the teacher end-of-course grades than the performance gap between them on standardized end-of-course tests. Student Outcomes: A Cross-Case Comparison Student outcomes were derived from documents delineating end-of-course grades and SOL end-of-course test results. Aggregate performance results across the three cases represented teacher-generated and standardized scores. Disaggregated data were presented because assessment provisions in IDEA required that information on participation in assessments and performance for students with disabilities be reported publicly in the same way and with the same frequency as the reports presented for students without disabilities (Thurlow & Thompson, 1999). First, a summary of student performance for the Algebra I course is offered for consideration. Approximately 82% (46/56) of the combined total enrollment from the three cases passed the Algebra I course with a D (64-73%) or better grade average. Across the three cases, the percentage of students failing the Algebra I course ranged from 7% (SOn: 1/14) to 14%
98
The Effect of Other Influences: (d) Teacher Training (e) Student Behaviors (f) Student Placement The Effect of Other Influences
The Use of Adaptations and Accommodations
The Use of Time
The Use of Planning
The Establishment of Classroom Climate
DOMAINS
Passing
! Non-disabled: 78% (29/37) ! Disabled: 47% (9/19)
Passing SOL Algebra I Test:
! Non-disabled: 86% (32/37) ! Disabled: 74% (14/19)
Algebra I Course:
Student Outcomes
Figure 4.1. A cross-case analysis of student documents from the three Algebra I inclusive classrooms revealed that although teacher strategies and practices helped to close the achievement gap between general education (non-disabled) students and students with disabilities (disabled) in Algebra I course-grade performance, the disparity of the gap between non-disabled and disabled students in passing the SOL Algebra I end-of-course test indicated a need for further study.
test
Algebra I end-of-course
! 400 > Scale Score on
! Passing Course Grades
Desired Learning Outcomes:
99
(STw: 3.21) to 28% (STh: 6/21). Overall, approximately 18% of the algebra students in these classrooms received an F (0-63%) as a final grade (see Appendices I-K). Students were not as successful in passing the end-of-course tests as measured by standardized state criteria. As indicated by these data, the majority of students were successful when evaluated by teacher standards. Teacher adaptations of grades might have served to alleviate poor student outcomes. Research indicated that common grading adaptations such as changing grading criteria, making changes to letter and number grades, and using alternatives to letter and number grades increased the chance of student success (Bursuck, Munk, & Olson, 1999). Next, a summary of the SOL end-of-course results presents a picture of student performance on required standards-based tests. Approximately 68% (38/56) of the total enrollment in the case teachers’ inclusive classrooms passed the Algebra I end-of-course test. Across the 3 cases, the percentage of students failing the end-of-course test were 14% in School One (SOn/2/14); 47% in School Two (STw/10/21); and 28% in School Three (STh/15/21). Overall, roughly 32% of the algebra students in these classrooms received a failing score on the end-of-course test. Objective, state-generated standardized tests seemed to present a different picture of student achievement than the subjective teacher evaluations depicted in teachergenerated grades. Research indicated that although standardized tests were designed to promote fairness in decision making by ensuring the content tested and the test administration conditions were uniform for all test-takers, many students with disabilities were unable to display their true knowledge and skills when taking tests under standardized conditions (Green & Sireci, 1999). In summary, 85% (32/37) of the general education students passed the Algebra I course although 78% (29/37) of the general education students passed the end-of-course test. On the other hand, 74% (14/19) of the students with disabilities passed the Algebra I course although
100
only 47% (9/19) passed the end-of-course test. The teachers who participated in this study provided feedback regarding these student outcomes. Teachers shared the following conclusions about overall student performance. In looking at the final course grades versus SOL end-of-course test results, teachers surmised that if students passed the course with an A, B, or C, they were reasonably sure to earn a passing score on the SOL end-of-course test. Of the students who passed the course with a grade of A, B, or C, only 8% (2/25) failed the end-of-course test. Teachers surmised that if students had a final course grade of D, their performance on the end-of-course test was unpredictable for several reasons. One reason that some students received a final grade of D was due to a lack of effort. In other words, if students possessed the knowledge and ability to do well but failed to complete homework and failed to study mathematical concepts, they often performed inconsistently on teacher-generated tests. In essence, some capable students who had earned final grades of D did pass the end-of-course test. Also, students who had earned final grades of D, completed all assigned work, but lacked strong mathematical skills were more likely to fail teacher-generated tests as well as the SOL end-of-course test. Almost half or 47% (10/21) of students with a final grade of D failed the end-of-course test. Finally, teachers surmised that students who failed the course generally failed the end-of-course test. More than half or 60% (6/10) of the students who failed the course also failed the end-of-course test. As noted in Figure 4.1 (p. 99), 85% (32/37) of the general education students passed the Algebra I course while 78% (29/37) passed the end-ofcourse. On the other hand, 74% (14/19) of the students with disabilities passed the Algebra I course yet only 47% (9/19) passed the end-of-course test. Table 4.12 offers a descriptive crosscomparison of student course grades and end-of-course test results from the three case sites.
101
Table 4.12 Cross-Case Comparison of Student Course Grades and SOL Test Results Final Course Gradesa Total Population
SOL Test Resultsb
56
100%
56
100%
Passed
46
82.1%
38
67.9%
Failed
10
17.9%
18
32.1%
General Education
37
100%
37
100%
Passed
32
86.5%
29
78.4%
Failed
5
13.5%
8
21.6%
Special Education
19
100%
19
100%
Passed
14
73.7%
9
47.4%
Failed
5
26.3%
10
52.6%
a
Course Grade Percentages: A=94-100; B=84-93; C=74-83; D=64-73; F (failing)=0-63
b
SOL Scale Scores: 500-600=pass/advanced; 400-499=pass/proficient; 0-399=fail
102
Major Domains This section includes a description of the prominent domains addressed in the data. The prominent domains included (a) classroom climate, (b) planning, (c) time, and (d) adaptations and accommodations. An additional area of focus included a discussion of other influences that might influence student performance outcomes. Classroom Climate One of the issues investigated in this study was the effectiveness of creating a climate conducive to learning. The premise was that a positive classroom climate made it possible for teachers to facilitate effective teaching interventions. Two sub-domains emerged under climate: (a) fostering opportunities for personal interaction and (b) creating engaging learning environments. For the purpose of this study, climate referred to the affective (feelings, emotions) nature of the classroom. Teacher attitudes and perceptions were reflected in their interactions with their students, including participants’ comments about the inclusive classroom and the observable ways in which teachers and students interacted in an environment of understanding and mutual respect. Fostering Opportunities for Personal Interaction The data were replete with examples of a positive classroom climate. The discourse among and between teachers and students revealed a sense of comfort in the classroom environment. In the classroom at School One, W was a gregarious, intelligent, and highly visible young man. He was small in stature and voluntarily participated in class discussions, laughing at himself and others. When one student was slow to give the teacher his height when asked, the general educator asked the reluctant student to come up and stand next to her and then said to
103
him, “If you don’t tell me how tall you are, I’ll put you as the same height as W” (O/SOn-2). The students laughed, probably no one louder than W. Students at School Two (STw) and School Three (STh) appeared to have a comfortable rapport with both the general educator (T1) and special educator (T2). At School Two, a young lady entered the classroom and asked the teacher, “You miss me? You miss me? I did my homework, Miss T1!” In a case of role reversal, students grilled the teacher about her absence from school: “Where were you, Miss T2?” “I was out on Friday.” “Where were you?” “I was finishing something with my house” (O/STw-1). One student at School Three teased her teacher when she believed the teacher thought that students were not on task: “See. You didn’t even think we were doing it [the SOL preparation warm-up], did you?” (O/STh-2). Indira, the designated teacher from School Three, probably best captured the essence of climate in reference to students with disabilities. She remarked that “[S]ometimes with LD students, it’s not how the teacher teaches; it’s not what the teacher teaches; it’s how the teachers present themselves, how the teacher interacts with [the students]. [The students] are into the emotional side of things, and if they don’t click with the teacher emotionally, they shut down.” (T/I-7) In all cases, students freely asked clarifying questions, volunteered to answer questions during teacher-directed instruction, and worked collaboratively with classmates. Creating Engaging Learning Environments Students voiced their appreciation for the practices that teachers used to create a positive, engaging learning environment. There was an overriding sentiment that these were the “type[s] of teachers[s] where if you need help, [they’ll] be there regardless if [they] have something to do” (FG/Th-4). In essence, the student participants shared that their teachers “check[ed] on
104
everybody and never [gave] up on them (FG/Th-4).” One focus group participant from School Three said that the teachers “have two different perspectives. If [students] don’t get way A, they’ll show you B, C, D, whatever” (FG/Th-4). Another student shared, “They don’t just tell us we have to do this and that and that’s it and then they just leave us alone. They elaborate” (FG/O-7). Students noted the fact that their teachers created an engaging climate: “It’s not boring where you can fall asleep; she makes it exciting; she treats us like we’re one of her friends” (FG/Tw-8). One student revealed her pleasure with the fact that the teacher communicated with her family when she shared that “[the teacher] wrote my mom a note and she said I was doing great in the class and my grades were going higher and higher and then last class she gave me an interim with a C plus and wrote my mother a note” (FG/Th-2). As students were finishing up for the period, one teacher engaged a student in a conversation about sports, “You got any skills [in baseball]?” Another student quipped, “I taught him everything he knew in basketball” (O/STh8). Interpretive Commentary on Climate Teachers created a positive classroom climate. They engaged students in friendly conversation, rewarded them for their efforts, and immediately addressed negative behaviors. Participants were able to laugh at themselves and others in friendly, encouraging ways. Teacherstudent interactions had an affective side. Students reported that they felt valued and included in the learning environment. Teachers appeared to encourage all students to participate by calling students by name to answer questions. At two sites, teachers were observed providing positive reinforcement and hands-on, interactive activities. They led students in oral class activities and warm-up drills and used reward systems as positive reinforcement. For example at School Three, the special educator
105
walked around with a basket, allowing students who had volunteered to write homework problems on the white board to retrieve a bonus point card. Bonus point cards could be traded for extra credit points on daily grades, tests, and teacher-generated tests (O/STw-3). Students remarked that effort was key to success in these inclusive environments. “Like say we, if we forget one step, one minor step, if it’s like a huge step they won’t, she won’t give it (the answer) to us, but if it’s like a little step then she might be able to help us out” (FG/O-13). Students did not appear apprehensive when giving answers or asking questions, nor did it appear that they were totally dependent on teachers for their learning. “I’m going to show you an easier way to do this on the calculator, using your favorite numbers. To do statistics on the calculator, first hit STAT. Then go to EDIT” (O/STh-4). The classroom environments appeared to be relaxed and engaging. When students got off task and began to disengage from the learning activities, teachers immediately addressed the behavior. For example, one student would not get busy because he said he forgot to go to his locker to get his materials. The teacher gave him a hall pass and sent him to his locker. When he returned to the classroom, he took out a packet of unsharpened pencils and laid the pencils one by one across the surface of his desk. The teacher went over to him and said, “You’re on your way.” The student asked, “To Time Out?” The teacher responded, “No. To an F” (O/STw-3-4). Then she picked up one of the student’s pencils, walked over to the pencil sharpener and sharpened it, placed the pencil in his hand, and told him to get busy. The student responded by taking his belongings and moving to the back of the room, telling the teacher that he did not want to get into trouble. Observation and interview data indicated that teachers dealt with issues in ways that appeared to foster mutual respect. Interpersonal barriers
106
were not observed or mentioned as impediments to instruction. The classroom environment appeared to encourage student participation in the teaching and learning activities. Planning Planning was the second domain examined during this study. For the purpose of this study, planning focused on teacher preparations for the instructional periods. The premise was that planning should embody focused goals that teachers had for themselves and for their students. Additionally, effective planning should include pre-planning, modifying daily lessons when necessary, and collaborating with colleagues. Two sub-domains were derived from the data, including: (a) coping with curricular constraints and (b) coping with contextual constraints. Coping with Curricular Constraints The planning process varied somewhat from case to case. This process was affected by forces outside the teachers’ control, including state-mandated curriculum and assessment and the lack of consistent school-based administratively scheduled time for teacher planning. The designated teachers were quite aware of the parameters under which they planned learning activities. Jennifer noted that To a certain extent our objectives in algebra are really set by the SOLs. We’ve been watching them (students) all year long, just watching and seeing what they can do and speeding up when we can, not changing the objective, making sure we’re meeting the SOLs but changing the pace, or changing the delivery method. (T/J-2) When asked if students shared in the responsibility of daily planning, Danette stated that students did not: I would say primarily [that students] do not [share the responsibility for planning] because we have the SOLs and the [district’s] Program of Studies. I might have to say
107
that we have to go back over this [content material] because I can’t move on [if students do not understand]. (T/D-1) Indira echoed the same realization of the parameters guiding daily planning: Our classroom goals and objectives are guided by SOL requirements, so [students] don’t really have much to say in what we do. (T/I-3) Teachers articulated the constraints of planning without designated collaboration time for team-teachers. Research suggested that when teachers plan instruction well and treat lessons as meaningful and worthwhile learning experiences, students will view the class as more valuable and interesting (Phillips, Fuchs, Fuchs, & Hamlett, 1996). Students shared their knowledge of the planning process. For example, students mentioned that Students help determine goals [because] teachers follow students’ pace of understanding (FG/O 3-4). Teachers incorporate groups twice a week. [We] work in groups as long as we get work done. Students like small groups [because] there are more people to help you out. (FG/O-6) Students recognized their teachers’ use of planning to maintain momentum during teaching and learning activities. She (the teacher) has everything planned out. Each day students use warm-ups, folders, calculators. (FG/Tw-2) The teachers plan. Each day students use warm-ups, take notes. Teachers give examples. [We have] lots of quizzes. (FG/Th-4-5) Teachers incorporate a lot of groups. If everybody understands, we can work in groups. It’s easier with your partner. (FG/Th-6-7) Planning was an instructional condition that influenced the use of instructional interventions. At the case sites in this study, daily agendas delineating classroom activities and
108
student assignments were posted for teacher and student reference. However, teachers shared that collaborative planning between team teachers, the general and special educators who co-taught in the inclusive classroom, was inhibited due to a lack of time to have substantive discussions about instructional interventions. Coping with Contextual Constraints Teachers had to overcome limited planning time. Because of their expressed and observed dedication to purpose, these educators found ways to plan for their students. Jennifer was pleased that she was in her second year of teaming with the same special educator in the inclusive classroom: I team-taught with the same teacher last year. It allowed me to help her with the content and her to help me with instruction in general. (T/J-5) We find time. We have planning when a lot of our kids have basics skills [class]. So we spend some [of our planning] time with [our students with disabilities]. (T/J-11) Jennifer noted that by spending time with students in their basics skills classes, she and her coteacher were better able to assess student comprehension as well as plan future lessons based on student readiness and individual academic needs. Danette, with input from her team-teacher, shouldered the major responsibility for her team’s planning time with regard to content material to be taught and instructional delivery. This was the first year that Danette and Tracy had teamed together. We [team-teachers] talk outside of class sometimes or she [the special educator] will email me or back and forth. I do primarily, maybe 75% to 80% [of the planning and teaching]. I think being in the math department, I know more of what to have the kids get ready for. (T/D-4-5)
109
According to Indira, she and her partner also had challenges surrounding planning. We [the team-teachers] always talk at the end of the class or at the beginning of class. Or like if I see her in the math lounge or just in passing. She’ll come up here [to the special educator’s classroom] during her planning. Then she’ll talk to me and the same with me. And, what I like about her, she’s flexible. (T/I-12-13) Teachers established routines with which students appeared at ease. Classes at each case site began with a warm-up activity, as a means of engaging students in learning activities as soon as they entered the classroom. A list of daily activities was written on the white boards in each classroom, giving students an overview of the teaching-learning activities for the instructional period. Team-teachers made an effort to touch base with one another, although most often planning sessions were informal discussions about lesson activities and obvious student needs. Interpretive Commentary on Planning Although the teachers in this study made time to check with each other regarding their students, contextual variables restricted their capabilities to plan collaboratively during the work day. For example, there were no observations or discussions of students being grouped based on skill level and taught by teachers in small groups to build skill acquisition and understanding. Rather, students worked in small groups with classmates, and teachers circulated throughout the classroom clarifying confusions and answering questions. The research pointed out that if teachers had sufficient time to plan, discuss student performance, and review mathematical concepts that would be presented during class sessions, a more targeted or individualized level of instruction for students could occur. Gersten, Keating, Yovanoff, and Harniss (2001) found that an area of weakness in the instructional program occurred when placing students with disabilities
110
in the general education classroom without providing time for teachers to plan for and collaborate about the strategies and practices or time to develop a model of instruction. Time The availability and use of time was another domain that was investigated during this study. The premise was that allocated, academic engaged, and active academic responding times were measurable by direct observation. For the purpose of this study, time was the one alterable variable that teachers could control, with particular attention to assigning the right amount of work for the allotted amount of time. Instructional time had to be scheduled, allocated, and used in a way to keep students engaged and interested in the learning activities. Using time efficiently and effectively surfaced as a sub-domain of time. Using Time Efficiently and Effectively Time coincided with planning in that efficiency proved to be a principle concern in the inclusive classroom. Because of the number of students in the classes, small-group activities or whole-class instruction provided a more efficient means of instruction than individualized, oneon-one instruction. Teachers decided whether or not to use small-group activities and collaboration or whole-class instruction, based on their professional assessments. [Feedback] is partly through that sort of interactive lecture kind of format and partly through, we always have some sort of practice activity, a worksheet or a set of problems or a little activity that we’ll circulate one-on-one and check on how they are doing. (T/J5) By the [students’] desks being [arranged] together, they work in groups anyway. When I am leading discussion and giving students notes, I’ll say, ‘Okay, you guys do this one,’ and they’ll copy it down. When I’m leading discussion, I make them take notes, not just
111
watch me, because then they really think about it and not just blindly watch [me teaching]. (T/D-3) We (the general and special educator) will both go around and check problems and that will be a stamp. A stamp is worth a classroom grade. Or I (the special educator) go over the homework or once [the general educator] has taught the lesson, I’ll go around and check [for understanding]. (T/I-5) The amount of time teachers spent engaged in teacher-directed instruction appeared to be similar across the cases. Jennifer expressed the need to be comfortable with the level of student comprehension before leaving students to work independently: On an average I’d say probably about half [the time is used for teacher-directed instruction]. Some days none. Other days when it’s something brand new, when it’s something really complicated, I’m still a little bit nervous about sort of letting them lose. Even when I’m up there [directing instruction] or the special educator is up there, it’s (class activity) still very interactive. (T/J-4) Danette also described an instructional period as a combination of teacher-directed instruction and small-group and one-on-one activities: Fifty percent to 75% of the time [is consumed with teacher-directed instruction] because half the time they are working and I’m going around helping them one-on-one. We’ll have a review game before a test or something. It’s hard to keep them on task sometimes. . . . When it’s a race for extra credit, then they really are on top of it. (T/D-2-3) Indira agreed with her colleagues about the amount of time used for teacher-directed instruction: I would probably say 50% [of the instructional time is teacher-directed] because the math teacher (general educator) may go over the concept and then she’ll give [the students]
112
some practice problems. And then we’ll both go around the room and check problems. (T/I-5) Teachers across the cases appeared to use time efficiently and effectively. They seemed to have an appropriate balance in whole group versus small group instruction. They shared concerns about how monitoring student comprehension during teacher-directed instruction influenced the time that was appropriated for small-group activities. Both general and special educators circulated throughout the classrooms to answer questions and clarify confusions. Students noticed their teachers’ use of time. At each case site, students believed that instructional time was student-centered. Students from School One shared the following: We usually start off with warm-ups and homework. We ask [the teacher] if we [are having] any problems. [If we have] any questions, [the teacher] will review those questions that we have problems with. [The teachers] will give us something else to do and go over and help [other students]. Then they go back to what they were doing, what they were teaching us. (FG/O-3-10) Students from School Two remarked that: [The teacher] has everything planned out. I like small groups best because sometimes when we get to the hard problems, after the teacher explains it, man, I just want to sit there and work with somebody else too, to watch and explain. (FG/Tw-2-3) Finally, students from School Three noted an established routine: We come in and sit in [our] seats. [The teacher] will tell us what’s going to happen today. We’ll take a couple of notes. She shows us examples. If everybody gets it, then we can work in groups. (FG/Th-5-7)
113
Teachers across the cases employed similar instructional formats. These formats included varied use of the time allotted for instruction. First, teachers employed teacher-directed instruction wherein they called on one student at a time to answer specific questions. Secondly, teachers facilitated teacher-led activities wherein students wrote answers to the warm-up activities or homework assignments on the board. Third, teachers facilitated one-on-one activities among student peers and small-group activities as students worked in groups of three of more on an assignment. Finally, students engaged in independent seatwork, completing worksheets, quizzes, or tests. Interpretive Commentary on the Use of Time It appeared that teachers used their allotted instructional time to benefit student learning. Each class session began with a warm-up activity that reviewed a skill or skills that had been previously taught or assigned for homework. These skills were all based on prescribed standards for which students would be responsible on end-of-course tests. Then through direct instruction, teachers used step-by-step processes to explain mathematical concepts, to get feedback from students, to answer questions, and to clarify confusions before giving students the freedom to work in small groups with their peers. Established routines were evident, including the ease with which students were observed moving into partner or small group activities. As teachers implemented strategies, they also monitored student readiness and instructional appropriateness of whole-class, small-group, or individual learning activities.
114
Adaptations and Accommodations Inclusive classrooms provided a continuum of services based on the individual needs of students. The creation of these classrooms addressed the philosophy that all children have a right to access an appropriate education in the least restrictive environment. Collaboration between general and special educators to support students in the inclusive classroom strengthened the services provided to students. Students in inclusive classrooms appeared to benefit from instructional interventions that were adapted to accommodate individual student needs. Consequently, teachers’ use of adaptations and accommodations was another domain examined during this study. The premise of examining teacher use of adaptations and accommodations was that if teachers appropriately chose and applied teaching actions after student assessments had revealed a lack of student success, student achievement would improve. For the purpose of this study, adaptation referred to the process of adjusting instruction to meet the individual needs of students; accommodations referred to modifications or alterations made in instructional delivery and materials. Two sub-domains related to adaptations and accommodations appeared in the data: (a) integrating adaptations and accommodations to benefit all students and (b) incorporating teaching actions that monitor student comprehension. Teachers in this study adapted instruction with the use of collaborative group activities, improved questioning techniques, hands-on learning activities, and one-on-one instruction. Integrating Adaptations and Accommodations to Benefit All Students Teachers appeared to be aware of the instructional responses that their students needed and adjusted their teaching strategies and practices to meet those needs. At each case site, teachers demonstrated that the most appropriate instructional response for teaching a class of
115
students with diverse abilities was to incorporate and use varied teaching methods deemed beneficial for students with disabilities with all students. Jennifer pointed out that Most of the LD (learning disabled) students that come into math classes don’t have math [IEP] goals. So we do not directly relate [math instruction] to the IEP, but relate to some of the kids’ [processing] disabilities. We try to do some writing activities, some oral presentations. (T/J-3) Danette, a general educator, shared that she read the IEPs developed for her students with disabilities as she determined what interventions could be easily integrated into the instructional conditions. When I get the IEP, I read it over and make sure they are maybe sitting in the front row, things like that. A lot of the kids in here need extra time. . . . I let them stay after, but I also do that for regular kids because some of them are slow workers. Saying things and writing them down, I try to cover all the bases. (T/D-2) Indira, a special educator, agreed with her general education colleagues that the most appropriate instructional response for inclusive classes was to integrate strategies and practices that would enhance achievement for students with disabilities into the daily teaching repertoire. I have my students in [the inclusive classroom], and I give her (the general educator) copies of their accommodations at the beginning of the year. So we try to accommodate [the students with disabilities] in our lesson plans. We just try to integrate, to facilitate learning for everyone. (T/I-5) As found in the research literature review (Stodolsky & Grossman, 2000), these teachers articulated the need to adapt instructional strategies or to provide appropriate accommodations to meet student needs. These teachers reported adaptations in instructional techniques, assessment
116
and grading, and relationships with students. However their basic instructional strategies and curricular materials were unchanged. Teachers and students reported that teachers offered more time for practice, reduced the amount of content, when necessary, and paced instruction to facilitate student success. Teaching Actions to Monitor Student Comprehension Several factors were considered by teachers in their efforts to adapt instruction and accommodate student learning, including instructional presentation, checks for understanding, practice, and feedback. As noted in the sections on planning and use of time, teachers were keen to present clear explanations of content material, model learning activities, provide motivational techniques, and appropriately pace instruction. Teachers used various methods to monitor student comprehension. After daily warm-up activity sheets were completed, teachers led students through content reviews, calling on students to explain answers or to demonstrate problems for the class. Teachers used overhead projectors, white boards, and graphing calculators to support oral and written explanations. Teachers used reward systems as motivational techniques, either as a part of the learning activity or for student contributions during small-group activities. These teaching actions appeared to foster positive responses from students. Some students reflected personal experiences that might or might not have held true for other students, related to the way in which teachers presented instructional skills and activities. Data from each school reinforced this fact. Students from School One appreciated that their teachers fostered understanding: [Teachers are concerned with] what we’re learning because we need to know. They elaborate. They stay with you until you get it. (FG/On-7-8)
117
At School Two, students noticed that teachers closely monitored student understanding: She does another example, sending people to the board. She’ll come around and check. Check everybody. [They tell us to] come back after school. (FG/Tw-5-7) Students at School Three noted that teachers extended their accommodations outside of the scheduled instructional period: They’ll make sure [you understand] or they’ll tell you to stay after school. . . . If you and your partner understand and someone across the room doesn’t understand, then you’re working and teaching to them. [Teachers] stay after school or come in during lunch. She goes over the test the next day. (FG/Th-9-11) Because teachers solicited feedback from all students during teacher-directed or one-onone activities, students appeared comfortable with seeking help when needed. Students remarked that teachers were more concerned with what they were learning than with covering content because teachers paced instruction to accommodate student comprehension. Teacher actions used to monitor student comprehension, such as asking students to explain mathematical concepts to their peers during review sessions, appeared to foster an environment where students were willing to take risks and openly engage in the teaching and learning activities. Interpretive Commentary on the Use of Adaptations and Accommodations Classroom observations revealed that teachers adapted their instructional methods to address the needs of groups of students as well as individual students. As they mixed whole-class instruction with collaborative learning, including immediate feedback to students, these teachers encouraged students to take responsibility for themselves and to make critical decisions about their academic needs. For example, the need to come after school or during lunch for extra help
118
was an option given to all students. Students at School One acknowledged their teachers' offers for extra help: Sometimes [they stay] after school. Some people stay there and get extra help. And they’ll stay after school or after one of [their] classes. (FG/O-8) One student at School Two said that it depended on whether or not he understood as to whether or not he came back for extra help: Sometimes I don’t come back [for help after school]. Like if I understand [the mathematical concepts] real well, I mean, I feel like I don’t need it. (FG/Tw-7) Students at School Two also shared their appreciation for their teachers’ offers for extra help: We don’t worry about tests because we know if everybody doesn’t understand it or if some people don’t understand it, you get to take the test over. Going back [after school] and seeing your old test and seeing where you messed up helps you prepare. (FG/Th-1314) Schumm and Vaughn (1991) found that many teachers believe that instructional adaptations are desirable but not feasible. However, teachers in this study chose to integrate instructional adaptations and accommodations for students with disabilities into the daily teaching and learning activities for all students. This daily integration of instructional interventions enhanced the likelihood that teachers adapted instruction to address student needs. Consequently, the students voiced their recognition and appreciation for teachers’ efforts. Other Influences: Participants' Reflections and Insights During the interview process, study participants reflected on other variables that could impact student learning. Based on their teaching experiences, teacher participants in this study reflected on factors and behaviors both inside and outside of the learning environment that may
119
impact student learning. Students also shared their perceptions of variables that could hinder student success. These sub-domains included (a) teacher training, (b) student behaviors, and (c) student placement. Teacher Training Teachers shared that they had not participated in some of the training opportunities provided by the school district. Although the teachers appeared to diversify their instructional strategies and practices, they did not report any required training for teachers co-teaching in the inclusive classroom. Jennifer admitted that Last year we did a team-teaching seminar. It was March of last year. We were supposed to do it again this year and I didn’t. Maybe they (other teachers teaching in the inclusive classroom) did it, but I didn’t go. (T/J-11-12) Danette voiced the same attitude toward the voluntary training offered to teachers: We’ve had some training. I don’t think it really better prepared me [for the inclusive classroom]. The training is like at the beginning of the year when you’re so frazzled and crazy anyway. You’re really irritated that you have to go to this meeting and you can’t be in your room. (T/D-3) However, Indira, a special educator, saw the lack of training as a problem for ensuring effective teaching in the inclusive classroom: I don’t know if it’s because I’m a veteran [special education] teacher. I haven’t received any required training. You take it voluntarily if you want it. The district offers [training] to Special Ed [teachers], not the regular teachers, and those are the ones who really need it. (T/J-12-13)
120
Effective teacher training for teachers co-teaching in the inclusive classroom could cause teachers to examine their attitudes and practices for meeting the needs of diverse students. As evident in the literature review (see Chapter II), research suggested that when teachers plan instruction well and treat lessons as meaningful and worthwhile experiences, students will view the class as more valuable and interesting (Phillips, Fuchs, Fuchs, & Hamlett, 1996). Teacher training also influenced teachers’ feeling of success in the classroom, including preparation to function within a specific job design (Gersten, Keating, Yovanoff, & Harniss, 2001). Job design referred to the way work was structured, including the way it was staffed, scheduled, and generally organized. Team-teaching was a form of job design. Quality of job design was a function of the degree to which the structure and processes established for doing the work facilitated the successful completion of assigned tasks and responsibilities. A focus on working conditions “was particularly important in special education since job design has been shifting so radically in recent years with the move toward inclusive classrooms and greater collaborative efforts between general and special educators” (Gersten et al., 2001, p. 553). Imposing a job design without adequate training might prove to be counterproductive to the desired goals of the design, efficient and effective use of time, and enhanced student success. Student Behaviors Negative student behaviors could range from apathy to severe disciplinary infractions. Making sure that students recognized the importance and relevance of the work they were asked to do was essential. Sensitivity to students’ individuality and appropriate expectations contributed to their achievement (Kauffman, 1997). When students were deprived of opportunities for success, they expressed their frustration through troubled behavior. Additionally, participants agreed that student absenteeism due to inappropriate behavior could
121
cause students to miss skills and concepts needed to achieve. Study participants addressed student behavior as follows. To begin with, at School One, Jennifer shared one example of the negative impact of student behavior: One of the learning disabled students is not passing. She has a D and F [respectively] for the first two quarters, but she was suspended for three weeks in the third quarter and she ended up failing for the third quarter. (T/J-2-3) The students at School One noted that student behaviors could impact student performance. When asked to give the characteristics of a successful student, students responded as follows: They stay after school, pay attention, [do not] joke around [in class]. They ask questions and do homework. (FG/On-11-15) At School Two, Danette cited instances that could work for and against students with and without disabilities: When they (students) have disabilities, their parents may be more aware, so they’ll get a tutor. Some students are just conscientious, and they are always going to have their work and want to learn. They do their homework. But it’s really sad to see a lot of them just wasting their time. (T/D-12-15) Students from School Two shared some of their teacher’s considerations: [Students have to] make sure [they] understand what [they’re] doing or try to learn more with another problem, ask questions, do homework, and study what [they] don’t know. (FG/Tw-7-8) At School Three, Indira spoke of troubling student behaviors coupled with the unrealistic expectations related to student performance outcomes on standardized tests:
122
I had this student who got into trouble because he had a knife on him. He may not be coming back because he’s been acting really weird. . . . Statistically, it’s impossible if you start here [with really low achievement scores] to get there [grade level or high achievement scores]. Then they (school officials) are looking at the teacher. [Students] may have moved up (improved in achievement), but their SOL scores are still [below passing]. (T/I-8) The students at School Three believed that "You have to think of what you’re doing wrong and realize what you need to get to learn, homework. It comes to being yourself, avoiding peer pressure" (FG/Th-15-16). Students with disabilities have had almost twice the rate of dropping out of high school as their peers without disabilities. This could be true of students with learning disabilities or emotional disturbances. Students with disabilities who stayed in school and got effective programs moved on to higher education and employment at increasing levels (Hehir, 1999). Student Placement IEP committees charged with identifying and recommending individualized education programs for students with disabilities made decisions related to appropriate student placement. For decision-makers confronting LRE, problems occur when there is confusion about what a learning environment is restricting in the first place, educational opportunity or social integration. A critical distinction exists between providing services which allow a student access to the content of the general education curriculum--such as various services, supports, and accommodations--versus actually incorporating that general education curriculum into an IEP. (Crockett, 1999, p. 563)
123
As discussed in Chapter III (pp. 54-56), the school district delineated and published specific criteria for student eligibility for special education identification and placement. Placement decisions were left to the members of the IEP committee which included special educators, general educators, parents, and students. Teachers who participated in this study supported students with disabilities being a part of the inclusive classroom, as long as these students were appropriately placed: At School One, Jennifer shared that she would be concerned If students with disabilities were labeled LD and funneled away from the general education curriculum, because some of them are gifted in math despite their learning disabilities in other areas. (T/J-8) Danette acknowledged that When you put students with and without disabilities like this [in the inclusive classroom], you have to make sure they are picked correctly, are good workers. If [students with disabilities] are not going to make the effort to try then they are not going to do well, because the [inclusive classroom] is such a larger setting [than the self-contained classroom]. (T/D-5) Indira, the special educator, agreed with her general educator peers. She characterized the inclusive classroom as a classroom For kids who are a little bit more focused, who can go at a faster pace, and who don’t get into personalities. [Students with these traits] are more likely to do better in an inclusive classroom as opposed to someone who has the same academic ability but are more mentally and emotionally in need of that type of relationship and rapport with the teacher. (T/I-7)
124
The premise was that responsible inclusion is student-centered and based on student needs. The inclusive classroom was just one service provided in a continuum of services. Because IDEA (1997) has mandated that all students have a right to an appropriate education in the least restrictive environment, the focus on “appropriate” placement is key. The reflections in this section were recorded during the interview process with teachers and student focus groups. The interview questions (see Appendices D-E) that yielded these reflections were: (a) Describe any training or coursework in which you [the teacher] have participated that better prepared you for the inclusive classroom.; (b) What are the characteristics of a successful student?; and (c) Is there any information that you would like to share about your inclusive classroom that was not covered in the structured questions? Interpretive Commentary on Other Influences Although what happened between teachers and students in the classroom environment seemed to influence academic success in this study, both teachers and students cited contextual factors inside and outside of the school environment that might impact student achievement and performance. First, teachers’ lack of enthusiasm to participate in voluntary training might have been due to the timing and effectiveness of the training being provided. A more comprehensive, mandatory training program for teachers might have influenced the way teachers planned and adapted instructional strategies and practices. A needs-based training program also may have enabled teachers to address student behaviors that impacted student success and raised teacher awareness to available resources. However, most cognitive theorists and researchers have acknowledged the role that affective factors, e.g., feelings and emotions, play in learning and behavior. Accepting the relationship between affect and cognition could prove to be critical to understanding the nature of the inclusive classroom and addressing behaviors that hinder
125
academic achievement (Montague, 1995). Although there could be many benefits to placing students with disabilities in inclusive classrooms, educators should appropriately assess students to ensure that placement in the inclusive classroom is the most appropriate placement for the student to progress academically and socially. Discussion In this section of the chapter, the prominent domains including instructional conditions and teacher interventions were correlated to the theoretical framework (see Figure 3.1, p. 46). The review of literature revealed that effective teachers created instructional conditions that offered opportunities for beneficial teacher interventions in the inclusive classroom. The four major approaches that were addressed in the research literature also formed the basis for the domains of the theoretical framework for this study. Because of federal and state legislation that emphasized teacher and student accountability in the form of student performance on standardized end-of-course tests, educators were compelled to address the need for eclectic teaching strategies and practices to enhance student learning. However, as delineated in the theoretical framework, educators should address both the behavioral and cognitive factors that influence student success. Addressing the behavioral challenges that evolved as a result of a child’s environmental conditions and social interactions was equally as important as academic instruction. Whether or not the inclusive classroom was the place to address academic or behavioral challenges was a decision that IEP eligibility committees made after conducting a comprehensive review of students’ demographic data. Additionally, the reauthorization of the Elementary and Secondary Education Act (ESEA) referred to as the No Child Left Behind Act (NCLB) of 2001 upheld the federal government’s continued agenda to improve the public education system through an infusion of
126
standardization and teacher training. To begin with, standardization posed challenges for some students. Although teachers could easily make adaptations to their grading practices by basing grades on process rather than product, the amount of improvement, progress on IEP objectives, weights based on assignment and ability, and criteria defined in individual student-teacher contracts, conditions for standardized curriculum and assessment programs could prove unfavorable to students with disabilities. Many students with disabilities were unable to display their true knowledge and skills when taking tests under standardized conditions. In this study, 74% of students with disabilities passed the course as assessed by teachers, but only 47% passed the standardized end-of-course test. With student performance on standardized tests in mind, federal officials have mandated teacher training as one remedy to address achievement gaps between high-performing students and at-risk sub-groups, including some students with disabilities. NCLB now makes teacher training mandatory. Based on the data collected in this study and the literature review in this report, teachers did vary instructional formats, including whole-class instruction, small group instruction and activities, and individual tasks as well as focus on their need to give clear instructions and check for understanding. These strategies and practices, however, evolved from trial-and-error during teachers' classroom experiences. Teacher training should center on how teachers use planning time, including collaborative discussions related to student ability, ongoing reviews of student performance data to determine teaching goals and objectives, teachers' knowledge, and use of instructional interventions. Prominent Domains The prominent domains in this study revolved around research related to teaching practices and strategies used in the inclusive classroom. Stodolsky and Grossman (2000) found
127
that individual attributes made teachers more likely to consider using new approaches with students and to seek opportunities to learn new strategies. Johnston-Wilder, Pimm, and Westwell (1999) surmised that teachers face the challenges of responding successfully to diverse learners, building a strong professional community, and maintaining a conversation within schools and departments that can provide necessary support and resources for teachers as they experiment with their teaching. With the call for teachers to respond to a changing student population, Senger (1999) found the internal processes that teachers experienced as they navigated change to be critical to researchers and educators in this era of school reform. To that end, Johnston-Wilder et al. (1999) reminded educators that children are to be treated as individuals and allowed to learn at different rates and that it is important to recognize and celebrate student and individual successes so that criteria-based assessment may be well received. Thus, study participants addressed the domains of climate, planning, time, accommodations and adaptations, and other influences, including teacher training, student behaviors, and student placement. Participants shared their perceptions of how these major domains impacted teaching and learning as well as insightful experiences related to the inclusive classroom. Relating the Findings and Research to Climate Teachers and students noted the importance of a positive classroom climate. Each of the teachers offered incentives, such as bonus points and verbal praise and encouragement, to students who contributed to the class discussion and completed assigned activities. As substantiated in the data gleaned from student focus group interviews, students from each case considered their teachers to be “nice, helpful, and courteous” (FG/On-2-3; FG/Tw-3-4; FG/Th-34). Students also mentioned their appreciation of the praise and performance incentives that teachers presented to members in their classes (FG/On1-2; FG/Tw-1; FG/Th-2-3).
128
The participants’ perceptions of the inclusive classroom corroborated the findings in the research literature. Frederico, Herrold, and Venn (1999) encouraged teachers to create classroom environments wherein the teacher maintained a sense of humor, treated the inclusive class as “our class” instead of “my class,” used appropriate behavior management, and treats all students as equals. Alper, Fendel, Faser, and Resek (1997) proposed that one way to make many students feel comfortable in the classroom was to create an environment with more student interaction, wherein students could speak in a relaxed way with each other during learning activities. To that end, Alper et al. (1997) proposed the use of heterogeneous groups so that each student could hone and add personal strengths to problem solving. These mathematicians suggested that having students work in groups allowed them to pool their strategies and develop their own problemsolving procedures. The participants in this study seemed to associate a positive classroom climate with academic success. As stated by the special educator (T/I-7), affect is an important element of the inclusive classroom. Faced with students of diverse abilities in the inclusive classroom, teachers were wise in developing positive interpersonal relationships between them and their students, and among student peer groups. This study yielded evidence that small-group, collaborative learning can benefit some students in heterogeneous groups. Teachers supported students and encouraged them to take the risks in sharing confusions and articulating any lack of understanding with their peers (Haager & Vaughn, 1995). Through the use of praise and consistent feedback, teachers enabled student peers to feel comfortable contributing to interactive peer discussions about mathematical skills and concepts. When teachers had to spend time individualizing instruction one-on-one, student engagement in the learning activities remained productive as peers facilitated each other’s understanding and learning.
129
Relating the Findings and Research to Planning Study participants agreed that instructional planning was the responsibility of the teachers. Because the curriculum had to be aligned to standardized assessments, instruction needed to be paced and sequenced to meet timelines for accountability measures. Therefore, students agreed that it was most feasible for teachers to plan the instructional period (FG/On-6; FG/Tw-2; FG/Th-4-5). Demonstrated through class observations, students moved easily from direct instruction to small-group activities. Furthermore, teachers concurred that students dictated the pace and sequence of instruction, as teachers monitored student understanding to determine when to modify teaching and learning activities (T/J-2; T/D-8; T/I-15). To facilitate adequate teaching and learning modifications, teacher planning should include various stages. Noted researchers found cooperative short-term and long-term planning to be an effective tool for teachers of the inclusive classroom. Schumm, Vaughn, Haager, McDowell, Rothlein, and Saumell (1995) found that if the interventions developed for general educators’ use with students with learning disabilities required preplanning that could not be used with the entire class, then teachers were unlikely to be successful using those interventions. Consequently, Schumm et al. concluded that the development of collaborative relationships between general and special educators has been shown to increase the perception among general educators that they can provide effective services to students with disabilities. Phillips, Fuchs, Fuchs, and Hamlett (1996) found the following five variables to distinguish the planning and instruction of the effective teacher: (a) instructional pacing and format, (b) active student involvement, (c) delivery of planned activities, (d) motivational strategies and emphasis, and (e) judgments of student learning.
130
The lack of time provided by administrators for planning between general special educators hampered teachers’ ability to maximize the cooperative approach to instructional delivery (Schumm et al., 1995). Teachers disclosed that “we talk outside of class sometime or email back and forth” (T/D-4-5) or that “we talk at the end of class or at the beginning of class” (T/I-12-13). Evident in each classroom was the fact that special educators often had to seek clarification from the general educator before they could, or at least appeared confident enough to, answer student questions related to the content material. Yet, because of the positive classroom climates, the teachers’ asking questions of clarity modeled behavior for students: If you don’t know, ask. Based on data collected during field observations and from interviews, it was evident that teachers created a learning environment with established routines that maximized student time on task. Materials needed for learning activities were ready and available as the class made transitions from one activity to the next. Students seemed contented with either teacher, the general educator or the special educator, assisting them. On the other hand, teachers did not have administratively scheduled time to analyze a substantive problem such as how the special educator could work with small teacher-directed groups to re-teach algebraic concepts that students had difficulty grasping. Relating the Findings and Research to Time The teachers who participated in this study also identified the use of time as a strategy to maintain a productive learning momentum. Students agreed that their teachers spent time throughout the instructional periods helping individual students and checking for student comprehension (FG/On-6-7; FG/Tw-4; FG/Th-9). Noted during the classroom observations, teachers monitored student time on task, using proximity and name recognition to maintain a
131
productive teaching-learning momentum. Uniformly teachers and students conceded that the majority of the instructional period involved teacher-directed instruction. One teacher articulated that she was “still nervous about sort of letting [students] loose to [work in groups]” when presenting complex mathematical concepts (T/J-4). The same issues surrounding the use of time that appeared in the data from this study were also cited in the research literature. Researchers stressed the importance of planning and using time discreetly. Christenson, Ysseldyke, and Thurlow (1989) considered time to be an alterable variable over which educators had some control and influence. Christenson et al. suggested that it was the use of time and not the quantity of time that was important. Florian (1999) agreed that adding academic time to classrooms where time was not well utilized did not produce gains in student achievement. To that end, teachers in this study spent time upfront explaining mathematical concepts, checking for student comprehension, and leading students in whole-class activities before depending on small-group interaction as a means of reinforcing student learning. Teachers addressed their use of time through their organization of the instructional period. Scheduled time was the time the teachers planned to spend in various activities. Allocated time was the amount of time actually devoted to various activities and tasks for the student. Academic engaged time was the time spent by each student making different kinds of academic responses. Active academic responding time referred to the time spent by a student making active, observable learning responses (Christenson, Ysseldyke, & Thurlow, 1989, p. 25). Allocated, academic engaged, and active academic responding times presented a picture of what actually occurred in classrooms and what was measurable by direct observation.
132
Teachers continually monitored student progress and understanding during the instructional period by checking for understanding during teacher-directed instruction and circulating around the room during small-group or individual activities. Their efforts to vary the use of time in the instructional period included activities to meet diverse student needs. The use of whole-class and small-group activities addressed student comprehension and allowed teachers to present material in a structured manner. Teachers allocated time to model and demonstrate mathematical concepts. Academic engaged time was used to employ guided practice, including interactive lesson reviews, the use of the graphing calculator, and active student participation in explaining steps used to solve algebraic problems on the white board. Active academic responding time was used as teachers and students interactively engaged in extensive questioning and dialogue. Relating the Findings and Research to Adaptations and Accommodations Teachers used adaptations and accommodations to facilitate student learning. During the observed class sessions, teachers used white boards, electronic smart-boards, or calculators with projection screens to introduce and explain content material. Students copied notes as teaching and learning activities progressed. Each case included team-teachers who circulated throughout the classrooms answering questions and clarifying confusions. Students noted that these teachers “make sure you understand or tell you to stay after” (FG/Th-9-10) and “elaborate; they’ll stay with you until you get it” (FG/On-7-8). The use of adaptations and accommodations was cited in the research literature as paramount in facilitating student learning (Friend & Bursurck, 1996). Keel, Dangel, and Owens (1999) found that teacher-directed interventions could be implemented with the whole class or in small groups. Alper, Fendel, Fraser, and Resek (1997) suggested that having students work in
133
groups allowed them to pool their strategies and develop their own problem-solving procedures. However, Vaughn et al. (1995) cautioned that grouping practices needed to reflect students’ learning styles and that students believed that changing the pacing or sequencing of instruction facilitated their learning. Finally, Middleton and Goepfert (1996) urged teachers to abandon the lesson plans when activity flow was threatened and rely on their information about the students’ prior knowledge. Unfortunately, Vaughn and Schumm (1994) found that secondary educators reported a desire to initiate more accommodations but did not feel equipped to do so. This study demonstrated that teachers’ use of adaptations and accommodations increased student participation and comprehension (Friend & Bursuck, 1996). The use of strategies that addressed varied learning styles ensured that all students engaged in learning activities and methodologies that included individual student needs. Teacher notes or material projections to overhead screens accompanied all teacher explanations. Direct instruction to introduce content material and to check for understanding preceded small group instruction and activities. Simultaneous access to both a general educator and a special educator afforded students more opportunities for immediate teacher feedback, given that the presence of two teachers reduced the student-teacher ratio. Teachers consistently monitored student needs and encouraged peer tutoring. Without participating in voluntary training opportunities, teachers relied on their knowledge base to make adaptations and accommodations for students. Teachers shared that they literally learned through experience. As documented in the research literature, when general educators could not use the same interventions requiring preplanning that they developed to address the needs of students with disabilities with the entire class, they were unlikely to be successful using effective instructional strategies that benefit all students (Schumm et al., 1995).
134
CHAPTER V CONCLUSIONS, IMPLICATIONS, AND RECOMMENDATIONS The purpose of this study was to examine the instructional practices used by teachers whom administrators deemed successful with students in the inclusive Algebra I classroom. Research questions related to strategies and practices that teachers used in the inclusive classroom to enhance student learning were derived from the theoretical framework based on Skinner’s (1953) behavioral learning theory coupled with Gagné’s (1985) cognitive learning theory. The framework addressed five prominent domains: classroom climate, teacher planning, use of time, adaptations and accommodations, and other influences, including teacher training, student behaviors, and student placement. Results of this study both supported and added to research findings previously reported in the literature review. The objective of this chapter is to present (a) conclusions drawn from the study, (b) implications and recommendations for teaching practice, and (c) recommendations for further research. Conclusions Data related to practices and strategies used in the inclusive classroom were collected through observations, interviews, and document analysis in three high schools in a suburban district in Virginia. The results confirmed research findings previously reported in the literature review. The following conclusions highlight the need for ongoing examination of teaching practices and strategies used in the inclusive classroom. Conclusion 1: The Selected Domains The study of the four domains associated with instructional conditions and interventions presented in the framework yielded mixed results regarding effective teaching practices and
135
strategies in the inclusive classroom. Instructional conditions selected for the purpose of this study included climate and planning; instructional interventions included the use of time and the use of adaptations and accommodations. Based on findings in this study, the following assertions can be made. Teachers created a positive classroom climate without structured planning time. Students and teachers cited specific examples of teacher adaptations in instructional techniques and assessments and grading. Additionally, teachers offered more time for practice, reduced the amount of content to be covered, and paced instruction according to student comprehension and readiness. As noted by Keel, Dangel, and Owens (1999) and practiced by teachers who participated in this study, in designing an instructional strategy, the teachers first determined the prerequisite skills necessary to meet stated objectives. The teachers in this study taught easier skills before the introduction of more difficult ones, and used daily warm-up activities and homework review to gauge student understanding. However, their basic instructional strategies and curricular materials were unchanged, as teachers reported that they planned instruction in accordance with departmental goals and timelines. Also, there was a significant achievement gap between general education students and students with disabilities as illustrated by end-of-course assessments. Conclusion 2: The Achievement Gap There remains a need to investigate instructional strategies and practices that address the achievement gap between students with disabilities and students without disabilities. Approximately 86% (32/37) of the general education students passed the Algebra I course, and about 74% of the students with disabilities passed the course. Consequently, there was a performance gap of 12% between general education students and students with disabilities on teacher-generated assessments. Approximately 78% of the general education students passed the
136
standardized end-of-course test, while only about 47% of the students with disabilities passed. Thus, there was a 31% performance gap between general education students and students with disabilities. The sizable performance gap on standardized tests versus the less sizable performance gap on teacher-generated assessments may be attributed to several factors. For one, teacher interventions during and following teacher-based assessments afforded students the opportunity to improve performance results. These interventions included adapting grades for showing improvement, changing how much certain things count towards report card grades, and grading some students using a different grading scale (Bursuck, Munk, & Olson, 1999). Also, while teachers prepared students for the content material included on end-of-course tests, they continued to intervene and make adaptations as students completed practice tests. Because some students have difficulty with the format, conditions, and comprehensive content recall used for standardized testing, teachers’ efforts to simulate realistic standardized testing conditions for students were often displaced by their efforts to accommodate student learning and improve final outcomes. Conclusion 3: Teacher Training Team-teachers could benefit from a well planned and well implemented training program. Teachers at each case site remarked that they did not attend voluntary training offered by the school district focused on effective strategies and practices for the inclusive classroom. They cited the timing and the content of the training sessions as disincentives. The lack of mandatory teacher training affected the level of teacher planning as well as teacher use of adaptations and accommodations for students. In addition, teachers in this study agreed that the general educator planned lesson activities with some input from special educators. Thus, special education staff was not being effectively employed. Although designated teachers remarked that
137
they recognized the need to differentiate instruction based on student need, there did not appear to be a cohesive or comprehensive analysis of student data nor an appropriate use of resource personnel. Conclusion 4: Diversity in the Inclusive Classroom Factors other than those addressed in the framework domains of this study influence student achievement. The following criteria were used to choose study participants: (a) the schools’ SOL test results; (b) administrators’ perceptions of teacher effectiveness in the inclusive classroom; and (c) the model of instruction: team teaching. Consequently, student participants were determined by their enrollment in the selected inclusive classrooms. Student data such as race, gender, socio-economic status, or individual work habits were not considered for this study. Because some students with disabilities received final course grades of A (94-100) and passed the standardized end-of-course test, just the fact that a student had a disability did not necessarily indicate inhibited student achievement or performance. The inclusion of additional student demographic information might provide a more comprehensive profile to be considered along with student achievement. As for the teachers, a more detailed survey of teacher participants' professional preparation could distinguish administrative recommendations of teachers used for study based on teacher affect versus teacher effect. A survey could include teachers' years of experience, a historical record of their students' performance, and documentation of their instructional strengths and weaknesses. Implications and Recommendations for Teaching Practice Several implications and recommendations for practice that may be valuable to general educators, special educators, and school administrators can be drawn from this study’s conclusions. These implications and recommendations are as follows:
138
1. Implication: Teachers in this study planned fleetingly because of a lack of scheduled planning time provided by the administrative staff. The lack of consistent planning time inhibited time for collaborative reflection related to specific instructional conditions and interventions. Recommendation: Despite the complexity of building a master schedule, administrators should consider arranging appropriate pre-planning and planning time for teachers to structure and implement learning activities based on student needs and abilities in an inclusive classroom. 2. Implication: Some training was provided to teachers, but general educators chose not to participate. Recommendation: School leaders should work closely with curriculum specialists, special education administrators, and planning and assessment specialists to develop mandatory staff development and training programs for teachers working in the inclusive classroom. 3. Implication: Special educators in team-taught inclusive classrooms rarely planned or directed instruction. Recommendation: Team teachers should work collaboratively to clarify the role of the special educator in the inclusive classroom. 4. Implication: General educators in this study relied on the special educators to monitor the IEP goals and accommodations for students with disabilities. Recommendation: Ongoing training should be provided to general educators related to new special education laws, including knowledge of and compliance with IEPs.
139
5. Implication: The performance gap between general education students and students with disabilities on the end-of-course tests was significant, with students with disabilities performing far below their general education peers on required standardized tests. Recommendation: Team teachers should collect and document anecdotal data on student comprehension as they solicit both formal and informal feedback from students. Test review should include item analyses. Test preparation skills should be a regular part of teaching and learning activities, especially for those students with disabilities and those students with a record of poor performance on wide-scale assessments. 6. Implication: Testing conditions within teachers’ classrooms should mirror testing conditions afforded to students during standardized tests. Recommendation: Teachers should develop student profile sheets, including who needs what accommodations for which tests, who will see that they are provided, and who will be responsible for keeping students and teachers informed about these accommodations. These profiles should be given to students to keep in their class notebooks. Principles of Instruction Notably, the findings in this study correlated with findings of recent research syntheses funded by the Office of Special Education Programs and the National Center for Learning Disabilities (Vaughn, Gersten, & Chard, 2000). Vaughn et al. found common principles of instruction across well conducted syntheses of instructional interventions. Three critical factors
140
in instructional interventions emerged as having the strongest impact on student learning, including a.
Control of task difficulty;
b.
Instruction in small interactive groups of six students or less; and
c.
Directed response questioning: procedures that promote thinking aloud. (p. 100)
These interventions were documented in the data collected and analyzed from the three inclusive classrooms used in this study. The findings in this study were parallel with the findings of recent research syntheses in that teachers used a comprehensive approach to instruction that incorporated multiple strategies and used peers to provide feedback. Vaughn et al. (2000) demonstrated that a comprehensive approach of directed instructional strategies individualized and augmented by feedback from proficient peers represented encouraging instructional methodology for increasing student understanding. Just as the Vaughn et al. research syntheses indicated that enhancing higher-order thinking skills in students' learning is critical, especially for students with learning disabilities, so did the prominent data in this study. Data from this study revealed that teachers (a) extended practice with feedback; (b) formed small, interactive group instruction; (c) directed questioning and responses; (d) broke tasks into component parts; and (d) used technology (Vaughn et al., 2000). In summary, the findings derived from the research literature and data from this study denoted that the use of multiple teaching strategies and practices can enhance student learning. Teachers who participated in this study presented information in small steps and then used direct instruction and questioning as well as individualized instruction and assistance to give or receive rapid feedback as a means of gauging student comprehension. Teachers followed a somewhat
141
prescribed timeline for covering content material and paced content instruction according to student readiness, including the provision of study sessions during and after the school day. These practices concurred with Skinner’s (1953) behavioral theory of learning. In addition, teachers judged student recall, a practice noted by Gagné (1985), through the use of daily warmup activities, homework checks, quizzes, and tests. The conclusions to this study were comparable to conclusions about teaching and learning in the inclusive classrooms found in the research literature. Prominent data presented an optimistic view of teaching and learning. Nevertheless, student performance outcomes, illustrated through final course grades and end-ofcourse standardized test results, indicated a notable achievement gap between general education students and students with disabilities. Recommendations for Future Research As educators grapple with compliance with federal laws and address teacher and student accountability for learning, teaching responses in the inclusive classroom will be critical. This study grew out of my concern for the challenges that teachers faced in facilitating student learning and for the mandates that students had to meet to receive a standard or advanced high school diploma. Although my goal was to offer universal strategies and practices to educators, this study was limited to three suburban high schools in the commonwealth of Virginia. Consequently, the experiences of the participants in this study, documented through observations, interviews, and document analysis, may not reflect inclusive classrooms in other locales. With that limitation in mind, I offer the following recommendations for future research. The impact of class size was a consideration to which teachers in this study alluded. A more extensive comparative study of inclusive algebra classes might examine class size, including the impact that the number of students with disabilities in a single classroom has on
142
student outcomes. The results of this study suggest that class size might have affected student outcomes. The class at School One had only 14 students as opposed to the 21 students in the classes at Schools Two and Three. Additionally, there was a lower percentage of students with disabilities in the class site at School One than in classes at the other case sites. Notably, the percentage of students passing the Algebra I course and end-of-course test at School One exceeded the passing percentages at Schools Two and Three (see Appendices F-H). This particular study was designed to provide a glimpse into mathematics instruction in the team-taught Algebra I inclusive classroom. However, another topic for further research is the impact of teacher training and staff development on the use of instructional conditions and interventions for team-teachers in the inclusive classroom. A comparative case study related to student success in inclusive classrooms of team-teachers who participate in a well planned and implemented training program versus classrooms of team-teachers who do not participate in such a program might make a strong case for the importance of continued teacher education. The research literature (see Chapter II) indicated that inadequate training and preparation prior to entering into the team-teaching relationship can pose a serious handicap for teachers. Additionally, a comprehensive study of student behaviors and the impact of those behaviors on student achievement and performance warrant further study. An investigation of this type might include evidence of student accountability, including homework completion, disciplinary infractions, and absenteeism. Although absenteeism only affected a small number of students in this study, absenteeism appeared to result from either student disciplinary unfractions or home environment. The district for this study prohibited environmental, cultural or economic disadvantage, and socio-economic characteristics as criteria for identifying students with a
143
learning disability; however, a study of the impact that these characteristics might have on student achievement could benefit all children. Commentary There is not complete agreement on the role and purpose of the inclusive classroom. Advocates for full inclusion continue to promote the social and cultural benefits to students with disabilities being placed in the general education classroom. However, other inclusionists see the need to have a continuum of services based on academic needs. State-mandated curricular and assessment programs have called attention to teacher and student accountability, including criteria for high school graduation. With the combination of a call for more inclusive learning opportunities for students with disabilities and state-mandated teacher and student accountability come challenges for educators to create learning environments that meet diverse needs. The cases used in this study demonstrate examples of teachers’ efforts to influence student achievement and performance outcomes in the Algebra I inclusive classroom. However, the challenges that should be addressed to enhance student success include teacher training, cooperative teacher planning, attention to student placement based on cognitive ability and student readiness, and alternative end-of-course assessments for students with disabilities. High school administrators and staff should continually review their programs and practices and make appropriate adjustments as a way of addressing student needs. Educators should regularly review current research literature to determine what is working well in similar instructional environments. The high expectations set for teachers and students should be accompanied by added resources and adequate planning time. More importantly, programs and practices found to be successful in inclusive classrooms should become a part of the ongoing
144
school philosophy and practice so that the use of time and staff are maximized to the benefit of students.
145
REFERENCES Alper, L., Fendel, D., Fraser, S., & Resek, D. (1997). Designing a high school mathematics curriculum for all students. American Journal of Education, 106, 148-177. Alexander, K., & Alexander, D. (1998). American public school law (4th ed.). Belmont, CA: Wadsworth Publishing Company. Ball, D. L. (2000). Working on the inside. In E. Kelly & R. A. Lesh (Eds.), Handbook of research design in mathematics and science education (pp. 365-402). Mahwah, NJ: Lawrence Erlbaum Associates. Battista, M. T., & Clements, D. H. (2000). Mathematics curriculum development as a scientific endeavor. In A. Kelly & R. A. Lesh (Eds.), Handbook of research design in mathematics and science education (pp. 737-760). Mahwah, NJ: Lawrence Erlbaum Associates. Bays, D. A. (2001). Supervision of special education instruction in rural public school districts: A grounded theory. (Doctoral Dissertation, Virginia Polytechnic Institute & State University, 2001). Bursuck, W. D., Munk, D. D., & Olson, M. M. (1999). The fairness of report card grading adaptations: What do students with and without learning disabilities think? Remedial and Special Education, 20(2), 84-92. Cawley, J., Miller, J., & School, B. (1987). A brief inquiry of arithmetic word problem solving among learning disabled secondary students. Learning Disability Quarterly, 12, 87-93. Christenson, S. L., Ysseldyke, J. E., & Thurlow, M. L. (1989). Critical instructional factors for students with mild handicaps: An integrative review. Remedial and Special Education, 10, 21-31.
146
Creswell, J. W. (1998). Qualitative inquiry and research design. Thousand Oaks, CA: Sage Publications, Inc. Crockett, J. B. (1999). The least restrictive environment and the 1997 IDEA amendments and federal regulations. Journal of Law and Education, 28(4), 543-564. Crockett, J. B. (1999). Viable alternatives for students with disabilities: Exploring the origins and interpretations of LRE. Exceptionality, 8(1), 43-60. Crockett, J .B. & Kauffman, J. M. (1998). Classrooms for students with learning disabilities: Realities, dilemmas, and recommendations for service delivery. In B. Wong (Ed.), Learning about learning disabilities (pp. 489-525). San Diego, CA: Academic Press. Cuban, L. (1987). State-powered curriculum reform: Measurement-driven instruction. Phi Kappa Phi Journal, 67, 23. Elementary and Secondary Education Act, 20 U. S. C. §30(c )(1)(A) (1994). Elementary and Secondary Education Act, 20 U.S.C. §1111(b)(3)(C)(2002). Elementary and Secondary Education Act, 20 U.S.C.§1111(b)(10)(B)(c)(2002). Ferguson, D. L. (1996). Is it inclusion yet? Bursting the bubbles. In M. S. Berres, D. L. Ferguson, P. Knoblock, & C. Woods (Eds.), Creating tomorrow’s schools today: Stories of inclusion, change and renewal (pp. 16-37). New York: Teachers College Press. Ferguson, P. M., & Ferguson, D. L. (1998). Constructive tension and the potential for reflective reform. Childhood Education, 74(5), 302-308. Florian, J. (1999). Teacher survey of standards-based instruction: Addressing time. Aurora, CO: Mid-continent Research for Education and Learning. Frederico, M. A., Herrold Jr., W. G., & Venn, J. (1999). Helpful tips for successful inclusion: A checklist for educators. Teaching Exceptional Children, 32(1), 76-82.
147
Friend, M., & Bursuck, W. D. (1996). Including students with special needs. Boston: Allyn & Bacon. Fuchs, D., & Fuchs, L. S. (1998). Inclusion versus full inclusion. Childhood education, 74(5), 309-315. Gagné, R. M. (1985). The conditions of learning theory (4th ed.). New York: Holt, Rinehart & Winston. Gagné, R. M., Briggs, L. J., & Wager, W. W. (1992). Principles of instructional design (4th ed.), Fort Worth, TX: Harcourt Brace College Publishers. Gersten, R., Keating, T., Yovanoff, P., & Harniss, M. K. (2001). Working in special education: Factors that enhance special educators’ intent to stay. Exceptional Children, 67(4), 549567. Goals 2000: Educate America Act of 1994, 20 U.S.C. § 5801 et seq. [Online}. Available: http://www.ed.gov/legislation/GOALS2000/TheAct.html. Green, P. C., & Sireci, S. G. (1999). Legal and psychometric policy considerations in the testing of students with disabilities. Journal of Special Education Leadership, 12(2), 21-29. Haager, D., & Vaughn, D. S. (1995). Parent, teacher, peer, and self-reports of social competence of students with learning disabilities. Journal of Learning Disabilities, 28, 205-215. Hehir, T. F. (1999). Begin early, end well: Strategies to improve results for students with disabilities. Journal of Special Education Leadership, 12(2), 31-35. Hergenhahn, B. R. (1976). An introduction to theories of learning. Englewood Cliffs, NJ: Prentice-Hall, Inc. Hirsch, C. R., & Coxford, A. F. (1997). Mathematics for all: Perspectives and promising practices. School Science and Mathematics, 97(5), 232-241.
148
Huefner, D. S. (1997). The legalization and federalization of special education. In J. W. Lloyd, E. J. Kameenui & D. Chard (Eds.), Issues in educating students with disabilities (pp. 3612). Mahwah, NJ: Lawrence Erlbaum Associates. Hunt, P., Staub, D., & Alwell, M. (1994). Achievement by all students within the context of cooperative learning groups. Journal of the Association for Persons with Severe Handicaps, 19, 290-301. Individuals with Disabilities Education Act (IDEA) Amendments of 1997, 20 U.S.C. § 1400 et seq. (1997). International Association for the Education and Educational Achievement. (1996). Mathematics achievement in the middle school years: LEAs third international mathematics and science study (TIMSS). Chestnut Hill, MA: TIMSS International Study Center, Boston College. Johnston-Wilder, S., Johnston-Wilder, P., Pimm, D., & Westwell, J. (Eds.). (1999). Learning to teach mathematics in the secondary school. New York: Routledge, Taylor, & Francis Group. Kauffman, J. K. (1997). Characteristics of behavior disorders of children and youth (6th ed.). Columbus, OH: Merrill. Keel, M. C., Dangel, H. L., & Owens, S. H. (1999). Selecting instructional interventions for students with mild disabilities in inclusive classrooms. Focus on Exceptional Children, 31, 1-16. Keogh, B. K. (1998). Classrooms as well as students deserve study. Remedial and Special Education, 19(6), 313-314.
149
Kohn, A. (2000). The case against standardized testing: Raising the scores, ruining the schools. Portsmouth, NH: Heinemann. Kortering, L. J., & Braziel, P. M. (1999). Staying in school: The perspective of ninth-grade students. Remedial and Special Education, 20(2), 106-113. Mann, H. (1845). Tenth annual report of the board of education. Boston: Dutton and Wentworth Printers. Manset, G., & Semmel, M. I. (1997). Are inclusive programs for students with mild disabilities effective? A comparative review of model programs. The Journal of Special Education, 31, 155-180. McIntosh, R., Vaughn, S., Schumm, J. S., Hager, D., & Lee, O. (1993). Observations of students with learning disabilities in general education classrooms. Exceptional Children, 60, 249261. Meiring, S. P., Rubenstein, R. N., Schultz, J. E., Lange, J., & Chambers, D. L. (1992). Mathematics in a changing world. In C. R. Hirsch (Ed.), A core curriculum: Making mathematics count for everyone (pp. 1-16). Reston, VA: The National Council of Teachers of Mathematics, Inc. Merriam, S. B. (1999). Qualitative research and case study applications in education. San Francisco, CA: Jossey-Bass, Inc. Middleton, J. A., & Goepfert, P. (1996). In B. McCombs & S. McNeely (Series Eds.) Inventive strategies for teaching mathematics: implementing standards for reform (pp.1-163). Washington, DC: American Psychological Association. Miles, M. B., & Huberman, A. M. (1994). Qualitative data analysis: An expanded sourcebook (2nd Ed.). Thousand Oaks, CA: Sage Publications, Inc.
150
Mills v. Board of Education of District of Columbia. (1972). 348 F. Supp. 866. U.S. District Court, District of Columbia. Montague, M. (1995). Student perceptions, mathematical problem solving, and learning disabilities. Remedial and Special Education, 18, 46-53. Morehouse, R., & Maykut, P. (1994). Qualitative data analysis: Using the constant comparative method. Beginning qualitative research: A philosophic and practical guide. Washington, DC: Falmer Press Teachers College. National Center for Educational Restructuring and Inclusion. (1995). National study of inclusion. New York: Author. National Commission on Excellence in Education. (1983). A nation at risk: The imperative for educational reform. Washington, DC: U. S. Government Printing Office. National Council of Teachers of Mathematics. (1995). Assessment standards for school mathematics. Reston, VA: Author. National Council of Teachers of Mathematics. (1994). A framework for constructing a vision of algebra. Reston, VA: Author. Patton, M. Q. (1990). Qualitative evaluation methods (2nd Ed.). Thousand Oaks, CA: Sage Publications, Inc. Phillips, N. B., Fuchs, L. S., Fuchs, D., & Hamlett, C. L. (1996). Instructional variables affecting student achievement: Case studies of two contrasting teachers. Learning Disabilities Practice, 11(1), 24-33. Reigeluth, C. M. (Ed.). (1983). Contributions of Gagné and Briggs to a prescriptive model of instruction. Instructional-design theories and models: An overview of their current status. Hillsdale, NJ: Lawrence Erlbaum Associates.
151
Rivera, D. M., & Bryant, B. R. (1992). Mathematics for students with special needs. Intervention in School and Clinic, 28, 71-86. Salend, S. J., & Duhaney, L. M. G. (1999). The impact of inclusion on students with and without disabilities and their educators. Remedial and Special Education, 20(2), 114-126. Schleisman, K. E., & King, J. A. (1990). Making sense of outcome-based education: Where did it come from, and what is it? (Research Report No. 7). Minneapolis: University of Minnesota, Center for Applied Research and Educational Improvement. Schumm, J. S., & Vaughn, S. (1995). Meaningful professional development in accommodating students with disabilities: Lessons learned. Remedial and Special Education, 16, 344-353. Schumm, J. S., Vaughn, S., & Gordon, R. (1994). General education teachers’ beliefs, skills, and practices in planning for mainstreamed students with learning disabilities. Teacher Education and Special Education, 17, 22-37. Schumm, J. S., Vaughn, S., Haager, D., McDowell, J., Rothlein, L., & Saumell, L. (1995). General education teacher planning: What can students with learning disabilities expect? Exceptional Children, 61(4), 335-352. Senger, E. S. (1999). Reflective reform in mathematics: The recursive nature of teacher change. Educational Studies in Mathematics, 37, 199-221. Scott, B. J., Vitale, M. R., & Masten, W. G. (1998). Implementing instructional adaptations for students with disabilities in inclusive classrooms: A literature review. Remedial and Special Education, 19(2), 106-119. Skinner, B. F. (1953). Science and human behavior. New York: Macmillan. Smith, T. E. C., & Dowdy, C. A. (1998). Educating young children with disabilities using responsible inclusion. Childhood Education, 74(5), 317-320.
152
Sowell, E., & Zambo, R. (1997). Alignment between standards and practices in mathematics education: Experiences in Arizona. Journal of Curriculum and Supervision, 12(4), 344355. Stodolsky, S. S., & Grossman, P. L. (2000). Changing students, changing teaching. Teachers College Record, 102(1), 125-172. Stake, R. E. (1995). The art of case study research. Thousand Oaks, CA: Sage Publications, Inc. Tellis, W. (1997). Application of a case study methodology. The qualitative report, [On-line serial] 3 (3). Available: http://www.nova.edu/sss/QR/QR3-3/tellis2.html. Thurlow, M. L., & Thompson, S. J. (1999). District and state standards and assessments: Building an inclusive accountability system. Journal of Special Education Leadership, (12 (2), 3-10. U. S. Department of Education. (2001). High standards for all students: A report from the National Assessment of Title I on progress and challenges because of the 1994 reauthorization. Washington, DC: U.S. Government Printing Office. U. S. Department Education. (1995). Seventeenth annual report to Congress on the implementation of the Individuals with Disabilities Act. Washington, DC: U. S. Government Printing Office. Vaughn, S., Gersten, R., & Chard, D. J. (2000). The underlying message in LD intervention research: Findings from research syntheses. Exceptional Children, 67(1), 99-114. Vaughn, S., & Schumm, J. S. (1995). Responsible inclusion for students with learning disabilities. Journal of Learning Disabilities, 28(5), 264-290. Vaughn, S., Schumm, J. S., Klingner, J., & Saumell, L. (1995). Students’ views of instructional practices: Implications for inclusion. Learning Disability Quarterly, 18, 236-247.
153
Virginia Department of Education. (1998). Standards of Learning for Virginia Public Schools. Richmond, VA: Author. Virginia Department of Education. (1995). Mathematics standards of learning for Virginia public schools. Richmond, VA: Author. Yasutake, D., & Bryan, T. (1995). The influence of affect on the achievement and behavior of students with learning disabilities. Journal of Learning Disabilities, 28, 329-334. Yin, R. (1994). Case study research: Design and methods (2nd ed.). Thousand Oaks, CA: Sage Publishing. Ysseldyke, J. E. (1992). Critical issues in special education. Boston: Houghton Mifflin Co. Ysseldyke, J. E., O’Sullivan, P. J., Thurlow, M. L., & Christenson, S. L. (1989). Qualitative differences in reading and math instruction received by handicapped students. Remedial and Special Education, 10(1), 14-20. Ysseldyke, J. E., Thurlow, M. L., & Bruininks, R. H. (1992). Expected educational outcomes for students with disabilities. Remedial and Special Education, 13(6), 19-30.
154
Appendix A VIRGINIA POLYTECHNIC INSTITUTE AND STATE UNIVERSITY Informed Consent for Student Participants in Research Projects Involving Human Subjects for Title of Project Investigator(s) I.
Instructional Strategies and Practices Used to Enhance Student Success in the High School Algebra I Inclusive Classroom Lillian M. Lowery, Jean B. Crockett (faculty advisor)
Purpose of this Research Project
The purpose of this study is to examine the instructional practices used by teachers who have been selected by school staff as teachers considered to be successful in using strategies and practices that result in positive results for students in Algebra I classes that include students who have a wide range of academic ability, during the second semester of fiscal year 2001-2002. II.
Procedures
The initial participant pool of nine teachers and approximately 1200 students (an average of 400 students per freshman class) from three separate schools will include teachers with three or more years of experience teaching in the Algebra I classroom with students with diverse academic abilities, and the students currently enrolled in the selected teachers’ Algebra I classrooms. The participants selected for this study will include approximately three teachers and their students from three separate schools in Northern Virginia in the Southeastern section of the United States. The student participants selected for the study will be from one of the selected teachers’ classrooms. Approximately 15 students, 5 students from one classroom from each teacher, will participate in the study. The student focus group interviews will be conducted at the school site, in an area and at a time selected by the school staff. Student participants will be identified by their range of ability, including their individualized education plans (IEPs) certifying their disability and the level of instructional service and support that have been mandated to meet the students’ special needs. III.
Risks
There are no risks of discomforts that include any physical danger or emotional distress. To ensure minimal emotional stress, participants will be selected by school staff and apprised of the nature of the research project before ever meeting the researcher. This preparation for school staff will afford participants the opportunity to decline participation before ever engaging in the research project.
155
IV.
Benefits of this Project
This study will advance awareness of current successful teaching practices and resources being used in the Algebra I classroom. No promise or guarantee of benefits has been nor will be made to encourage the participants to participate in this research project. Also, upon request from adult participants or parents of student participants, the researcher will provide a summary or the research results. V.
Extent of Anonymity and Confidentiality
Although teacher and focus group interviews will be audiotaped, teacher and student anonymity will be maintained. Only the interviews, not the classroom observations, will be audiotaped. There will be no videotaping at any time. Tape recorders will be placed in plain view for all participants to see. All records with names of student (and that will only includes given names, no surnames) will be destroyed as soon as each member of the focus group has been assigned a number and the tapes have been transcribed, matching students to comments. At no time will audiotapes be released to anyone other than individuals working on the project. The tapes will be stored in a locked file cabinet or transported in a locked briefcase. The audiotapes will be transcribed by a bonded company, which will not make copies or keep copies of either the tapes or the written transcriptions. VI.
Compensation
There will be no monetary or extra credit points for participants. The only compensation awarded will be the opportunity to receive the results of the research project, successful teaching strategies and practices used in a classroom with students with diverse academic abilities. VII.
Freedom to Withdraw
Subjects are free to withdraw from the study at any time without penalty. Also, subjects are free not to answer any questions or respond to any research situations, if they so choose. VIII. Approval of Research This research project has been approved, as required, by the Institutional Review Board for Research Involving Human Subjects at Virginia Polytechnic Institute and State University, by the Department of Educational Leadership and Policy Studies and the XXX (Virginia) Public Schools Research Screening Committee.
156
IX.
Participant's Responsibilities I voluntarily agree to participate in this study. I have the following responsibilities: ! To participate in focus group interviews (approximately 45 minutes in length) that will be audio taped; ! To participate in follow-up discussions about the accuracy of researcher’s findings.
X.
Participant's Permission
I have read and understand the Informed Consent (or known reasons for participation) and conditions of this project. I have had all my questions answered. I hereby acknowledge the above and give my voluntary consent: Student’s signature ______________________ Date _________________ Parent’s signature _______________________ Date ________________ Should I have any questions about this research or its conduct, I may contact: Lillian M. Lowery, Researcher
@ 703-219-2222/
[email protected]
Jean B. Crockett, Faculty Advisor
@ 540-231-4546/
[email protected]
David M. Moore, IRB Research Division
@ 540-231-4991/
[email protected]
Research participants must be given a complete copy (or duplicate original) of the signed Informed Consent.
157
Appendix B VIRGINIA POLYTECHNIC INSTITUTE AND STATE UNIVERSITY Informed Consent for Teacher Participants in Research Projects Involving Human Subjects Title of Project Researcher(s) I.
Instructional Strategies and Practices Used to Enhance Student Success in the High School Algebra I Inclusive Classroom Lillian M. Lowery, Jean B. Crockett (faculty advisor)
Purpose of this Research Project
The purpose of this study is to examine the instructional practices used by teachers who have been selected by school staff as teachers considered to be successful in employing strategies and practices that result in positive results for students in the Algebra I with students who have a wide range of academic ability, during the 2001-2001 fiscal school year during the second semester of fiscal year 2001-2002. II.
Procedures
The initial participant pool of nine teachers and approximately 1200 students (an average of 400 students per freshman class) from three separate schools will include teachers with three or more years of experience teaching in the Algebra I inclusive classroom, and the students currently enrolled in the selected teachers’ Algebra I inclusive classrooms. Ultimately, participants selected for this study will include approximately three teachers and 15 high-school students (one focus group of students per teacher) from three separate schools in Northern Virginia in the Southeastern section of the United States. Each teacher will be interviewed at their school site before classroom observations begin. There will be two classroom observations. After at least one classroom observation, approximately five students, a combination of students with and without disabilities, from each class will be randomly selected by the teacher to participate in focus group interviews. These focus group interviews will be conducted at the school site, in an area and at a time selected by the school staff. III.
Risks
There are no risks of discomforts that include any physical danger or emotional distress. To ensure minimal emotional stress, participants will be selected by school staff and apprised of the nature of the research project before ever meeting the researcher. This preparation for school staff will afford participants the opportunity to decline participation before ever engaging in the research project.
158
IV.
Benefits
This study will advance awareness of current successful teaching practices and resources being used in the Algebra I inclusive classroom. This study will help identify teachers and schools that may serve as resources for teacher collaboration and preparation as well as draw attention to the challenges that general educators in the inclusive classroom face when serving a diverse group of learners. However, no promise or guarantee of benefits has been made to encourage the participants to participate in this research project. Also, upon request from adult participants or parents of student participants, the researcher will provide a summary or the research results. V.
Extent of Anonymity and Confidentiality
Although teacher and student focus group interviews will be audiotaped, teacher and student anonymity will be maintained. Only the interviews, not the classroom observations, will be audiotaped. Tape recorders will be placed in plain view for all participants to see. All records with names of student (and that will only include given names, no surnames) will be destroyed as soon as each member of the focus group has been assigned a number and the tapes have been transcribed, matching students to comments. At no time will audiotapes be released to anyone other than individuals working on the project. The audiotapes will be transcribed by a bonded company, which will not make copies or keep copies of either the tapes or the written transcriptions. VI.
Compensation
There will be no monetary or professional continuing credits for participants. The only compensation awarded will be the opportunity to receive the results of the research project, successful teaching strategies and practices used in the inclusive classroom. VII.
Freedom to Withdraw
Subjects are free to withdraw from the study at any time without penalty. Also, subjects are fee not to answer any questions or respond to any research situations, if they so choose. VIII. Approval of Research This research project has been approved, as required, by the Institutional Review Board for Research Involving Human Subjects at Virginia Polytechnic Institute and State University, by the Department of Educational Leadership and Policy Studies and the XXX (Virginia) Public Schools Research Screening Committee.
159
IX.
Subject's Responsibilities I voluntarily agree to participate in this study. I have the following responsibilities: ! To participate in classroom observations by researcher; ! To participate in interviews (approximately 45 minutes in length) that will be audio taped; ! To share class data; ! To select a group of students within the observed classroom to participate in focus group interviews; ! To participate in follow-up discussions about the accuracy of researcher’s findings.
X.
Participant's Permission
I have read and understand the Informed Consent and conditions of this project. I have had all my questions answered. I hereby acknowledge the above and give my voluntary consent: Participant’s signature ______________________________ Date ________________ Witness’s signature ________________________________ Date ________________ Should I have any questions about this research or its conduct, I may contact: Lillian M. Lowery, Researcher
@ 703-219-2222/
[email protected]
Jean B. Crockett, Faculty Advisor:
@ 540-231-4546/
[email protected]
David M. Moore, IRB Research Division
@ 540-231-499/
[email protected]
Research participants must be given a complete copy (or duplicate original) of the signed Informed Consent.
160
Appendix C Domains Associated with the Effective Use of Teaching Strategies in the Inclusive Classroom
DOMAIN
DEFINITIONS
Classroom Climate
Climate refers to the affective (feelings, emotions) nature of the classroom. Teacher attitudes and perceptions are reflected in their interactions with their students, and they communicate to other students an environment of understanding and mutual respect.
Planning
Planning embodies focused goals that teachers have for themselves and their students, including preplanning and the ability to modify daily lessons, when necessary and easily without interrupting student learning.
Time
The alterable variable that teachers can control, time should be scheduled, allocated, and actively used in a way to keep students engaged and interested in the learning activities.
Adaptations and Accommodations
The process of choosing and applying appropriate teaching actions after assessing student success and understanding; pacing and sequencing instruction based on student need instead on content coverage.
Other Influences
The challenge of raising test scores of students although at the same time accepting more students with historically low achievement and test scores creates other influences on teaching and learning.
161
Appendix D Teacher Interview Questions Correlated to Domains Associated with the Use of Effective Teaching Strategies Question
Domain
Are students involved in helping to determine class goals and objectives?
Climate
Do you celebrate individual student success?
Climate
Do you integrate IEP accommodations prescribed for students with disabilities into the activities for the general lesson format?
Planning
What percentage of your instructional time is devoted to teacherdirected instruction?
Planning
Do you build in the time throughout the class period to give your students ongoing feedback? How? or Why not?
Time
What is your working relationship with special education teachers and related services personnel?
Adaptations and Accommodations
What are the advantages/disadvantages of inclusion?
Adaptations and Accommodations
How important is covering content to you?
Adaptations and Accommodations
Under what circumstances are students with disabilities allowed extra time on assignments or tests? Students without disabilities?
Adaptations and Accommodations
Do you rely on resource personnel to assist you with students who are struggling? Please explain.
Adaptations and Accommodations
Describe any training or coursework in which you have participated that better prepared you for the inclusive classroom.
Planning Adaptations and Accommodations
What are the characteristics of a successful student?
Other Influences
Is there any information that you would like to share about your inclusive classroom that was not covered in the structured questions?
162
Appendix E Student Focus Group Interview Questions Correlated to Domains Associated with the Use of Effective Teaching Strategies Question
Domain
How does your teacher praise individual student success?
Climate
How would you describe your teacher?
Climate
Do students help to determine class goals and objectives? Describe a typical class period.
Planning
How often do you work in small groups with your classmates? Do you like that better than working as a total class with the teacher leading the instruction? Why?
Planning
Does anyone have any IEP goals in mathematics? Please name the specific IEP goals.
Planning
How does your teacher give you feedback about your work throughout the class period? What are other students doing if the teacher is working with just one student?
Time
Do you think the teacher is more concerned about your learning or more concerned about covering the lesson for the day? Give some specific examples.
Adaptations and Accommodations
What does your teacher do when the lesson may be too difficult for some students? Why or Why not? How?
Adaptations and Accommodations
How does your teacher prepare you for tests so that you won’t be nervous about taking tests? Give examples.
Adaptations and Accommodations
Describe any training or coursework in which you have participated that better prepared you for the inclusive classroom.
Planning Adaptations and Accommodations
What are the characteristics of a successful student?
Other Influences
Is there any information that you would like to share about your inclusive classroom that was not covered in the structured questions?
163
Appendix F School One: Course Grades and SOL Results Student
a
Quarter 1
Quarter 2
Quarter 3
Quarter 4/ Final
Course Grade
SOL Scores
1
81.18
75.78
67.60
74.49/60
70.11 (D+)
399 (F)
2
94.62
91.74
92.32
79.60//90
89.96 (B+)
446 (P)
3
89.59
78.18
92.42
74.55/73
83.15 (C+)
488 (P)
4
84.20
86.97
80.42
75.86/76
78.59 (C)
451 (P)
5
79.37
69.91
77.80
45.57/66
70.13 (D+)
474 (P)
6
81.68
90.74
75.00
87.74/91
85.13 (B)
497 (P)
7
97.48
94.63
83.80
100.48/93
92.88 (B+)
481 (P)
8
88.10
88.81
94.89
81.67/90
88.84 (B)
497 (P)
9
83.53
94.09
89.60
92.26/78
88.50 (B)
451 (P)
10
98.32
93.45
96.10
96.65/91
95
506 (P)
11f
84.75
86.27
83.59
87.62/65
82.45 (C+)
432 (P)
12a
73.91
63.71
79.53
74.60/73
72.65 (D+)
399 (F)
13a
89.83
76.15
77.64
70.79/78
78.18
(C)
441 (P)
14a
89.83
76.15
77.64
66.03/47
57
(F)
411 (P)
Students with disabilities
164
(A)
Appendix G School Two: Course Grades and SOL Results Student
Quarter 2
Quarter 3
1
67.37
56.55
57.88
63
61.2
(F)
391 (F)
2
82.10
76.21
76.30
83
80
(C)
428 (P)
3
84.99
83.72
63.73
70
75.61 (C)
481 (P)
4
NE
NE
67.45
90
78.72 (C+)
432 (P)
5
60.40
65.49
68.35
78
68
(D)
456 (P)
6
68
64
63.71
78
68.42 (D)
374 (F)
7
92.12
93.65
89.82
93
92.14
(B+)
456 (P)
8
73.53
71.90
64.62
73
70.76
(D+)
428 (P)
9
89.04
90.20
81.79
89
87.51 (B)
468 (P)
10
66.95
63.99
68.29
84
70
391 (F)
11
71.47
42.52
64.10
73
62.77 (D?)
441 (P)
12
79.58
80.19
74.95
83
79.43 (C)
391 (F)
b
13
68.70
69.97
62.89
69
67.64 (D)
395 (F)
14b
69.92
64.25
67.38
73
68.63
(D+)
428 (P)
15b
74
71
67
78
72
(D+)
389 (F)
16
b
55
74
71
82
68
(D)
387 (F)
17
b
60
64
35
53
52
(F)
382 (F)
18b
63
63
51
55
52
(F)
352 (F)
19b
93
98
96
97
96
(A)
481 (P)
20
63
71
54
67
64
(D)
382 (F)
21
84
87
72
78
82
(C+)
409 (P)
a
SOL scores serve as final examination grade
b
Students with disabilities
NE = Not enrolled
165
Quarter 4
Course Grade
SOL Scoresa
Quarter 1
(D)
Appendix H School Three: Course Grades and SOL Results Student
Quarter 1
Quarter 2
Quarter 3
Quarter 4/ Final
Final Grade
SOL Scores
1a
78.5
80.2
81.8
75.4/NG
78.9 (C)
445 (P)
2
a
75.4
86.9
68.5
93.4/NG
81
(C+)
385 (F)
3
68.7
77.3
67.1
67.6/68
69.8
(D)
401 (P)
4
57.6
80.2
72.3
46.5/78
66.9
(D)
413 (P)
a
64.6
66.7
68.4
56.3/NG
64
(D)
393 (F)
a
6
41
7.6
6.7
9.5/NG
16.2 (F)
336 (F)
7
69.8
38.7
NG
64.7/66
47.8 (F)
413 (P)
8
91.1
91.8
81
87.9/95
89.3
(B)
455 (P)
9
61.1
47.9
25.1
19.5/50
40.7 (F)
365 (F)
10
60.1
43.4
34.5
37.1/40
43.1 (F)
417 (P)
11
78.6
82.4
69.8
85.9/60
75.3 (C)
409 (P)
12
5
69.4
47.9
27.3
83.8/90
63.6 (D)
449 (P)
a
68.7
69.9
58.1
59.7/NG
64.1 (D)
417 (P)
14a
99.4
102.8
101.5
106/NG
102.4 (A)
499 (P)
15a
79.2
68.9
63.9
52.6/NG
66.1 (D)
417 (P)
16
99.6
101.8
93.6
103/89
97.4
(A)
499 (P)
17
86.5
71.1
70.1
82.6/69
75.8
(C)
401 (P)
18a
36.3
6
3
10/NG
13.8 (F)
365 (F)
19
72.9
47
35.1
33.5/45
46.7
(F)
430 (P)
20
66.4
68.9
69.4
62.8/60
65.5
(D)
360 (F)
21
61.3
70.2
71.5
75.8/83
72.36 (D+)
13
a
Students with disabilities
NG=No Grade
166
405 (P)
Appendix I School One: Student Outcomes
Final Course Gradesa
SOL Test Resultsb
Total Population
14
100%
14
100%
Passed
13
93%
12
86%
Failed
1
7%
2
14%
Special Education
4
100%
4
100%
Passed
3
75%
3
75%
Failed
1
25%
1
25%
General Education
10
100%
10
100%
Passed
10
100%
9
90%
Failed
0
0%
1
10%
a
Course Grade Percentages: A=94-100; B=84-93; C=74-83; D=64-73; F (failing)=0-63
b
SOL Scale Scores: 500-600=pass/advanced; 400-499=pass/proficient; 0-399=fail
167
Appendix J School Two: Student Outcomes
Final Course Gradesa Total Population
SOL Test Resultsb
21
100%
21
100%
Passed
18
86%
10
52%
Failed
3
14%
11
48%
Special Education
10
100%
10
100%
Passed
8
80%
3
30%
Failed
2
20%
7
70%
General Education
11
100%
11
100%
Passed
10
91%
8
73%
Failed
1
9%
3
27%
a
Course Grade Percentages: A=94-100; B=84-93; C=74-83; D=64-73; F (failing)=0-63
b
SOL Scale Scores: 500-600=pass/advanced; 400-499=pass/proficient; 0-399=fail
168
Appendix K School Three: Student Outcomes
Final Course Gradesa Total Population
SOL Test Resultsb
21
100%
21
100%
Passed
15
71%
15
71%
Failed
6
29%
6
29%
Special Education
8
100%
8
100%
Passed
6
75%
4
50%
Failed
2
25%
4
50%
General Education
13
100%
13
100%
Passed
9
69%
11
85%
Failed
4
31%
2
15%
a
Course Grade Percentages: A=94-100; B=84-93; C=74-83; D=64-73; F (failing)=0-63
b
SOL Scale Scores: 500-600=pass/advanced; 400-499=pass/proficient; 0-399=fail
169
Class size
Student ability/placement Student behaviors
One-on-on instruction Technology
Extra time/Re-tests
Pacing/Sequencing
Feedback
Interactive groups
Teacher-directed TIME
Student input
Lesson modifications
Established routines
PLANNING
Positive interactions
Mutual respect
Teacher attitude
CLIMATE
170
TEACHER INTERVIEWS Jennifer x x x x x x x x x x x x x x Danette x x x x x x x x x x x x x x Indira x x x x x x x x x x x x x x x STUDENT INTERVIEWS School One x x x x x x x x x x x x x School Two x x x x x x x x x x x x School Three x x x x x x x x x x x x x FIELD OBSERVATIONS School One x x x x x x x x x x x x x x School Two x x x x x x x x x x x x x x School Three x x x x x x x x x x x x x x The “x” denotes frequency of participant responses related to prominent domains to the open-ended, structured interview questions which were correlated to the domains of the theoretical framework and teacher-student actions and interactions noted during field observations.
Data Sources
ACCOMMODATIONS
Prominent Domains
OTHER INFLUENCES
Data Matrix for Prominent Domains Addressed in Data Sources: Interviews and Field Observations
Appendix L
x x x
x x x
Teacher training
A really strong group of students (T/J-1); I would be concerned if LD students weren’t given chance to be in general ed class (T/J-8); They seem more prepared (T/J-15; I love these guys (T/J-15); celebrate student success one-on-one.
I put little stickers on their paper if they get A, B, B+ (T/D-2); Kids don’t want to be labeled [by being in self-contained classes] (T/D-5); you try to bend over backwards; give them every little thing (T/D-12); they are
JENNIFER (T/J)
DANETTE (T/D)
CLIMATE
Because of SOLs and POS, students not involved in determining goals of class (T/D-1); talk outside of class with team teacher; email back and forth (T/D-4); General education teacher does 75-80% of teaching
Always some sort of practice activity (T/J-5); hugely important to cover content, prerequisite skills (T/J10); same planning period as team teacher (T/J-12); team teachers talk a lot about students with different disabilities, plan for next year (T/J-13)
PLANNING
171
50-75% of instruction is teacher-directed (T/D-2); half the time I’m going around helping students oneon-one (T/D-3).
Some days [no teacher-directed instruction], other days all, especially nervous about letting them go when it’s a complicated concept (T/J-4); interactive class (T/J-4); circulate and help one-on-one to check on how they’re doing (T/J-5); LD teacher doesn’t limit herself to just helping LD students (T/J-9).
TIME
Extra time on quizzes, tests (T/D-8); shorter assignments for some students (T/D-8); when I get their IEPs, I read over them and try to cover all bases (T/D-2); extra credit (T/D-3); come after school to do quiz corrections (T/D-12).
Students comfortable with [LD] teacher (T/J-7); make sure we are meeting all SOLs, but change the pace (T/J-12); most kids have no IEP goals (T/J-13); team [LD] teacher no background; I helped her with context and she helped me with instruction (T/J-6); extra time (T/J11); Saturday morning tutoring and SOL prep classes (T/J-12).
ACCOMMODATIONS
PROMINENT DOMAINS: Teacher Interviews
Comparative Analysis of Data Addressed in Teacher (T) Interviews
Appendix M
2 or 3 kids who aren’t doing anything (T/D-3); if students don’t make an effort in larger setting, I can’t be on top of them every second (T/D-5); helps that SOL test is given later in the year (T/D-7); I don’t think training really better prepared me; [training] was
Student suspended for 3 weeks and failed (T/J-3); students have other problems, not necessarily instructional academic problems, disorganized (T/J9); much bigger classes last year and harder to keep track of kids (T/J-9); [training] unfortunately late in the year, we were supposed to do it again this year, but I didn’t go (T/J12).
OTHER INFLUENCES
INDIRA (T/I) No students not involved in determining goals and objectives because of SOL requirements (T/I-3); plans should be focused on what students will be tested on (T/I-8); teachers have no common planning period; talk at end of beginning of period or in math lounge general ed teacher very flexible (T/I-14).
(T/D-5); LD teacher decides which LD kids will be mainstreamed (T/D-6); in Math Department, we plan out what we are going to do for the quarter (T/D-11); first year [LD] teacher doing math; she’s not really comfortable with the content (T/D-4).
sweet kids (T/D-15).
Today I gave her some candy to encourage her; both of us like to reward students with stickers, verbal praise, calling parents (T/I-4); they are eager to learn; I believe that (T/I-4); [Inclusion] is an advantage when it comes to standardized testing (T/I-7); affect is important (T/I-7).
PLANNING
CLIMATE
172
50% of instructional period is teacherdirected (T/I-5); we both go around and check problems (T/I5).
TIME
Special educator gave general ed teacher IEP accommodations for LD students at beginning of the year; we try to integrate, to facilitate learning for everyone (T/I-5); for suspended student, contact resource teacher through email to help him catch up (T/I-6); allow extra time, help after school or before school (T/I-9). LD teacher responsible for summarizing IEP needs for general educator (T/I-14).
ACCOMMODATIONS
PROMINENT DOMAINS: Teacher Interviews
Immature group; don’t take learning very seriously at beginning of school year (T/I-4); honors kid got in trouble with a knife on him (T/I-7); if student fails SOL twice, should be given comparable test to demonstrate mastery (T/I-8); statistically impossible to start [at really low point] and [achieve expected mastery] (T/I-9); only training on IEPs; training offered to special educators, not general educators (T/I13)
at beginning of year when you’re so frazzled and crazy anyway (T/D-9); sad to see them wasting their time (T/D-11); some LD students have tutors (T/D-13).
OTHER INFLUENCES
Candy or bonus points to use on quizzes, homework, or tests (FG/On-1; teachers described as helpful, nice, cheerful, courteous (FG/On-2).
Tickets for extra credit (FG/Tw-1); teachers described as nice, happy, outgoing, fun, funny (FG/Tw-2); it’s a long class, [but] she
SCHOOL ONE (FG/On)
SCHOOL TWO (FG/Tw)
CLIMATE
She has everything planned out (FG/Tw-2).
Students help determine goals (FG/On-3); class always start off with warm-ups (FG/On-3)
PLANNING
173
Sometimes she’s [teaching] all 90 [minutes]; it just depends (FG/Tw-2); I just want to sit and work with somebody
Work in groups maybe twice a week; if you’re working at your desk, they don’t mind if you talk with each other (FG/On-4).
TIME
No math goals (FG/Tw-4); [teacher] more concerned with our learning because she spends more time instead of going on to next problem; she likes to do
[Teachers] always stay after school (FG/On-2); students not sure if anyone had math IEP goals (FG/On-5); [Teachers] give feedback all the time (FG/On-6); [Teachers] more concerned with what we are learning than covering content; they elaborate (FG/On-7); [Teachers] give students something else to do and work one-on-one with classmates (FG/On-8); pretests; gives steps for students to follow in class notes (FG/On-9); review questions when we have problems (FG/On-10).
ACCOMMODATIONS
PROMINENT DOMAINS: Student Focus Group Interviews
Comparative Analysis of Data Addressed in Student Focus Group (FG) Interviews
Appendix N
Make sure I understand; ask questions; do homework; study what you don’t know (FG/Tw-7).
Not supposed to joke around (FG/On-10); ask questions (FG/On-11).
OTHER INFLUENCES
SCHOOL THREE (FG/Th)
[Teachers] give us candy and writes notes to your parents (FG/Th-2); described teachers as nice, helpful, real good teachers (FG/Th-3-4); [teachers] work well together (FG/Th-4); if you need help, she’ll be there regardless (FG/Th-4).
makes it exciting; she treats us like we are one of her friends (FG/Tw-8).
CLIMATE
Teachers determine what happens [in class] (FG/Th-4); tells us what is going to happen today; start with warmups (FG/Th-5).
PLANNING
174
We do a lot of things in groups; it’s easier with your partners; depends on partner (FG/Th-7); [teachers] float around; if you raise your hand, she’ll come to you (FG/Th9).
else to watch and explain and understand more (FG/Tw-2); she goes around and checks your paper if you’re doing it right (FG/Tw-4); [teacher] checks everybody (FG/Tw-6).
TIME
[Teachers] stay after school a lot (FG/Th-3); LD teacher and general ed teacher teach different ways so you understand (FG/Th-4); we use calculators; the give us notes and a lot of examples (FG/Th-5); teachers more concerned with our learning; they keep drilling and drilling (FG/Th-13); test reviews; we did retakes (FG/Th-13); students didn’t know what math IEP goals were (FG/Th-8).
examples (FG/Tw-5); [teacher] tells you to stay after school and sends people to the board (FG/Tw-6); review packets (FG/Tw-7).
ACCOMMODATIONS
PROMINENT DOMAINS: Student Focus Group Interviews
At beginning of year, I used to be loud; I wanted to get caught up (FG/Th-6); it’s your choice whether you stay after school or not (FG/Th-11); you have to do everything the teacher says (FG/Th-15); the teacher can teach, but you have to think of what you’re doing wrong; it comes with being yourself (FG/Th-16).
OTHER INFLUENCES
Students urged each other on as they participated in oral reviews (O/SOn-1); we’ve got to agree on the number [mean] (O/SOn-3); lots of humor and laughter in class throughout instructional period (O/SOn-3); [Teacher told students] I am proud of you. (O/SOn4).
You miss me? I did my homework (O/STw-1); students talked among themselves as they completed warm-up activity (O/STw-1); [teacher sharpened [student’s] pencil, gave it to student, told
SCHOOL ONE (O/SOn)
SCHOOL TWO (O/STw)
CLIMATE
[Teachers] began class by giving overview of the day’s activities (O/STw-1-2); there’s something special about this activity that we’ll do next time (O/STw6).
Daily agenda written on white board (O/SOn-2); all ancillary materials, technology in place and ready for transitions from one activity to the other (O/SOn-1-5).
PLANNING
175
After teacher-directed instruction, students arranged into 4 groups (O/SOn-1); you need to take notes (O/SOn2); you can work together but not copy off each other (O/SOn4); [he] remembered; how many of you remembered that? (O/SOn-1); teachers circulated throughout classroom answering questions and clarifying confusions (O/SOn-5) Get homework out so I can check it although you are doing warmup; special ed teacher worked one-on-one with a student although general educator reviewed warm-up activity with class (O/STw-1); let’s
TIME
[Teachers] used overhead screen projector to lead class reviews (O/STw-4); you can come back today or Tuesday and do corrections (O/STw(O/STw-5); teachers circulated throughout classroom, working with students one-on-one
Teachers and students worked steps to problem on white board (O/SOn-15); use your calculators (O/SOn-2); you can copy notes from your classmates (O/SOn-3); use your notes [to complete assignment] if you need to (O/SOn-5).
ACCOMMODATIONS
PROMINENT DOMAINS: Field Observations
Comparative Analysis of Data Addressed in Field Observations (O)
Appendix O
Why didn’t you do the bonus questions? It’s so easy (O/STw-5).
Special educator became more comfortable with answering student questions after observing and listening to general ed teacher several times (O/SOn-5).
OTHER INFLUENCES
SCHOOL THREE (O/STh)
I should have brought you some candy; I have some for her. Look in the middle drawer (O/STh-1); used popcorn exercise to determine central tendencies; then teachers and students ate popcorn (O/STh7); teachers referred to students as “ladies and gentlemen”; one student asked about another student who was absent (O/STh-3); Are you playing baseball? Got any skills? (O/STh) (O/STh-8)
him to get busy (O/STw-4); [teacher] called individual students’ names to engage them in review (O/STw-1).
CLIMATE
Clearly established routines (O/STh-1-9); I have next SOL warmup if you want to start that (O/STh-8).
PLANNING
176
go over your homework and see what kind of questions you have; any volunteers to do circled problems (O/STw-3). Teacher-directed review and question and answer period (O/STh-1-9); had students write a number on board as they entered class in preparation for studying central tendencies (O/STh-1); take out your homework; I’m checking homework (O/STh-1); special ed teacher checked daily attendance as general educator checked homework (O/STh-1); your answers are going on the overhead (O/STh-2); OK, we’re ready to do another activity (O/STh-7).
TIME
Get out your calculator (O/STh-3); teacher reviewed used of calculator one-on-one with a particular student; teacher wrote steps to problems on overhead screen (O/STh4); you should be writing down these instructions as we go along (O/STh-5); student asked special educator what missed work he needed to make up (O/STh-6).
(O/STw-5); you’re not automatically going to get it on the first try, so you have to keep trying; what are you doing with the calculator (O/STw-6).
ACCOMMODATIONS
PROMINENT DOMAINS: Field Observations
Student talking although general educator teacher explaining mathematical problems; special educator goes over and quietly reprimands him (O/STh-3).
OTHER INFLUENCES
LILLIAN M. LOWERY 8208 Chapel Hill Place Fort Wayne, IN 46825 Telephone 260.425.7762 e-mail:
[email protected] EDUCATION Virginia Polytechnic Institute and State University (January, 1998-Present) Major: Education Administration Department of Educational Leadership and Policy Studies Degree: Ed.D., June, 2003 Administrative Certification, 1995 University of North Carolina at Charlotte, NC (1978) Major: Curriculum and Instruction Degree: Master of Education North Carolina Central University, Durham, NC (1976) Major: English; Secondary Education Degree: Bachelor of Arts ADMINSTRATIVE EXPERIENCE Area Administrator (September 2002 – present) Fort Wayne Community Schools, Fort Wayne, IN North Side/Elmhurst Administrative Areas High School Principal (1999-2002) Fairfax County Public Schools, Fairfax, VA Fairfax High School Minority Student Achievement Monitor (1998-1999) Fairfax County Public Schools, Fairfax, VA Area II Administrative Offices Assistant Principal (1995-1998) Fairfax County Public Schools, Fairfax, VA W. T. Woodson High School
177
TEACHING EXPERIENCE High School English Teacher (1988-1995) Fairfax County Public Schools - Fairfax, VA James Madison High School; West Springfield High School Student Government Association Sponsor, English Department Chairperson, Peer Observer, Varsity Cheerleading Sponsor, School Team Leader (Substance Abuse Program), Mentoring Program Chair Middle School English Teacher (1978 – 1988) Gaston County Public Schools – Gastonia , NC Southwest Middle School Reading Department Chairperson, Newspaper Advisor, Cheerleading Sponsor Alexandria City Public Schools, Alexandria, VA Francis C. Hammond Middle School Member Southern Association Accreditation Team (Dinwiddie, VA), City Language Arts Curriculum Committee, Newspaper Advisor, New Teachers Mentor PROFESSIONAL CERTIFICATES (Virginia) State Postgraduate Professional License Secondary School Principal Middle School Principal English Gifted Education State of Indiana Teacher’s License Secondary Administration and Supervision Gifted and Talented, K-12 English, 5-12 PROFESSIONAL ACTIVITIES Presentations and Workshops Lowery, L. M. (2003). Programs and Projects that Facilitate Emergent Literacy. Facilitator for Fort Wayne Urban League, Fort Wayne, IN, March 16, March 26, May 20. Lowery, L. M. (2002). Whose Leadership Is Required? Presenter at Wallace-Reader’s Digest Fund LEAD Conference, Fairfax, VA, August 2002. Lowery, L .M. (1999). Comparative Education: Standards-Based Learning. Presenter at Oxford University, Oxford, England, March 1999. Lowery, L. M. (1998). Community Support for Minority Student Achievement. Presenter at Education Trust Conference, Washington, DC, November 1998.
178
Lowery, L. M. (1997). Forum on the Public School. Planned, organized, and facilitated forum in cooperation with the National and County Council of PTAs as vice president of Programs with the George Mason University Chapter of Phi Delta Kappa. PROFESSIONAL SERVICE and ASSOCIATIONS Board Member, Stop Child Abuse and Neglect (SCAN), Fort Wayne, IN Member, Association of Supervision and Curriculum Development (ASCD) Member, LEAD Fairfax (VA) Program, sponsored by Wallace-Reader’s Digest Fund Member, Phi Delta Kappa (PDK) 1998-99 President, George Mason University (GMU) Chapter 1997-98 Vice President for Programs (President-elect), GMU Chapter Past Treasurer (1992), Virginia Association of Teachers of English Member, Delta Sigma Theta Sorority
179