Applying Data Mining Techniques in Healthcare Irina IONIŢĂ*, Liviu IONIŢĂ Petroleum-Gas University of Ploieşti, 39, Bucureşti Blvd., Ploieşti, 100680, Romania,
[email protected] (*corresponding author),
[email protected] Abstract: Healthcare sector provides huge volume of data on patients and their illnesses, on health insurance plants, medication and treatment schedules for different diseases, on medical services and so forth. Nowadays, there is a growing demand for the healthcare community to transform the existing quantities of healthcare data into value-added data, by discovering unknown patterns and relations between these data and by using them in the decision-making process, even if they refer to management, planning or treatments. Data mining consists in discovering knowledge and techniques such as classification and regression trees, logistic regression and neural networks that are adequate to predict the health status of a patient, by taking into account various medical parameters (also known as attributes) and demographic parameters. This paper presents a case study on the classification of patients with thyroid dysfunctions into three classes (i.e. 1 – hypothyroidism, 2 – hyperthyroidism, 3- normal) by using data mining algorithms and discusses possible methods to improve the accuracy of the considered classification models. Keywords: data mining, classification and regression trees (CART), healthcare
1. Introduction Data mining is the area of artificial intelligence, which refers to knowledge discovery from real world data sets. It is an interesting, interdisciplinary field that interacts with machine learning, statistics, pattern recognition, databases, information retrieval etc. Over time, researchers have tried to build software tools that may better incorporate data mining models, such as classification and regression trees, logistic regression, neural networks, fuzzy rules and so forth. Before starting a data mining application, one needs to: a. understand the problem they have to solve; b. possess sufficient data to build and test the model; c. know how to prepare data before using them (cleaning, transforming, partitioning etc.); d. choose (build) the best model, adequate to the current problem; e. set the model characteristics; f.
explain the results and give the best interpretation;
g. test the model and increase the accuracy of the data mining model; h. use the obtained knowledge in the decisionmaking process. The difficulty of analyzing large amount of data stored in databases existing under various formats led to the application of data mining
techniques. Organizations from fields such as commerce, finance, education, medicine, industry, telecommunication and others focus on discovering knowledge from their “raw material” and decide, based on these new patterns, relations or rules, which one is better for their organization in terms of management and planning strategies. In this paper the authors present a case study from the healthcare sector, namely the classification of patients who have thyroid disorders, by means of data mining algorithms. A database on this category of patients is analyzed by using predictive data mining, namely Salford Predictive Modeler 8.0 [20], a data mining software provided by Salford Systems. In the second section of the paper, the authors briefly analyze the status of data mining application in the healthcare domain, and provide several examples from different healthcare sectors such as the medical device industry, the pharmaceutical industry and hospital management. The third section details the proposed case study: after formulating the problem (i.e. the classification of patients with thyroid dysfunctions), the authors present the methods and materials to be used and follow the steps pointed in the introductory section. The results and their interpretation are described in the last section, before the authors’ conclusions.
2. Data Mining in Healthcare Sector The successful application of data mining in various domains such as marketing, retail,
Studies in Informatics and Control, Vol. 25, No. 3, September 2016
http://www.sic.ici.ro
385
engineering or banking has led to the expansion of its horizon to new fields, namely medicine and public health.
In [17] the author discusses the capability of data mining to improve the quality of the decision-making process in pharma industry. One of the major problems with pharmaceutical data is actually the lack of information. Predicting drug behaviour is essential to find out if the treatment helps the patients or their health status gets worse.
following data mining algorithms: decision trees, artificial neural networks, support vector machine, expert systems etc. For example, the diagnosis of thyroid disorders by using ANN’s is discussed in [7] [21] [12]. In [7], authors used data related to UCI site, collected in 1992 by James Cook University, Townsville of Australia. The total number of laboratory samples was 215. Data mining algorithm used five attributes as predictors and one attribute as a target. By selecting a hidden layer, the Logsig activation function for the hidden layer and 6 neurons from this layer, the level of classification accuracy was 98.6% in case of thyroid disease. The software used for testing the model was MATLAB 2012. In [21], authors present their work with respect to three ANN algorithms for the diagnosis of thyroid disease: the Back propagation algorithm (BPA), the radial basis function (RBF) Networks and the learning vector quantization (LVQ) networks. After the model evaluation, LVQ network had the best accuracy rate, i.e. 98%.
Data mining can help experts in healthcare management [4] to make decisions in the sector of customer relationship management. Patients will receive better and more affordable healthcare services if large amount of data about the degree of other patients’ satisfaction regarding medical sector will be analyzed and adequately interpreted. Biological databases may be considered the raw material for multirelational data mining techniques [11], due to their wide variety of data types, often with complex relational structure.
The classification of thyroid nodules was performed with support vector machines in [2]. In [24] there is presented a comparison study on data mining classification algorithms (C 4.5, C5.0) for the thyroid cancer. The authors of [24] used a database with 400 records extracted from the UCI thyroid database and 29 attributes. The study indicated that the confidence level for the rule set generated by C5.0 was higher than 95%. In [24], C4.5 approach was implemented in java platform by using Eclipse and XP operating system.
At the University of Alabama [1], there was implemented a surveillance system that uses data mining techniques (association rules) in order to identify new and interesting patterns in the infection control data. Data collected over one year (1996) were analyzed and three separate analyses were conducted, each one using a different size of data partition.
A diagnosis expert system based on fuzzy rules is described in [8], while a three-stage expert system based on support vector machines is discussed in [3]. The system proposed in [3] reached the highest accuracy reported so far in the classification of thyroid disorders, by using a 10-fold cross-validation method, with the mean accuracy of 97.49% and with the maximum accuracy of 98.59%.
Nowadays, an increasing number of data mining applications focus on analyzing health care centers for a better health management, or to detect disease outbreaks in hospitals, to prevent patients’ deaths, and, obviously, to detect fraudulent insurance claims [19], [6], [17], [5]. Data mining provides the methodology and technology to discover knowledge from the huge amount of data and furthermore, this knowledge is used for decision making.
In the research [18], it is presented the case study of American Healthways that provides diabetes management services to hospitals and health plans so that to enhance the quality and lower the cost of treating patients with diabetes. The authors of the present article focus their research on applying data mining techniques in order to classify patients with thyroid disorders. In the literature existing on the diagnosis of thyroid diseases, the authors have identified the 386
http://www.sic.ici.ro
In the following section of the paper, the authors shall present a case study on the classification models applied to a database containing records about individuals with thyroid diseases. The data set consisted in 756 records extracted from UCI Machine Learning Repository [23]. We used 21 attributes as predictors and a class attribute.
Studies in Informatics and Control, Vol. 25, No. 3, September 2016
In the experiments described below, there were used CART and TreeNet models. By comparing the obtained results with those existing in the above-mentioned studies, in most of our experiments, the accuracy of CART model was over 93%, the highest value being 96.86%, for the following settings: Priors=Equal, Costs=0.5, Parent node min cases=10, Terminal node min cases=1, Partition=0.6. The accuracy of TreeNet model was 94.97%.
3. A Case Study: Classification of Patients with Thyroid Dysfunctions Problem statement: given a database with records about patients who have thyroid dysfunctions, there is required the classification of these patients into three categories: 1- hypothyroidism, 2 – hyperthyroidism, 3 – normal. Methods and materials: the authors used a data set with 756 records and 22 attributes (i.e. age, sex, on_thyroxine, query_on_thyroxine, on_antithyroid_medication, sick, pregnant, thyroid_surgery, I131_treatment, query_hypothyroid, query_hyperthyroid, Lithium, goiter, tumor, hypopituitary, psych, TSH, TT4, T3, T4U, FTI, class) characteristic to each patient. The original data set can be found at UCI repository website [23]. The target attribute is class and it is categorical with three possible values (1, 2 and 3). The attributes TSH, TT4, T3, T4U and FTI take real values, while the rest of the attributes are categorical as the target attribute. To sum up, the model used will have 21 predictors. The analysis method applied by the authors was CART model (i.e. Classification and Regression Trees). In literature, see [9], classification and regression trees are described as machine-learning methods used to construct prediction models from real world data. In descriptive modelling, a classification model helps to identify what features define a certain class from a database, while in predictive modelling, a classification model predicts the class label of the unknown records. The process of obtaining the models is not very difficult to understand: recursively, the data space is partitioned and within each partition there is fit a simple prediction model. As a result, the partitioning process can be represented graphically as a decision tree. Classification trees are built for dependent
variables that take a finite number of unordered values, with prediction error measured in terms of misclassification cost (rate). On the other hand, regression trees are used for dependent variables that take continuous or ordered discrete values, with prediction error commonly measured by the squared difference between the observed and the predicted values [9] [13]. For example, two of the classification tree algorithms are C4.5 [13] and CART [9]. A difference is that C4.5 uses entropy for its impurity function, whereas CART uses the Gini index. CART employs 10-fold (default) crossvalidation, whereas C4.5 uses a heuristic formula in order to estimate error rates. AID [10] and CART are known as regression tree algorithms, while M5 [25] is an adaptation of a regression tree algorithm designed by Quinlan [15], [16]. “The CART decision tree is a binary recursive partitioning procedure” [26] and works with continuous and nominal attributes. This procedure generates a sequence of nested pruned trees. The optimal candidate is picked by evaluating the predictive performance of every built tree and it is further defined as being the tree in the pruned sequence that achieves minimum cost on test data. CART tree performance is always measured on independent test data or by using crossvalidation. In CART terminology, performance is described by the error rate R(T), where T indexes a specific tree. CART splitting rules are formulated under the following form: An instance forms the left branch if CONDITION, otherwise forms the right branch, where CONDITION can be expressed as a comparison test attribute_Xi≤value, for continuous attributes or as attribute_Xi ∈ {label1, label2, .., labeln} for nominal attributes. CART produces only binary splits by considering all 2n-1-1 ways of creating a binary partition of n attribute values, in case of a nominal attribute. CART evaluates the purity of any candidate split by using an impurity function. A node which contains members of only one class is considered perfectly pure. In literature, there are mentioned some examples of impurity measures: nc−1
Entropy (t)=− ∑ p (i∣t )log2 p(i∣t )
(1)
t =0
nc−1
Gini(t )=1− ∑ [ p(i∣t ) ]
Studies in Informatics and Control, Vol. 25, No. 3, September 2016
2
(2)
i=0
http://www.sic.ici.ro
387
Classification error (t )=1−max [ p(i∣t )] i
(3)
where nc represents the number of classes and p(i|t) denominates the fraction of records belonging to class i at a given node t. By comparing the degree of impurity of the parent node with the degree of impurity of the child nodes (after splitting the tree), one can answer the question “how well a test condition performs?”. The bigger the difference, the better the test condition is. For the case study presented in the current paper, the authors included in the classification model all the attributes and for each of them a role was associated (as a predictor or as a target). First, the analysis method is CART. The default testing method for CART is 10-fold cross-validation. This method splits the data into 10 equal “folds” then leaves one fold out. 9 folds are used to build the model and 1 fold is used to test the generated classification model.
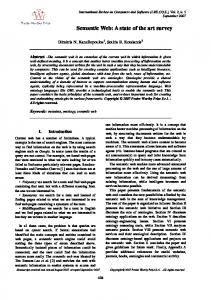
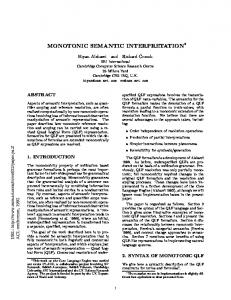
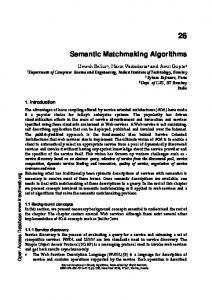
The process is repeated, leaving a different fold out each time. Performance measures are gathered. Because this dataset is fairly small (756 records), cross-validation is a sufficient testing method. After running the application, the optimal CART tree is displayed (Figure 1). Nodes are colour-coded, based on higher concentrations of each class (red for “hypothyroidism”, blue for “hyperthyroidism”, green for “normal”). In the bottom half of the window, there is a model sequence where each dark blue square represents a different CART tree. The green vertical bar denotes the tree with the lowest relative cost. With this first CART model, the authors achieved an ROC measure of 0.8753 on the test sample and a class accuracy of 0.9484. The performance of CART tree is described by the error rate R(T) and has the value 0.0516. In the confusion matrix (Figure 2), 8 patients with hypothyroidism are classified as normal, 5
Figure 1. CART tree
Figure 2. Confusion Matrix
388
http://www.sic.ici.ro
Studies in Informatics and Control, Vol. 25, No. 3, September 2016
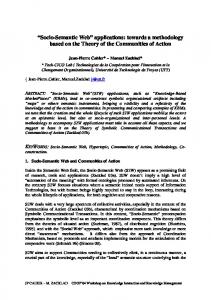
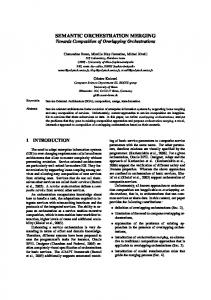
patients with hyperthyroidism are classified as normal, 8 normal patients are classified as patients with hypothyroidism and other 18 normal patients are classified as patients with hyperthyroidism. The goal of authors’ research is to minimize the misclassification rate. For the initial classification model, the costs for class attribute is modified with the value “5”, which means that it is five times worse to classify a patient as normal when they have a thyroid disorder (hypothyroidism or hyperthyroidism), as it is to classify a patient as with a thyroid dysfunction when they are normal. After running the model, only one normal patient is classified as hypothyroidism and 8 normal patients are classified as hyperthyroidism (Figure 3). It is obvious that we improved the classification model, the ROC measure being in this case 0.8892. The data mining model uses all 21 attributes as predictors, but 6 of them are considered more important for the research: TSH, FTI, TT4, T3, age and T4U. A top-down list of predictors
included in the CART model with their relative importance scores is given in Figure 4. The importance score of an attribute is calculated based on the sum of the improvements in all nodes where the attribute appears as a splitter. Surrogates are also included in the importance calculations. As a consequence, even an attribute that never splits a node may be assigned a high importance score. The most important attribute is TSH (ThyroidStimulating Hormone), which indicates whether a patient’s thyroid gland functions properly. An underactive thyroid gland means hypothyroidism (TSH values are greater than the upper limit of the normal range), while an overactive thyroid means hyperthyroidism (TSH values are lower than the lower limit of the normal range). The second most important attribute FTI (Free Thyroxine Index), an estimation of the free T4 concentration. Another important attribute is Triiodothyronine (T3), one of two major hormones produced by the thyroid gland and along with thyroxine (T4) helps control the rate at which the body uses energy.
Figure 3. Confusion Matrix after costs setting
Figure 4. Relative importance scores for each predictor included in CART model
Studies in Informatics and Control, Vol. 25, No. 3, September 2016
http://www.sic.ici.ro
389
The associated rules for terminal nodes have the structure presented in Figure 5 (the patients classification in class 2 – hyperthyroidism) and Figure 6 (the patients classification in class 3 – normal).
boosting engine that builds hundreds of CART trees in an error-correcting sequence [22]. The output is a graph of the number of trees in the ensemble plotted against the average log likelihood at each iteration (Figure 7). The TreeNet process can be described as follows: – – – – –
– Figure 5. Rules for terminal node 7
–
Figure 6. Rules for terminal node 8
To optimize the classification process, the authors experimented another model, namely TreeNet, which is a stochastic gradient
–
the initial model consists in one very small tree (with 4-6 terminal nodes); for every record there are calculated “residuals” for this model (prediction error); a second small tree grows to predict the residuals from the first tree; the new model is considered Tree1+Tree2; compute “residuals” from the new model and produce a third tree in order to predict the revised residuals. An important advantage of the TreeNet model is that it can never run out of data, no matter how many trees are built, because each tree starts at the root node and can use all the available data. TreeNet model uses random subsets of the training data in each iteration. Also, for every predictor this classification model produces a dependency plot which explains how varying predictor values influence the output. TreeNet offers new automated means to test the existence of interactions and to rank those interactions. The classification model has the ability to allow some interactions and to disallow others. Also, the model can be tuned so that to optimize the area under the ROC curve, classification accuracy etc. Each produced tree attempts to correct errors made by its predecessors.
Figure 7. The TreeNet gradient boosting model
390
http://www.sic.ici.ro
Studies in Informatics and Control, Vol. 25, No. 3, September 2016
In this case, we achieved an ROC measure of 0.8904 for the test sample and a class accuracy of 0.9497. The model uses only 15 attributes, but the most important 6 predictors remain the same (TSH, FTI, TT4, Age, T3, T4U) as in the CART model experiment (Figure 8). TreeNet model uses 597 records in the learning phase and 159 records in the testing phase. A facility in SPM 8.0 is that one can create partial dependency plots for each predictor. These plots (see Figure 9, Figure 10 and Figure 11) offer a clear perspective about the contribution of each predictor to the classification of patient’s thyroid disorder.
Figure 9. Age predictor dependence for Class 1hypothyroidism
This dependence plot indicates the fact that the probability for a patient younger than 10 to have hypothyroidism is equal to that of a patient’s whose age ranges between 45 and 65 years. The graphic in Figure 10 presents the incidence of hyperthyroidism to persons over 55 years old. According to the classification model, a person younger than 45 years may not have thyroid dysfunction. A certain segment of patients between 20 and 45 years is classified as normal person, in terms of their thyroid function.
Figure 10. Age predictor dependence for Class 2hyperthyroidism
4. Results and Discussions Classification is the task of learning a target function known as a classification model that maps each attribute set i to one of the predefined class labels y. The purpose of the current analysis via tree-building algorithm
Figure 11. Age predictor dependence for Class 3 - normal
Figure 8. Relative importance for predictors used in TreeNet
Studies in Informatics and Control, Vol. 25, No. 3, September 2016
http://www.sic.ici.ro
391
(CART) is to determine a set of if-then logical (split) conditions that permit accurate prediction or the classification of the three cases of patients suffering from thyroid diseases. Core CART features are mentioned below: – –
automatic separation of relevant from irrelevant predictors; model specification;
–
unaffected by outliers;
–
unaffected by missing values;
–
requiring a moderate supervision the analyst; a tree relatively simply to understand;
– –
by
high accuracy – nearly as good as any logistic regression on more variables; CART tree generation by means of repeated partitioning of data set.
–
A prior probability distribution of the three classes is necessary in order to do a proper splitting. The most common is Priors Equal, which gives equal weight to each class, regardless of its frequency in the data. If the priors set is Priors data, the probabilities match total sample frequencies. In this case, the priors within-node probabilities are equal to the actual frequencies in the dataset. Parent node minimum cases and Terminal node minimum cases are two parameters which control how small or large the terminal nodes of the CART tree will be. It is advisable to have around a 3:1 ratio. Some opportunities for model optimization include modifying further the priors/costs, limits and testing settings. In Table 1 there are summarized the
values obtained for two important evaluation measures, i.e. ROC Test and Accuracy, after running ten evaluation scenarios. The highest value for ROC Test (0.9213) was obtained for the following settings: Priors=Equal, Costs=0.5, Parent node min cases=30, Terminal node min cases=10, Partition=0.6. In most of the experiments, the accuracy of the classification model was over 93%, the highest values being 0.9686 for the following settings: Priors=Equal, Costs=0.5, Parent node min cases=10, Terminal node min cases=1, Partition=0.6. After comparing the two classification models (i.e. CART and TreeNet), we can make the following remarks: –
–
– –
– – –
there are big errors near region boundaries for CART model, whereas TreeNet model allows fine predictions; CART model is instable, especially extensive trees, meaning that small data changes induce big model changes; TreeNet is a stable model due to averaging of individual tree responses; by splitting the data set recursively, CART model is characterized by data fragmentation; each tree produced by TreeNet model works with all data; Tree Net model does not allow anomalies to have a big influence on those models; TreeNet tends to include more predictors than other learning machine.
Table 1. ROC Test and Accuracy for CART model
Limits Priors Equal
392
Costs
Data 1.00 5.00
Parent node min cases 10
30
http://www.sic.ici.ro
Testing V – fold ROC Test Accuracy Terminal node cross Partition min cases validation 1 10 10 0.5 0.6 0.8753 0.9484 0.8836 0.9576 0.8836 0.9576 0.8376 0.9378 0.9113 0.9623 0.6292 0.8814 0.9209 0.9686 0.9213 0.9664 0.8573 0.9435 0.9118 0.9596
Studies in Informatics and Control, Vol. 25, No. 3, September 2016
5. Conclusions Nowadays healthcare industry generates huge amounts of complex data about patients, hospitals resources, disease diagnosis and treatments, electronic patient records, medical devices and so forth. All these data stored in databases, commonly named data warehouses, represent the raw material to be processed and analyzed in order to extract the knowledge that enables support for cost savings and the decision-making process. In this paper, the authors analyze the way data mining (namely CART and TreeNet models) can be applied in order to classify patients with thyroid diseases. The obtained results indicate a high level of classification accuracy (over 93%) for most of the cases presented. Furthermore, the authors propose several possibilities to increase the model accuracy by modifying some of the model settings (Priors, Costs, Partition data percentage etc.). A satisfying ROC test measure was obtained for TreeNet model (0.8904). Future work will focus on combining CART with Logistic Regression model in order to identify the strong and weak points of each classification model considered. Another challenge for the authors is to analyze the possibility to develop a hybrid classification model based on TreeNet model.
REFERENCES 1. BROSSETTE, S. E., A. P. SPRAGUE, M. K., HARDIN, B. WAITES, W. T. JONES, S. A. MOSER, Association Rules and Data Mining in Hospital Infection Control and Public Health Surveillance, Journal of the American Medical Informatics Association, vol. 5(4), 1998, pp. 373-381. 2. CHANG, C. Y., M. F. TSAI, S. J. CHEN, Classification of the Thyroid Nodules Using Support Vector Machines, International Joint Conference on Neural, Networks, 2008, pp. 3093-3098. 3. CHEN, H. L., B. YANG, G. WANG, J. LIU, Y. D. CHEN, D. Y. LIU, A ThreeStage Expert System Based on Support Vector Machines for Thyroid Disease Diagnosis, Journal of Medical Systems, vol. 36(3), 2012, pp. 1953-1963.
4. DESIKAN, P., K. W. HSU, J. SRIVASTAVA, Data Mining for Healthcare Management, SIAM International Conference on Data Mining, Arizona USA, 2011. 5. DIWANI, S., S. MISHOL, D. S. KAYANGE, D. MACHUVE, A. SAM, Overview Applications of Data Mining In Health Care: The Case Study of Arusha Region, International Journal of Computational Engineering Research, vol. 3(8), 2013, pp. 73-77. 6. DURAIRAJ, M., V. RANJANI, Data Mining Applications In Healthcare Sector: A Study, International Journal of Scientific & Technology Research, vol. 2(10), October 2013. 7. GHAREHCHOPOGH, F. S., M. MOLANY, F. D. MOKRI, Using Artificial Neural Network in Diagnosis of Thyroid Disease: A Case Study, International Journal on Computational Sciences & Applications (IJCSA) vol. 3(4), Aug. 2013. 8. KELEŞ, A., A. KELEŞ, ESTDD: Expert System for Thyroid Diseases Diagnosis, Expert Systems with Applications, vol. 34(1), 2008, pp. 242-246. 9. LOH, W. Y., Classification and Regression Trees, Wiley Interdisciplinary Reviews: Data Mining and Knowledge Discovery, vol. 1(1), 2011, pp. 14-23. 10. MORGAN, J. N., J. A. SONQUIST, Problems in the Analysis of Survey Data, and a Proposal, J. of American Statistical Association, vol. 58, 1963, pp. 415-434. 11. PAGE, D., M. CRAVEN, Biological Applications of Multi-Relational Data Mining, http://www.kdd.org/exploration_ files/Page.pdf, accessed in January 2016. 12. PRERANA, E., P. SEHGAL, K. TANEJA, Predictive Data Mining for Diagnosis of Thyroid Disease using Neural Network, International Journal of Research in Management, Science & Technology (EISSN: 2321-3264) vol. 3(2), April 2015. 13. QUINLAN, J. R., C4.5: Programs for Machine Learning, Morgan Kaufmann, San Mateo, CA, 1993. 14. QUINLAN, J. R., Improved Use of Continuous Attributes in C4.5, Journal of
Studies in Informatics and Control, Vol. 25, No. 3, September 2016
http://www.sic.ici.ro
393
Artificial Intelligence Research, vol. 4, 1996, pp. 77-90.
Neural Networks, IEEE International Advance computing Conference, Patiala, India, 2009, pp. 1016-1020.
15. QUINLAN, J. R., Induction of Decision Trees, Machine Learning, vol. 1(1), 1996, pp. 81-106.
22. TreeNet, https://www.salford-systems.com/ products/treenet, accessed in July 2015
16. QUINLAN, J. R., Learning with Continuous Classes, 5th Australian Joint Conference on Artificial Intelligence, vol. 92, 1992.
23. UCI Machine Learning Repository, https://archive.ics.uci.edu/ml/machinelearning-databases/thyroid-disease/, accessed in January 2016
17. RANJAN, J., Application of Data Mining Techniques in Pharmaceutical Industry, Journal of Theoretical and Applied Information Technology, Vol.3, No.4, 2007.
24. UPADHAYAY, A., SHUKLA, S., KUMAR, S., Empirical Comparison by Data Mining Classification Algorithms (C 4.5 & C 5.0) for Thyroid Cancer Data Set, International Journal of Computer Science & Communication Networks,vol. 3(1), 2013, pp. 64-68.
18. RIDINGER, M., American Healthways uses SAS to Improve Patient Care, DM Review, 12:139, 2002. 19. RUBEN, D., CANLAS Jr., Data Mining in Healthcare: Current Applications and Issues, http://www.cclfi.org/files/Data_ Mining_Health.pdf, accessed in July 2015. 20. Salford Predictive Modeler 8.0, https://www.salford-systems.com/products/ spm, accessed in January 2016.
25. WITTEN, I., E. FRANK, Data Mining: Practical Machine Learning Tools and Techniques, 2nd ed. San Francisco: Morgan Kaufmann, 2005. 26. WU, X., V. KUMAR, J. ROSS QUINLAN, et al., Top 10 Algorithms in Data Mining, Knowledge and Information Systems, vol. 14(1), 2008, pp. 1-37.
21. SHUKLA, A., P. KAUR, Diagnosis of Thyroid Disorders using Artificial
394
http://www.sic.ici.ro
Studies in Informatics and Control, Vol. 25, No. 3, September 2016