Integrated Simulation of Power and Communication Networks for Smart Grid Applications Kevin Mets, Tom Verschueren, Chris Develder
Tine L. Vandoorn, Lieven Vandevelde
Dept. of Information Technology - IBCN Ghent University – IBBT G. Crommenlaan 8 Blok C0 Bus 201 9050 Ghent, Belgium Email:
[email protected]
Dept. Electrical Energy, Systems and Automation - EELAB Ghent University Sint-Pietersnieuwstraat 41 9000 Ghent, Belgium Email:
[email protected]
Abstract—Innovative architectures, control mechanisms and network technologies are being proposed to realize the future smart grid. To assess their impact and effectiveness, simulation is key. Simulation in both areas of communication networks as well as power systems has been widely adopted. However, the coupling of those two worlds calls for tools able to address both. In this paper, we propose an innovative integrated framework that models and simulates both the communication network and power networks. We discuss the design and operation of the simulation environment, and illustrate this by means of a case study that employs it.
I. I NTRODUCTION Smart grids will integrate power grid technologies and information and communication technologies to generate, transport, distribute and consume energy in a more efficient manner. Globally, the interest in smart grids has risen dramatically. The EU 20-20-20 targets aim for a reduction in EU greenhouse gas emissions of at least 20%, 20% of EU energy consumption to come from renewable energy sources, and a reduction in energy consumption of 20% [1]. These targets are to be met by 2020. In the US, about $4.5 billion of American Recovery and Reinvestment Act of 2009 (ARRA) funds to the Department of Energy also are slated for Smart Grid demonstration projects [2]. This global interest in smart grids is the result of (among others) the rise in renewable energy sources and new sources of energy demand (i.e. electric vehicles). Renewable energy sources, such as solar or wind, offer a greener solution compared to more traditional energy sources such as fossil fuels (i.e. coal). However, their intermittent nature makes it difficult to balance demand and supply, which is essential for the correct operation of the power grid. Traditionally, generation was done by central power plants and power flow was one-directional from producer to consumer. However, the rise of distributed energy sources, which are placed througout the grid, results in bi-directional power flows. The grid was not designed to handle these distributed energy sources and bi-directional power flows, therefore careful management of these energy sources is required [3]. Energy demand is also undergoing important changes, e.g. as a result of the ongoing electrification of the vehicle fleet. Plug-in (hybrid) electric vehicles (EVs) require power from the grid to charge their batteries, therefore they will create
an additional load on the power grid. Electric vehicles not only require significant amounts of electricity to recharge their batteries, the location where the charging will take place is not fixed. Electric vehicles are what could be called “mobile energy consumers”, as their demand for energy is not limited to a single location. The impact of these EVs is discussed e.g. in [4], [5]. It is clear that changes in demand and supply will have an impact on the future power grid: supply planning becomes more complicated because of the intermittent nature of renewable energy sources and changing demand patterns. However, ICT can play a major role in tackling these challenges and enabling smart grid applications [6], [7]. Communication networks can connect all the smart power grid components, enabling exchange of information and advanced management and control of the grid, which was limited or not possible before, especially when considering distribution grids. The importance of communication technologies is recognized by academia and industrial professionals, as illustrated by recent activities such as [8]. The remainder of this paper is structured as follows. In section II we formulate the problem statement. The design of the smart grid simulation environment is discussed in sections III and IV. In section V, we present a case study that gives a demonstration of the smart grid simulation environment. We conclude this paper in section VI where the conclusion and future work is discussed. II. P ROBLEM S TATEMENT To realize the smart grid, many innovative architectures, control mechanisms and network technologies (or tweaking/tuning thereof) are being proposed [7]. To assess their impact and effectiveness in addressing the aforementioned issues, simulation is key. Obviously, simulation in both the areas of communication networks as well as power systems has been widely adopted (e.g. [9], [10]). However, the coupling of those two worlds in the frame of smart grids calls for tools able to address both. In this paper, we propose an innovative integrated framework that models and simulates both the communication and power networks, as outlined below.
The simulation environments used in power system research range from multi-domain simulation environments (e.g. MATLAB), to single-domain simulation environments such as OpenDSS [9]. Simulators are also often used in the context of information and communication technologies research. Examples from this domain are the ns-2 network simulator [10], its successor ns-3, and OMNeT++ [11], which exhibit good scalability [12]. However, the main drawback of these existing simulation environments is that they do not offer an integrated solution for both power and communication network domains. One of the earliest works to our knowledge that addresses this need is [13], where the authors combine ns-2 with commercial power system simulators. Very recent work includes [14], which builds on the same idea of coupling ns2 with an external tool modeling the power network using differential equations, and focuses on (soft) real-time simulation. We, in contrast, are interested in large-scale simulations that can run faster-than-real-time, as to evaluate coordination mechanisms over large periods of simulated time within a reasonable amount of execution time to allow for what-if analyses etc. Other recent work includes [15], where the authors again combine ns-2 with an electrical network simulator, OpenDSS. These are examples of co-simulation (co-operative simulation), which is a first step towards an integrated solution by combining multiple simulation environments. In this approach the individual components (e.g. power grid and communication network) can be simulated by different tools. The disadvantage of such an approach is that it involves iteratively running seperate electrical and communication network simulation. In this paper we present a modular simulation environment based on OMNeT++, where we make use of existing models for the communication network, but provide extra models for the elecrical network. III. OMN E T++ The smart grid simulator presented in this paper is implemented in C++ using the open-source OMNeT++ simulation environment. OMNeT++ is a discrete-event simulator that is mainly used for modeling communication networks and distributed systems [11]. The applicability of the OMNeT++ simulation environment in the context of smart grid research has been demonstrated by our own research [4] as well as in literature [16], [17]. We make use of existing models, such as INET [18], for the communication network, but provide extra models for the electrical network. An OMNeT++ model consists of simple modules and compound modules (which consist of other modules), that communicate by passing messages. Messages are sent via gates, which are the input and output interfaces of the modules. Input and output gates can be linked by connections, thereby forming communication links between modules. Fig. 1 illustrates the model structure in OMNeT++. The smart grid simulation environment uses connections between modules to model the topology of both the power grid and the communication network. Nodes within the topology are communication nodes
(e.g. routers and switches) and power grid components (e.g. transformers and smart appliances).
Fig. 1.
Model structure in OMNeT++ [11].
IV. S MART G RID S IMULATOR A. Objectives The smart grid simulator we are developing to facilitate smart grid research, clearly must be capable to simulate the power grid itself as well as the information and communication technologies that will be deployed in the smart grid. Therefore, the four main objectives of the smart grid simulation environment presented in this paper are: • Provide an environment that supports the development of control algorithms for energy management and their corresponding software architectures. • Enable the user to analyze the communication requirements and impact of specific communication technologies on the performance of control algorithms. Hence, the environment should be able to simulate different networking technologies and protocols. • Provide the tools to evaluate the impact of the control strategies on the power grid, i.e. by performing power flow calculations. • The simulation environment should be flexible and modular. Power grid and communication topologies have to be easily adaptable in order to support multiple scenarios (e.g. residential or industrial areas). Control algorithms have to be pluggable to ease evaluating different implementations. These four requirements should enable the user of the simulation environment to investigate different topics in the context of smart grid research. Example scenarios that could be performed in the environment are: • Development of smart charging algorithms that control and coordinate the charging of plug-in (hybrid) electric vehicles. Possible objectives in this context are reducing peak load, minimize energy costs, optimal usage of renewable energy sources, etc. • Optimization of the use of energy generated by photovoltaic (PV) panels in residential areas by using storage when there is excess generation or injecting stored/generated power into the grid when additional power is required. B. High-level design The smart grid simulation environment is designed as layered architecture in which three layers are defined: application,
middleware and support layers. The architecture is illustrated in Fig. 2. The application layer consists of high-level applications or services, for example advanced meter reading services, demand side management services, or billing services. The services in the application layer make use of the middleware layer, which provides generic functionality that can be used by any service. This includes a communication interface which can be used to send messages between components independent of the underlying networking technology (e.g. ZigBee or PLC; TCP or UDP) that is being simulated, discovery of devices or services, etc. The goal of this middleware layer is to support a broad range of applications while reducing the effort required to develop these services to a minimum. The support layer, composed of the network and electrical components, provides support functions for the layers above. Communication between services is simulated by the network component that provides simulation models for multiple types of physical media and communication protocols. The simulation environment must be able to model and interact with (virtual) electrical devices. This is supported by the electrical component of the simulator. Basic electrical models are provided (e.g. PV panel, battery, electric vehicle), but the user can add his own models. C. Modelling smart grid components The simulation model defines the topology of the power grid and the ICT infrastructure. The main building blocks of these topologies are Node modules, which can model electrical components (e.g. transformers), but also software services (e.g. automatic meter reading service) or a combination of both (e.g. an electric vehicle and smart charging software). A Node module provides two types of external interfaces: towards the power grid and towards the communication network. These interfaces are used to create the topology of the power grid and communication network. The Node module itself is responsible for the configuration of the layers, based on parameters that are provided by configuration files. D. Communication network model Multiple extensions to the OMNeT++ simulation environment are available in the form of libraries that provide simulation models for several wireless and wired networking protocols. The INET Framework [18] is an example of such a library that provides models for several wired and wireless networking protocols, including UDP, TCP, IP, IPv6, Ethernet, etc., and is used by the smart grid simulation environment. INET protocols are represented by OMNeT++ simple modules
Fig. 2.
Three layer architecture of the simulation environment.
that can be freely combined to form hosts and other network devices, such as routers, access points, etc. Once a network based on INET modules is assembled, it can be used to transfer messages between modules, taking into account the selected protocols, interconnections and various limitations. Due to the fact that these are all OMNeT++ modules, the communication network can be easily integrated in the smart grid simulation environment, by connecting the communication interfaces of our Node modules to those of the INET modules. E. Power network model Our current research activities focus on the distribution grid, as the major research questions to be addressed are in this part of the power network. To this end, we have currently implemented a model of the distribution grid, aimed at assessing potential problems, such as voltage violations stemming from distributed generation. Our model supports networks with a radial layout, that consist of one or more feeders, and each feeder in turn may include other subfeeders. Loads or generators can be connected anywhere along the feeders. The model is based on the fast harmonic simulation method presented in [19]. It uses an iterative forward/backward sweep method to analyse the radial distribution system. Each iteration consists of two parts: the backward and forward sweep. The backward sweep determines the currents in every node, based on known voltages in each node. Then, the currents in all network branches are determined. Next, the forward sweep determines the voltage at every node. After each iteration, the voltage at every node is compared with the voltage in the previous iteration. If the difference is below a certain threshold, the iteration process is stopped. The implementation of this model was realised as a MATLAB [20] module, that we linked to the OMNET++ modules through appropriate interfaces. F. Operation This section introduces the operation of the smart grid simulation environment: design of topologies, configuration of simulation parameters, execution environments and result processing capabilities. 1) Configuration: The topology of the power grid and communication network are configured in network configuration files by using the OMNeT++’s topology description language, NED, but it is also possible to generate or manipulate these topologies at-runtime from within the simulation environment. The configuration of the simulation environment (e.g. location of log files) and specific scenarios is performed in a separate configuration file. 2) Execution environments: Simulations can be performed by using a graphical user interface, that is ideal for demonstration or debugging purposes. The user is presented with a graphical view of the topologies (power grid and communication network) of the simulation, and message passing between nodes is illustrated. However graphical user interfaces are not usable when performing many simulations (e.g. for parameter sweeps), therefore it is also possible to perform simulations in batch without graphical user interface.
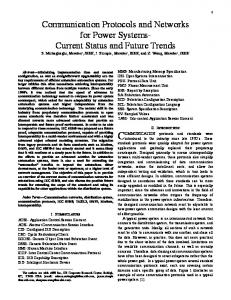
Fig. 3. High level view of the smart grid used in the case study. Power and communication connections are represented by full and dashed lines respectively. The “power simulator” and “time keeper” are support modules that are part of the simulation environment, but they do not represent components in the power grid.
3) Processing of results: The result processing features of the smart grid simulation environment are based on the features inherently provided by OMNeT++ (include logging of simulation results, calculating statistics, visualization of results, exporting of results to other data formats, etc.). Postprocessing by additional tools is readily available given the open data formats used. V. C ASE S TUDY A. Problem Statement As a case study we present a simplified setup, which is part of ongoing research. The objective is to determine the impact of distributed generation (in particular PV panels) in a distribution grid: given the available local generation capabilities and given consumption patterns of a residential low voltage segment, find the power flow and voltage fluctuations at the grid connection of each household. Based on this information, decisions can be made in favor of grid stability, e.g. turning off specific generators and/or increasing consumption in certain households. B. Simulation Model The setup contains a residential neighborhood, where a certain number of households have a PV panel installed. The power produced by the PV panels can either be transferred to the grid, or used for charging available storage components (e.g. batteries or heat storage). The charging of the storage components will be controlled by a coordination service which can either be deployed in the home for local coordination, or as a centralized service allowing coordination over all houses. The implementation of this scenario in OMNeT++, with a centralized service, is shown in Fig. 3. On the top left we find the coordination service, running on a host connected to the communication network (represented by the ictRouter cloud). The house icon on the top right represents multiple House modules, all of them connected to both the power and communication network. Power and communication connections are represented by full and dashed lines respectively. Fig. 4 shows the OMNeT++ representation of our House module. On the right side we have the ICT Router that acts as an access point to the communication network for all the other modules in the House. On the other side we have the SmartMeter, that acts
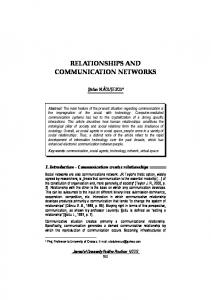
Fig. 4. OMNeT++ layout of the House module. Power and communication connections are represented by full and dashed lines respectively.
as the connection point to the power grid for the components in the House. The general layout of the simulation network given by the two figures, allows the creation of a wide variety of scenarios, depending on the parameters being set. Parameters include, but are not limited to: number of houses, percentage of houses with battery and/or PV panels, etc. For each individual house, we can configure the consumption profile, size of the PV installation, communication network capabilities (bandwidth, delay, etc.). Similarly, the time frame and power consumption/generation profiles can be easily configured, as well as the time resolution of e.g. the power network state calculations (every X minutes simulated time). C. Results & Discussion Simulation output includes detailed voltage and power flow analysis of the power grid. Metrics related to communication (e.g. number of sent messages or average delay) can also be extracted, depending on the research question being considered. As a sample output, we show the voltage fluctuations measured at the grid connection point of a certain house in a small low voltage segment of 15 houses, which are connected to the same feeder and phase. All houses have a rather large PV panel installation, allowing for generation peaks of up to 6kW on a single phase. For this simulation we use a time resolution of 15 minute intervals (i.e. every 15 min simulated time, the power network state is determined). The model used for the PV power generation is based on the European PV GIS [21] database adjusted with a random uncertainty factor that models the weather. The consumption profiles of each of the houses are base on synthetic load profiles (SLP), provided by the Flemish Regulation Entity for the Electricity and Gas Market (VREG) [22]. A local coordination system is implemented that monitors both the total consumption op the house and the generation by the PV panels. When the generated power is greater than the consumed power, the house is injecting power into the grid. When this injected power reaches a configurable threshold, the coordination system starts charging to battery, effectively lowering the injected power. In this specific simulation, the threshold was set on 500W. The voltage fluctuations measured in all three phases on the grid connection is shown in Fig. 5. We see a voltage increase
R EFERENCES
Fig. 5.
Voltage fluctuation due to PV generation.
of more than 10% in phase 1, compared to the nominal voltage. This is due to the high local power production on this phase. Clearly such variations are well outside permitted bounds set by the distrbution regulators [23], and will result in decoupling the genartion source from the grid. Hence correcting measures or control algorithms are required to avoid this while minimizing waste of potential green energy. VI. C ONCLUSION In this paper, we propose an innovative integrated smart grid simulation framework, that models and simulates both the communication network and power networks. The OMNET++ simulation environment we start from, as well as our own additional modules, are under active development, which means that simulation models are being improved and more are added on a regular basis. Therefore, the number of scenario’s that can be evaluated, which is already substantial, is growing on a regular basis. Moreover, we also demonstrated the extensibility and flexibility of the chosen platform by integrating a detailed (MATLAB) model of the distribution grid. Our case study demonstrates the capabilities of the environment by investigating the impact that distributed generation (i.e. PV panels) has on a distribution grid, i.e. on the voltage profile and load profile of a household. Simulation results indicate that under certain circumstances, voltage deviations of up to 10% higher than the nominal voltage can be observed. Intelligent control algorithms will be further developed to reduce such intolerable effects, by controlling storage and loads in order to benefit more from available renewable energy. The presented simulator will be crucial in assessing the effectiveness of such (distributed) control mechanisms. ACKNOWLEDGMENT Work presented in this paper has been supported by the Flemish Government through the LINEAR project (through IWT) and the project SmartE (an IBBT ICON project). K. Mets would like to thank the Agency for Innovation by Science and Technology in Flanders (IWT) for financial support through his Ph. D. grant. C. Develder is partially supported by the Research Foundation - Flanders (FWO - Vlaanderen) as a post-doctoral fellow. T. Vandoorn is supported by a Ph. D. fellowship of the Research Foundation - Flanders (FWO)
[1] –, “SMART 2020: Enabling the low carbon-constrained economy in the information age,” The Climate Group, Tech. Rep., 2008. [2] C. Boutin, “Commerce Secretary Unveils Plan for Smart Grid Interoperability,” Sep. 24 2009. [Online]. Available: http://www.nist. gov/smartgrid/smartgrid 092409.cfm [3] E. Coster, J. Myrzik, B. Kruimer, and W. Kling, “Integration Issues of Distributed Generation in Distribution Grids,” Proc. IEEE, vol. 99, no. 1, pp. 28–39, Jan. 2011. [4] K. Mets, T. Verschueren, W. Haerick, C. Develder, and F. De Turck, “Optimizing smart energy control strategies for plug-in hybrid electric vehicle charging,” in Proc. 1st IFIP/IEEE Int. Workshop on Management of Smart Grids, at 2010 IEEE/IFIP Netw. Operations and Management Symp. (NOMS 2010), Osaka, Japan, 19–23 Apr. 2010, pp. 293–299. [5] J. Lopes, F. Soares, and P. Almeida, “Integration of Electric Vehicles in the Electric Power System,” Proc. IEEE, vol. 99, no. 1, pp. 168–183, Jan. 2011. [6] –, “ICT for energy efficiency,” EU Commission, Tech. Rep., 2008. [7] G. Andersson, M. D. Ili´c and, V. Madani, and D. Novosel, “Network Systems Engineering for Meeting the Energy and Environmental Dream,” Proc. IEEE, vol. 99, no. 1, pp. 7–14, Jan. 2011. [8] –, “Hundreds of leading experts address global energy issues at first IEEE international conference on smart grid communications,” IEEE Commun. Mag., vol. 48, no. 11, pp. 12–15, Nov. 2010. [9] “OpenDSS,” http://sourceforge.net/projects/electricdss/. [10] T. Issariyakul and E. Hossain, Introduction to Network Simulator NS2. Springer, 2009. [11] A. Varga, “An overview of the OMNeT++ simulation environment,” in Proc. 1st Int. Conf. Simulation Tools and Techniques for Commun., Netw. and Systems (SIMUTools), Marseille, France, Mar. 3–7 2008. [12] E. Weing¨artner, H. Vom Lehn, and K. Wehrle, “A performance comparison of recent network simulators,” in Proc. IEEE Int. Conf. Commun. (ICC 2009), Dresden, Germany, Jun. 14–18 2009, pp. 1287–1291. [13] K. Hopkinson, X. Wang, R. Giovanini, J. Thorp, K. Birman, and D. Coury, “EPOCHS: a platform for agent-based electric power and communication simulation built from commercial off-the-shelf components,” Power Systems, IEEE Transactions on, vol. 21, no. 2, pp. 548 – 558, May 2006. [14] J. Bergmann, C. Glomb, J. G¨o andtz, J. Heuer, R. Kuntschke, and M. Winter, “Scalability of Smart Grid Protocols: Protocols and Their Simulative Evaluation for Massively Distributed DERs,” in Smart Grid Communications (SmartGridComm), 2010 First IEEE Int. Conf. on, Gaithersburg, MD, U.S., Oct. 4–6 2010, pp. 131–136. [15] T. Godfrey, S. Mullen, R. C. Dugan, C. Rodine, D. W. Griffith, and N. Golmie, “Modeling Smart Grid Applications with Co-Simulation,” in Smart Grid Communications (SmartGridComm), 2010 First IEEE Int. Conf. on, Gaithersburg, MD, U.S., Oct. 4–6 2010, pp. 291–296. [16] R. Mora, A. Lopez, D. Roman, R. Sanz, F. Lobo, F. Carmona, D. Mora, A. Cabello, A. Sendin, and I. Berganza, “Demand Management Communications Architecture,” in 20th Int.Conf. on Electricity Distribution (CIRED), Prague, Czech Republic, Jun. 8–11 2009, pp. 8–11. ˇ [17] C. M¨uller, S. Subik, A. Wolff, and C. Wietfeld, “A system design framework for scalability analysis of geographic routing algorithms in large-scale mesh networks,” in SIMUTools ’10: Proceedings of the 3rd International ICST Conference on Simulation Tools and Techniques. ICST, Brussels, Belgium: ICST (Institute for Computer Sciences, SocialInformatics and Telecommunications Engineering), 2010, pp. 1–7. [18] INET, “The INET simulation framework,” Jan. 2011. [Online]. Available: http://inet.omnetpp.org/ [19] L. Degroote, L. Vandevelde, and B. Renders, “Fast harmonic simulation model for the analysis of network losses with converter-connecter distributed generation,” Electric Power System Research, vol. 80, pp. 1332–1340, 2010. [20] “MATLAB,” http://www.mathworks.com/products/matlab/. [21] PVGIS, “Photovoltaic Geographical Information System (PVGIS),” http: //re.jrc.ec.europa.eu/pvgis/, Jan. 2011. [22] VREG, “Flemish Regulation Entity for the Electricity and Gas market (VREG).” Jan. 2011. [Online]. Available: http://www.vreg.be/ [23] Synergrid, “C10/11: specifieke technische voorschriften voor decentrale productie-installaties die in parallel werken met distributienet,” Synergrid, Tech. Rep., 2009. [Online]. Available: http://www.synergrid. be