Sep 30, 2003 - traffic departments, first and second responders, law enforcement ... across all projects and stakeholder types, the findings show some ...
Integrated Traffic Management and Emergency Response: Success Factors
By Michele D. Bunn and Grant T. Savage College of Commerce and Business Administration The University of Alabama Tuscaloosa, Alabama
Prepared by
UTCA University Transportation Center for Alabama The University of Alabama, The University of Alabama in Birmingham, and The University of Alabama at Huntsville UTCA Report Number 01101 September 30, 2003
Technical Report Documentation Page 1. Report No FHWA/CA/OR-
2. Government Accession No.
3. Recipient Catalog No.
4. Title and Subtitle
5. Report Date
Integrated Traffic Management and Emergency Response: Success Factors
September 30, 2003
7. Authors
8. Performing Organization Report No.
Drs. Michele D. Bunn and Grant T. Savage
UTCA Report 01101
9. Performing Organization Name and Address
10. Work Unit No.
College of Commerce and Business Administration The University of Alabama Box 870221 Tuscaloosa, Alabama 35487-0221
6. Performing Organization Code
11. Contract or Grant No.
DTSR0023424
12. Sponsoring Agency Name and Address
13. Type of Report and Period Covered
University Transportation Center for Alabama Department of Civil and Environmental Engineering University of Alabama Box 870205, Tuscaloosa, AL 35487-0205
Final Report January 1, 2001 – September 30, 2003 14. Sponsoring Agency Code
15. Supplementary Notes
16. Abstract
Intelligent transportation systems (ITS) hold much promise for coordinating traffic management with other important incident management tasks in a way that is more efficient and provides greater benefits to the public as well as to the various stakeholders. Numerous breakthrough technologies and rapidly decreasing technology costs are making this possible. A major barrier to project success, however, is the stakeholder process required for multiagency, multi-jurisdictional projects. An unprecedented level of cooperation and coordination is required from traffic departments, first and second responders, law enforcement agencies, commercial private sector organizations, and other government and non-profit agencies. This project developed and conducted a quantitative survey of stakeholder relations in the deployment of integrated traffic management and emergency response systems. The purpose was two-fold: 1) to develop generalized metrics of stakeholder perceptions and relationships and 2) to calibrate important success factors of integrated programs . The goals include determining what works and what does not work – and the circumstances that affect success or failure. The report provides detailed descriptions of the various metrics for measuring project characteristics and stakeholder relationships. The findings indicate that seven factors influence the success of the project: 1) the stage of the project; 2) the efficacy of the project; 3) the uncertainty surrounding the project; 4) the stakeholder’s involvement in the project; 5) the stakeholder’s perceived power to influence the project; 6) the public benefit derived from the project; and 7) the sense of equality among stakeholders. In addition to these findings that hold across all projects and stakeholder types, the findings show some significant differences in the way stakeholder groups view one another. Understanding these differences, and the factors related to success, can benefit those participating in and facilitating stakeholder processes.. 17. Key Words
18. Distribution Statement
Integrated, Traffic management, Safety, Stakeholders, Success Factors 19. Security Classif (of this report)
20. Security Classif. (of this page)
Unclassified Unclassified Form DOT F 1700.7 (8-72)
21. No of Pages
22. Price
Table of Contents Section Number and Topic Page Contents................................................................................................................... ii List of Figures......................................................................................................... iv List of Tables. ........................................................................................................ iv Executive Summary............................................................................................... vi 1.0 Introduction...................................................................................................... 1.1 Problem Statement..................................................................................... 1.2 Overall Project Approach...........................................................................
1 1 1
2.0 Conceptual Framework of Project Success...................................................... 2.1 Traffic Incident Management (TIM).......................................................... 2.2 TIM Viewed as a “Multi-Sector Innovation”............................................. 2.3 Socio- Technical Systems........................................................................... 2.4 Evaluation of ITS Integration Projects...................................................... Technical Evaluation..................................................................................... Non-Technical Evaluation............................................................................ 2.5 Research Framework..................................................................................
3 3 5 6 8 9 10 11
3.0 Research Methodology..................................................................................... 3.1 Sampling Frame......................................................................................... 3.2 Data Collection........................................................................................... Survey Instrument and Procedures............................................................... 3.3 Response Characteristics............................................................................ Response Rate............................................................................................... Respondent Characteristics........................................................................... Organizational Characteristics..................................................................... Project Characteristics.................................................................................. Stakeholder Involvement............................................................................... 3.4 Measurement Development....................................................................... Underlying Project Benefits.......................................................................... Project Challenges and Enablers................................................................... Perceived Success......................................................................................... Stakeholder Relations and Perceptions......................................................... Stakeholder Management Strategies............................................................. Summary of Research Measures...................................................................
13 13 14 14 17 17 19 20 21 23 24 25 27 31 31 34 35
4.0 Results............................................................................................................... 4.1 Predictors of Success.................................................................................. 4.2 Significant Differences Between Stakeholder Groups.............................. Transportation Stakeholder Group............................................................... First and Second Responders Group............................................................. Law Enforcement Group...............................................................................
37 37 40 43 44 44
ii
Table of Contents (continued) Section Number and Topic Page Commercial Private Sector Group................................................................ 45 Other Government or Non Profit Stakeholder Group................................. 45 5.0 Project Conclusions and Recommendations................................................... 5.1 Discussion of Key Findings...................................................................... Success Factors............................................................................................. Group Differences in Stakeholder Perceptions and Strategies….................. 5.2 Recommendations..................................................................................... 5.3 Future Research......................................................................................... 5.4 Closing Comments.....................................................................................
46 46 46 49 51 52 53
Appendices............................................................................................................. A References................................................................................................... B List of Projects in the Sample......................................................................
55 56 60
iii
List of Figures No. 2-1 2-2 3-1 3-2 3-3 3-4 3-5 3-6 3-7 4-1
Caption Dynamic representation of socio-technical system.................................... Conceptual model of project success.......................................................... Home page for survey................................................................................. Questionnaire preview page........................................................................ Dynamic online survey sequence................................................................ Response tracking page............................................................................... Response frequencies on knowledge question............................................ Organization’s innovativeness.................................................................... Number of stakeholders involved in each project....................................... Final Model of success factors....................................................................
Page 7 12 14 15 15 17 20 21 24 40
List of Tables No. 2-1 2-2 3-1 3-2 3-3 3-4 3-5 3-6 3-7 3-8 3-9 3-10 3-11 3-12 3-13 3-14 3-15 3-16 3-17 3-18 3-19 3-20 3-21 3-22 3-23 3-24
Caption Evaluation metrics used to date in ITS projects............................................ Terminology used to analyze institutional issues......................................... List of Stakeholders...................................................................................... Response rate................................................................................................ Nature of response by stakeholder group...................................................... Distribution of stakeholder groups among respondents................................ Respondents’ self-reported knowledge of the project................................... Responding organizations’ size.................................................................... Projects with four or more respondents........................................................ Frequency of integration elements included in the project........................... Number of integration elements in reported projects.................................... Stage of reported project............................................................................... Other Stakeholder groups involved in the reported projects........................ Relevancy of project benefits....................................................................... Factor analysis results for project benefits.................................................. Scale properties for benefit factors.............................................................. Relevancy of stakeholder process challenges.............................................. Factor analysis results for challenges.......................................................... Scale properties for challenges.................................................................... Relevancy of stakeholder process enablers.................................................. Factor analysis results for enablers.............................................................. Scale properties for enablers........................................................................ Four- item success scale............................................................................... Scale properties for perceived success........................................................ Five- item salience scale............................................................................... Scale properties for salience scale...............................................................
iv
Page 9 10 16 18 18 19 19 20 22 22 23 23 24 25 26 27 28 28 29 29 30 30 31 31 32 32
List of Tables (continued) No. 3-25 3-26 3-27 3-28 3-29 4-1 4-2 4-3 4-4 4-5 4-6
Caption Original items for urgency, power and legitimacy..................................... Factor analysis results for urgency, power and legitimacy items............... Scale properties for urgency, power and legitimacy................................... Stakeholder management strategies............................................................ Research measures...................................................................................... Results of stepwise regression models (Success as the dependant variable)....................................................................................................... Model summary........................................................................................... Coefficients.................................................................................................. Results of stepwise discriminant analysis (Stakeholder groups as dependant variable)...................................................................................... Quantitative differences between stakeholder groups.................................. Descriptive differences between stakeholder groups...................................
v
Page 33 34 34 35 36 37 38 40 41 42 43
Executive Summary The rate of deployment of Intelligent Transportation Systems (ITS) in the United States has increased dramatically in the last fe w years. ITS represents a growing number of applications, from advanced traffic signal control systems, to electronic transit fare payment systems, to ramp meters, to collision warning systems. Of particular interest in this study, ITS holds much promise for coordinating traffic management with other important incident management tasks in a way that is more efficient and provides greater benefits to the public as well as to the various stakeholders. Numerous breakthrough technologies and rapidly decreasing technology costs are making ITS incident management programs feasible in a wide range of situations. Consequently, there has been much attention paid to the technical challenges of integrated traffic incident management (TIM) programs and significant progress has occured to develop evaluation metrics to measure the benefits and costs of deployment. A major barrier to project success, however, is the stakeholder process required for multi-agency, multi- jurisdictional projects. An unprecedented level of cooperation and coordination is required from traffic departments, first and second responders, law enforcement agencies, commercial private sector organizations, and other government and non-profit agencies. Thus – at the same time as resources are being expended to understand the technical requirements of TIM – there is wide-spread recognition of the importance of stakeholder relations and stakeholder management strategies in the rate of deployment and ultimate success of TIM projects. Many studies have reported on lessons learned from previous stakeholder- intensive projects to document the complexity and importance of stakeholder relations. Yet, to date, no studies have quantified these issues. This project developed and conducted a quantitative survey of stakeholder relations in the deployment of integrated traffic management and emergency response systems. The purpose was two- fold: 1) to develop generalizable metrics of stakeholder perceptions and relationships and 2) to calibrate important success factors of integrated programs to reach clear conclusions about what works and what doesn’t work – and the circumstances that impact success or failure. The project relied on survey research methods to specify a research model, create measures of the research variables, develop an appropriate sampling frame, administer the survey, analyze the results, and report and share the findings. Based on an extensive review of previous research to document stakeholder issues in integrated ITS projects, we developed a conceptual model of project success. The model specifies eight topical areas as an organizing framework to understand the influences on project success. For each of these conceptual areas, we developed various metrics to assess their impact on perceived success and to understand the differences among types of stakeholder organizations : 1. Individual characteristics 2. Organizational characteristics
vi
3. 4. 5. 6. 7. 8.
Project characteristics Project benefits Process challenges Process enablers Stakeholder perceptions Stakeholder management strategies
Metrics were developed for social-system concepts related to each of these eight areas. Some of these are single-item measures (such as individual knowledge of the project and stage of the project). Others are represented by multiple- item measures (such as the four- item success scale and the five-item measure of stakeholder “salience”). Still others were developed using an exploratory factor analysis technique to identify underlying themes from a longer list of items (such as “organizational inertia” which is represented by three items: lack of support from higher-ups, lack of cooperation within one’s own organization, and too much red tape). We used a dynamic on- line survey to capture the data. Respondents were sent personalized email messages that included a unique username and password to access the survey website. To begin, the respondent described the project in which the organization was involved and indicated the number and type of stakeholders participating in the project. Then, in subsequent sections of the survey, there were questions dealing with the respondent’s own organization and the organization’s relationships with three of the other participating stakeholder groups. In this way, the web-based questionnaire was customized for each respondent by presenting questions related to the specific stakeholder groups named by the respondent. The data reported in the study represent the opinions of 350 respondents from a sample of over 2200 potential respondents who were reportedly involved in ITS integration projects. Aside from reporting the development of metrics for the concepts listed above, the main results of the survey concern the following important questions: • From the numerous concepts identified and measured in the study, which of these are related to project success? • Of those concepts that are significantly related to project success, what is the relative importance of each? • How do the different stakeholder groups perceive one another? The findings indicate, from among a broad set of project characteristics and stakeholder relationship measures, there are seven factors related to the success of the project. Each is listed below from the largest to smallest impact on project success along with a summary of the key implications and recommendations: 1. Stage of the project Respondents reported that projects were more successful in the later stages (implementation and expansion) than in the earlier stages (planning and design). The “Other Government or Non Profit” stakeholder group was more involved in the earlier stages, while the other stakeholder groups were more involved in later stages. The finding indicates the varying roles of different stakeholder groups over the course of the project
vii
2.
3.
4.
5.
6.
7.
and the need for early intervention in projects to diffuse and eliminate potential problems in the earlier stages. Efficacy of the process The exploratory factor analysis discovered an important factor we named “efficacy.” Projects were more successful if there was clear accountability, necessary resources, and the participants were able to deal with conflict. The discovery of these aspects of process enablers, as opposed to others, provides much needed guidance for the facilitation of stakeholder processes and for future research. There was no difference across the stakeholder groups on efficacy. Uncertainty When members of one’s own organization were skeptical about the outcomes of the project, the respondents reported lower success rates. From among five process challenges studied, this one emerged clearly as an influence on project success. More focus on this process challenge is needed to understand the nature of the uncertainty. Stakeholder participants (often, the champions of the project) need materials and strategies for reducing the uncertainty they face within their own organizations. Uncertainty seems to be a consistent problem across all stakeholder groups. Stakeholder involvement Organizations that had greater direct involvement experienced higher project success than those with less involvement. The greatest level of involvement was reported by the Transportation and Commercial Private Sector stakeholders, while the lowest level of involvement was reported by First and Second Responders. Stakeholder perceived power When the respond ent’s own organization reported greater perceived power, there was also a sense that the project was more successful. This power was mostly derived from a resource base and the ability to move the project forward. The Transportation group perceived the most power while the Law Enforcement and Other Government or NonProfit stakeholders perceived the lowest level of power. Public benefit derived from the project Projects with greater public benefit were perceived as being more successful. This seems obvious on the surface; however, it also means that participant stakeholders face a challenge on projects with internal organizational benefits that are only indirectly related to public benefits. While the importance of public benefits was consistent across stakeholder groups, the importance of internal organizational benefits varied. Sense of equality among stakeholders. The least impact on perceived project success – but still statistically significant – came from a sharing of power among the participant stakeho lders. This seems to balance against the finding related to perceived power – that is, stakeholders believe the project was successful if their own organization held power, but a sense of equality with other stakeholders adds to the success of the project.
In addition to those noted above, the findings show other significant differences in the way stakeholder groups view one another. The Transportation stakeholders dominated the TIM projects, but reported some internal difficulties (little innovativeness and more organizational inertia). The First and Second Responders reported the lowest level of perceived project success,
viii
which seems to be related to less knowledge, less involvement, and lower power and legitimacy as perceived by others. Law Enforcement holds a unique position – with less involvement and power, but viewed as highly legitimate by others, they reported higher project success. The Commercial Private Sector stakeholders appear to have a somewhat mixed position among stakeholders – their organizations are innovative, they are highly involved, have much knowledge of the project, yet their legitimacy as perceived by others is lower and they are pressured by the other stakeholders. Although the Other Government or Non-Profit stakeholders believe their organizations are more innovative than others, they were involved only in earlier stages of the projects, reported lower power (consistent with perceived lower salience by others) and reported variable success on the TIM projects. These findings are critical to both Alabama and national stakeholders who recognize the benefits of working to integrate traffic management and emergency response systems and the need to make the best use of their limited resources toward this goal. Understanding the factors related to success and the differences between the stakeholder groups provides guidance for those participating in and facilitating stakeholder processes involved in TIM projects. The larger contribution of this research, however, is the identification of which socio logical aspects of stakeholder relationships are most important with regard to TIM projects. This is vital because there have been numerous and varied aspects reported in “lesson learned”, but no way to prioritize and calibrate them. Nonetheless, a great deal of additional work is needed to develop these into quantitative metrics that can be measured, tracked, and compared over time – much in the same way the technical aspects of TIM projects. The overriding goal of the reported research was to take initial steps in this direction and to raise the level of attention paid to developing metrics of stakeholder interactions.
ix
1.0 Introduction This section provides a brief overview of the problem addressed in the research study and the basic project approach and methods used to address the problem.
1.1 Problem Statement Departments of transportation at the local, regional, state and federal levels in the United States are recognizing the potential to improve traffic management by using Intelligent Transportation Systems (ITS). Many areas – varying widely in both size and level of traffic congestion – either operate ITS programs, or are considering their implementation. Consequently, there has been a substantial increase in spending on ITS technologies in recent years with many other projects in the planning. There is enormous interest in the potential advantages of integrating traffic management and safety systems by pooling and leveraging resources. One area in particular, Traffic Incident Management (TIM), holds much promise to apply ITS technologies to achieve greater benefits within limited budgets. There has been much research to measure and document the benefits of ITS projects and these are clearly understood. Projects such as TIM, however, require a high level of coordination among agencies that have previously been independent. It is therefore widely recognized that stakeholder issues are critical to the success of TIM projects. Unfortunately, less is known about the stakeholder processes that lead to well- implemented TIM projects. Previous research on stakeholders has been qualitative in nature – mostly developing lists of “lessons learned.” The lessons learned vary widely from project to project and tend to be quite broad and generic. Shareholder issues tend to be evaluated after the fact, using loosely defined concepts, and there has never been any way to quantify the stakeholder success factors related to the integration of traffic management and emergency response. Rather than exploring and solving the institutional and stakeholder issues each time a new project is pursued, participants need to learn from the experiences of others across the country. Thus, there is a clear need to calibrate important success factors of integrated ITS programs as a way to reach clear conclusions about what works and what doesn’t work, and the circumstances that impact success or failure.
1.2 Overall Project Approach This research project builds on the work performed in a previous UTCA study, “Feasibility of an Integrated Traffic Management and Emergency Communication System for Birmingham, Alabama” (UTCA Number 00110) (Bunn and Savage 2000). The previous study revealed the significance of institutional and stakeholder issues in integrated ITS projects. Most importantly,
1
the previous study catalogued a number of challenges and enablers regarding stakeholder relationships that serve as a qualitative foundation for the project reported here. This project uses social science survey methodology to develop metrics of stakeholder perceptions and project success. The project relies on the methods of survey research to specify a research model, create measures of the research variables, develop an appropriate sampling frame, administer the survey, analyze the results, and report and share the findings. We obtained support from the Intelligent Transportation Society of America (ITSA) Public Safety Forum for each of the project stages. To the best of our knowledge, these methodologies have not been used previously to address the research problem related to stakeholder success factors.
2
2.0 Conceptual Framework of Project Success This section of the report provides background information collected during the literature review stage and then develops and describes a model of stakeholder concepts related to project success. We define and discuss the nature and process of Traffic Incident Management (TIM) and provide insights from two other areas of the literature, “multi-sector innovations” and “socio-technical systems.” We then review and report on the current methods of ITS evaluation, including both technical and non-technical evaluations. Finally, we synthesize the findings from the literature review and present a conceptual framework which serves as the basis for the remainder of the study.
2.1 Traffic Incident Management (TIM) It is projected that by 2005, traffic incident-related congestion will cost the United States public over $75 billion in lost productivity and will result in over 8.4 billion gallons of wasted fuel. In addition to wasted time, and injury or death from the primary incident, traffic incidents have a great effect on the safety of responders and on the mobility of the traveling public. Traffic incidents contribute to secondary deaths and injuries of responders, response equipment damage, motorist injuries through secondary crashes, and the cost and time of traffic delay in urban and rural areas. Integrated traffic incident management (TIM) is emerging as a proven solution to address these safety and mobility concerns (FHWA 2001). Research and analysis indicates clearly that – in comparison to other approaches and programs – traffic incident management is one of the most cost effective ways to achieve delay reductions. Traffic incident manage ment is therefore becoming more widely recognized at both state and national levels as a significant means to improve travel safety, reduce delays, increase customer satisfaction, and positively affect the level of vehicle pollution (ITS-JPO 2001). Traffic incident management is defined as an operational strategy for a transportation network that involves a coordinated and planned inter-jurisdictional, cross-functional, multidisciplinary, and ongoing approach to restore traffic to normal conditions after an incident occurs, and to minimize the delay caused by the resulting disruption to traffic flow. Incident management involves an identifiable series of activities, which can be carried out by personnel from a variety of response agencies and organizations. The incident management process can be characterized as a set of activities that fall into the following seven categories, but do not necessarily take place in this sequential order. Detection is the process by which an incident is brought to the attention of the agency/agencies responsible for maintaining traffic flow and safe operations on the facility. This can occur by mobile telephone call, automatic vehicle location (AVL) combined with detection software, police patrols, etc.
3
Verification entails confirming that an incident has occurred, determining its exact location, and obtaining as many relevant details about the incident in order to dispatch the proper initial response. This is usually completed by the first responders on the scene. Motorist Information involves activating various means of disseminating incident-related information to affected motorists through commercial radio broadcasts, variable message signs, etc. Response includes dispatching the appropriate personnel and equipment, and activating the appropriate communication links and motorist information media as the incident is verified. It requires preparedness by each responding agency or service provider. Site Management is the process of effectively coordinating and managing on-scene resources. The foremost objective is to ensure the safety of response personnel, incident victims, and other motorists. Traffic Management involves the application of traffic control measures in areas affected by an incident. Traffic control in the incident management context is based on planning to include availability of traffic control equipment and materials, knowledge of available fixed traffic control resources, and alternate route planning. Clearance is the process of removing wreckage, debris, or any other element s that disrupt the normal flow of traffic, and restoring the roadway capacity to its pre- incident condition. Efficient management and coordination of the responses during incident management is essential to reducing the nega tive impact of incidents on safety and traffic flow, but coordinating the different agencies and jurisdictions can be challenging, given their diverse institutional functions and individual agency goals. The organizations typically involved with most incidents are law enforcement agencies, fire and rescue agencies, transportation agencies, hazardous materials cleanup services, towing and recovery companies, public/private traveler information providers, and transit agencies. Their relationships, especially key management personnel, form the basis for coordinating and managing response to an incident (OTM 2000). Unfortunately, traffic incident management is not the core purpose of any one response agency. The stakeholders involved in an integrated system of incident management often have divergent goals and may have distinct tools for achieving these goals. Viewed from the perspective of the emergency medicine community, improvements in response times have beneficial effects on human health through earlier treatment and delivery of injured or sick patients to hospitals. For example, vehicle crashes are sometimes caused by heart attacks, strokes, or other cardio-vascular problems. Crashes may also cause cardio-vascular trauma. Obviously, as this glimpse of the emergency medical perspective indicates, the various stakeholders are preoccupied with their own specific organizational missions. Thus, while the safe and effective removal of injured occupants from a motor vehicle crash may be the top priority of ambulance personnel, police and fire responders are principally concerned with scene safety and investigation. Traffic managers
4
are simultaneously concerned with the removal of the disabled vehicle to re-establish adequate flow and reduce congestion. Traffic incident management is obviously a complex user service that requires integration with numerous other user services. Effective incident management requires not only the latest technological tools, but also demands a multi-agency, multi- jurisdictional approach for success. Yet, individual agency “champions” often decide that their own agency can be more effective through collaborative efforts and these champions take the initiative to coordinate with other agencies. Thus, while the technological aspects are clear, the impact and importance of the “human” side cannot be minimized. In fact, the institutional and organizational aspects often “make or break” the success of an integrated traffic incident management program. In order to shed light on these and other stakeholder issues surrounding traffic incident management programs, we considered a number of literature bases in the social science and engineering areas. Two bodies of literature in particular provide additional concepts on which an appropriate conceptual framework could be developed. In the following section, we explain the idea of a “multi- sector innovation” and the reasons why it is useful to view integrated ITS programs in this manner. Following that, we consider the concepts related to “socio-technical” systems and draw conclusions that provide further insights on stakeholder issues and success factors.
2.2 TIM Viewed as a “Multi-Sector Innovation” Traffic incident management is clearly an emerging innovation in both the traffic management and emergency responses arenas. The literature on innovation provides numerous insights as to why TIM is challenging. To draw conclusions, we considered various definitions and perspectives on innovation and developed the concept of a multi- sector innovation. A review of the literature on innovation and diffusion reveals several distinct schools of thought as to just what an innovation is and why one might happen. The "school" which has been most influential is based on the work of Everett Rogers. He defines innovation as "an idea, practice, or object that is perceived as new by an individual or other unit of adoption" (Rogers 1983). This school views innovation and diffusion as distinct processes, takes the need for the innovation as given, treats technology as a free-standing object independent and devoid of cultural meaning, and views problems of diffusion as ones of communication and persuasion. At issue is the potential adopters’ behavior (i.e., attitudes and personality) – rather than their ability to adopt, and the ability of the agent promoting the innovation to persuade the potential adopter. In contrast to the Rogers school, others have argued that innovation and diffusion are not separate processes – that innovation is essentially the first step in the diffusion process – and that potential adopters’ decisions are based on rationality rather than persuasion. In this school, innovations are ideas or technologies which are continually adapted as they are adopted, and represent sequential socio-cultural change. We believe traffic incident management programs are more usefully viewed within this second school of thought.
5
There are many different types and variations of innovations, however, and we therefore considered how to categorize traffic incident mana gement. Innovations are often characterized on a continuum from “incremental” to “radical” (Abernathy and Utterback 1978). At one end of the spectrum are innovations that are incremental, continuous, and sustaining in nature. These innovations involve the gradual accumulation of useful variation and incremental change over current technologies (Engel, Blackwell and Miniard 1986), requiring only minimal learning and change in behaviors. They have been described as “the improvement an industry creates as it introduces new and more-advanced products to serve the more-sophisticated customers at the high end of the market” (Christensen, Bohmer and Kenagy 2000). Discontinuous, disruptive, and radical innovations lie at the other end of the innovation continuum. These innovations involve a high degree of change, and aim to “change the dimensionality of the consumer decision process and to revolutionize product markets” (Cooper 2000). Radical innovations are also conceptualized as technological discontinuities that “advance by an order of magnitude the technological state-of-the-art which characterizes an industry” (Anderson and Tushman 1990), and offer “fundamental mechanisms through which the quality of our lives has improved” (Christensen, Bohmer and Kenagy 2000). It appears that traffic incident management involves a variety of these different types of innovations and the scope of adoption goes beyond a single type of organization. We refer to these as “multi- sector innovations.” Their characteristics include: powerful effects on the political, behavioral, economic, social, and technological environments; both public and private sector participation; blending of old and new technologies; and both lateral and vertical relationships within and across sectors. Multi-sector innovations are unique and rare, yet an extremely important type of innovation because their impact is broad in scope and long- lasting. The most important difference between multi-sector innovations and other types of radically new products is the relevance of a wide range of organizations or “stakeholders” influencing the success of the innovation. Examples of other multi-sector innovations include the development of biotechnology products, satellite cable TV, and alternative energy sources. Recognizing integrated traffic incident management programs as a multi- sector innovation provides a broader scope for research and takes into consideration the unique role of stakeholder relations in deploying this type of innovation.
2.3 Socio-Technical Systems Because it is a multi-sector innovation, the success of an integrated traffic incident management program rests on a unique set of challenges involving both technological and institutional issues. Today there are many initiatives addressing the technological issues related to these programs. The ITS National Architecture assists in the development and understanding of the components of an ITS system as well as the movement of information between component parts of the systems. Particularly relevant to transportation-public safety integration is the Emergency Management Subsystem (U.S. DOT 1997) and standards such as the Institute of Electrical and Electronics Engineers’ (IEEE) number 1512 (IIEE 1999) for incident response which further
6
enhance the technical specifications. Thus, important technological issues (i.e., interoperability) are receiving much attention and have benefited from enormous progress in recent years. Although the technological issues have been at the forefront, and are vital to the success of any ITS integrated program, there remains little guidance available for dealing with the institutional and stakeholder issues. More and more, issues are being raised about the impact of stakeholders and the volume of discussion on these issues has increased substantially (ASHTO 2002). The socio-technical systems approach therefore helps to guide the issues for study. The socio-technical systems (STS) approach has grown and evolved in the academic literature for over five decades. Trist and Bamforth (1951) were among the first to articulate the need to consider social subsystems in overall process performance. STS has since become a widely recognized tool in work system analysis and redesign. The basic premise is that a work system depends on the social and technical components becoming directly correlated to produce a given goal state. The components are viewed as co-producers of a desired outcome – each with distinctive characteristics that must be respected so their complementarities can be realized (Leavitt 1965, Mumford and Weir 1979). The social subsystem includes the interactions and relationships between individuals and teams, norms of behavior, employer-employee contracts, and the reactions to certain work arrangements and conditions (Pasmore and Sherwood 1988) – in other words, how people work together in a specific work setting or environment (Eijnatten 1998). As shown in Figure 2-1, the two systems are interdependent.
Technical System
Social System
Figure 2-1: Dynamic representation of socio-technical system
The socio-technical approach to system analysis and redesign relies heavily on a concept known as joint optimization. Under the concept of joint optimization, an effective system establishes a balance between technology and the people involved in applying technology (Shani, et. al. 1992). Overall, the process of STS has been implemented in a variety of settings including: manufacturing (Taylor and Felten 1993), computer operations (Taylor 1986), healthcare
7
(Chisholm and Ziegenfuss 1986), nursing (Happ 1993), information technology (Shani and Sena 1994), and office technology (Pava 1986). Despite the obvious benefits, efforts to integrate traffic management with emergency response are stymied by various institutional barriers. The divisiveness of the various stakeholders has been accentuated in the past because of the technological issues surrounding interoperability and the enormous level of resources required to overcome barriers to integration. The technological challenges must be addressed in parallel to the institutional and organizational issues. The application of the socio-technical approach recognizes the critical role that stakeholder relationships, behaviors, and strategies play in the successful implementation of traffic incident management projects.
2.4 Evaluation of ITS Integration Projects As part of the process of developing a research framework for dealing with these issues, we next considered current methods of evaluating ITS integration project. Evaluations are critical to ensuring progress of integrated intelligent transportation systems and achieving ITS deployment goals. Evaluations are also critical to an understanding of the value, effectiveness, and impacts of the National ITS Program activities, and allow for the program's continual refinement. The National ITS Program has undertaken assessment activities to satisfy these needs, and to use the spirit behind the Government Performance and Results Act (GPRA) to ensure the ITS program meets U.S. DOT’s goals (ITS-JPO 2003a). Both program outputs and outcomes are emphasized. (Another activity is outreach, where evaluation results are communicated to select target audiences in ways that are meaningful to them.) Program outputs track the progress of a program (e.g., the number of toll plazas equipped with electronic toll collection capability). For the National ITS Program, "output" is defined as the amount of integrated ITS deployed across the nation. The ITS Deployment Tracking Database contains the results of surveys of metropolitan areas regarding how much ITS equipment they actually have deployed. The ITS Deployment Tracking Web Site (ITS-JPO 2003b) provides access to information on the deployment and integration of ITS technology gathered through a series of nationwide surveys, beginning in 1996 and continuing to 2002. This site contains the latest update to the data from a survey of over 2200 state and local agencies carried out in 2002. Program outcomes track the benefits of a program from the perspective of the end-user (e.g., reduction in delay waiting to pay tolls). Program outcomes were originally spelled out according to a few key measures of program effectiveness derived from the 1992 document “Strategic Plan for Intelligent Vehicle Highway Systems in the United States” (IVHS America 1992). These measures apply across all infrastructure and Intelligent Vehicle Initiative (IVI) areas of the program. Since 1994, the U.S. DOT’s Joint Program Office for Intelligent Transportation Systems has been collecting information regarding the impact of ITS projects on the operation of the surface transportation network. Data collected under this effort is available in the ITS Benefits Database.
8
The ITS Joint Program Office (JPO) also collects information on ITS costs, and maintains this information in the ITS Unit Costs Database. The database is a central site for estimates of ITS costs data that the ITS JPO can use for policy analyses and benefit / cost analyses (ITS-JPO 2003c). The Intelligent Transportation Systems Benefits and Costs 2003 Update (ITS-JPO 2003d) represents a culmination of the U.S. DOT's active 10- year data collection on the impact of ITS projects on surface transportation and the cost of implementing them. The report is a continuation of a series of reports providing a synthesis of the information collected by the U.S. DOT’s ITS Joint Program Office (JPO) on the impact of ITS projects on the operation of the surface transportation network. In addition, under ITS Evaluation sponsorship, in-depth studies are conducted concerning modeling and simulation of the impact of ITS deployments, estimating the costs and benefits of ITS technologies, determining user acceptance of ITS products and services, and investigating institutional and policy issues related to ITS. In this way, the ITS Evaluation program includes both technical and non-technical evaluations. Technical Evaluation The technical evaluations of ITS integrated incident management systems come from two key sources: field operational tests and deployment evaluations. The metrics for technical evaluations have evolved since JPO was first created. The latest metrics of performance are organized by benefit areas. Table 2-1 gives a summary of the latest categories of benefits and the associated measures. Certain measures are relevant to specific program areas. For example, red-light violations are relevant to Arterial Management but are not relevant to Electronic Payment. Table 2-1: Evaluation metrics used to date in ITS projects Benefit Area
Measure
Safety Improvements
red-light violations accidents passenger assaults incidents dispatch center notification time fatalities vehicle speeds
Delay Savings
peak period travel time street congestion delay on-time bus performance closure time vehicle delay on-time reliability clearance time
Throughput
freeway volume peak period throughput vehicles per hour
9
Table 2-1: Evaluation metrics used to date in ITS projects (continued) Benefit Area Customer Satisfaction
Measure "better off" support complaints "thank you" letters feelings of security adjustments to departure times changed route useful accurate
Cost Savings
rolling stock injury accidents ridership and operating costs duration of stall incidents efficiency fare evasion data collection transfer slips work schedules labor costs fuel consumption repair consideration emissions noise
Environmental
These various measures of outcomes are useful for assessing the ultimate success of ITS deployments. What is not measured, however, are the more qualitative aspects of the planning and deployment process. Non-Technical Evaluation Although the benefits of ITS applications are broad reaching, the costs of the systems are fragmented and difficult to quantify, and the investment responsibility is unclear. Hence, public and private sector cooperation is critical. Consequently, the leadership for deploying these integrated systems is unavoidably dispersed and the institutional and stakeholder issues may present the greatest challenge to the realization of an integrated system. Non-technical evaluations therefore focus on best practices related to ITS project development and implementation. The primary outcomes of non-technical studies have been the identification of these and other institutional issues, a catalog of problems encountered, and lists of lesson’s learned. The methods are mostly qualitative – case studies, focus groups, or personal interviews. Two studies in particular are noteworthy because of their scope and rigor. Both the International Association of Chiefs of Police (IACP 2000) and the University of Virginia Smart Travel Laboratory (UVA 2000) have conducted studies of best practices in information integration projects for public safety. These were large scale “benchmarking” type studies that involved indepth interviews and examination of documents. These studies articulated several categories of issues that are useful in a wide range of contexts: 1) individual issues (self preservation and turf protection, feelings of uncertainty, and threat to personal competence), 2) institutional barriers (separation of power across jurisdictions, tenuous federal-state-local relationships, and political factors), and 3) systemic constraints (complexity, techno logical capacity, proprietary systems, and inadequate technical workforce) (IACP 2000).
10
As another input to the UTCA study, we reviewed these and many other reports of this nature to identify the most common issues and terminology. Table 2-2 provides a representative list of the terminology used when discussing institutional issue s in these non-technical evaluations. Table 2-2: Terminology used to analyze institutional issues Terms Trust Training Accountability Communication Satisfaction Leadership Champions Resistance to Change Expectations Unified objectives Coordination Interdisciplinary Understanding Sharing Appreciation Multi-jurisdictional Commitment Proactive Response
Studies of this kind serve important purposes that include scoping the nature of the problem, specifying the relevant attributes of integrated programs, and identifying the type of stakeholders involved. Nonetheless, there are several difficulties with institutional issue evaluations. They usually take place after the project is complete. They typically rely on self-evaluations, are based on general (or unclear) goals, are seldom cross-cutting or comparative, and most importantly, lack valid and reliable metrics. Their main weakness is their descriptive rather than analytical nature. Thus, while the investigators are able to draw general themes and lessons that seem to cut across the various programs, it is difficult to calibrate the conclusions. That is, questions about the extent to which different factors influence success cannot be answered and consequently, priorities cannot be discerned. Without those answers, the lessons may not be transferable to other projects. What is needed is the development and implementation of standard “metrics.” For example, a project might be evaluated in much the same way that managers use the Meyers-Briggs personality inventory to assess the ir state of being (Quenk, 2000). Such a tool could be used for comparisons across multiple projects and might be included in the project development process.
2.5 Research Frame work The development of the research framework included a review of existing frameworks for integrated ITS programs, input from relevant stakeholders and an assessment of the existing state
11
of knowledge of stakeholder issues in integrated deployments. The conceptual model (see Figure 2-2) serves as an overarching framework for the remainder of research study.
Characteristics
Development & Management of Stakeholder Relationships
Outcomes
Individual Characteristics
Process Challenges
Project Success
Organizational Characteristics
Process Enablers
Project Characteristics
Stakeholder Perceptions
Project Benefits
Stakeholder Management Strategies
Figure 2-2: Conceptual model of project success
The conceptual model identifies various characteristics that are antecedents to successful stakeholder relationships. Thus, any given TIM project can be distinguished by the individual and organizational characteristics of the participants. In addition, the project itself has certain characteristics and potential benefits that are unique to the project. As show in the model, development and management of stakeholder relationships are the key factors that intervene between the characteristics of the project and the success of the project. These relationships can be described by the process challenges, process enablers, stakeholder perceptions, and stakeholder management strategies. These concepts were the basis for the development of metrics to determine their relative influence on the perceived success of the project.
12
3.0 Research Methodology This section explains the key project tasks and the methods used to produce the project deliverables. We developed a database of 2,000 potential respondents focusing on integration projects (at various stages of development). The data were collected with a dynamic on- line survey during the time period May to September 2002.
3.1 Sampling Frame The major obstacles to completing a project of this type include both understanding the institutional issues and obtaining high quality responses from those involved in various integrated programs. Access to the numerous local, regional, and state stakeholders requires a broad base of established contacts and incentives for participation in this study. Through our work on the previous UTCA project (Bunn and Savage 2000), we nurtured a number of national contacts that were helpful in completing the project. In addition, the Intelligent Transportation Society of America (ITSA) contributed to the success of the project through in-kind staff and computer support for developing the sampling frame, survey design, pilot testing and survey administration. The national recognition of ITSA and other cooperative organizations in the traffic management and emergency response communities assured the stature and credibility necessary to obtain high quality responses from the key decision makers involved in the integrated deployments. Developing a project sample of adequate size involved utilizing a number of resources. To begin, we reviewed the U.S. DOT’s 2001 ITS Projects Book, which describes ITS projects, tests, and studies initiated through September 30, 2000 that are at least partially financed from Federal ITS funds. We searched the book for projects that had some level of integration between traffic management and emergency response. Of the 728 projects listed, 28 were found to be relevant to our study. From these, we established contacts for the respective projects as well as probed for additional projects and their rela ted contacts. Using this “snowball” approach allowed us to identify and add another 15 projects to the sample. To further our sample collection, we attended the ITS America meeting in Miami, Florida in June, 2001. This conference brought individuals involved in all types of projects across the country together in one building to discuss their advancements/frustrations regarding ITS project deployment. Through conversations with various stakeholders, we were able to not only identify over ten new projects, but also speak directly with those involved to get accurate descriptions of the projects’ characteristics. This opportunity helped expand our sample considerably as some of these projects were of great size. In addition, we were able to obtain the stakeho lder mailing list for the U.S. DOT’s ITS (Technical) Evaluation Program. This included the stakeholder lists for relevant projects from
13
the Oak Ridge National Laboratory studies, which increased the sample to over 2,000 potential participants. Finally, we used the individuals listed as members of the incidentmanagement.com website, as they are all involved in integrated projects (over 100 potential respondents). Each additional source of potential respondents was crosschecked with the current sample list to eliminate any redundancy. As a result of the four resources, we were able to assemble a sample of 2243 individuals to participate in the study.
3.2 Data Collection Preparation for data collection included developing the questionnaire, determining the protocol for survey administration, pre-testing the data collection instrument and procedures, revising, and then creating the final version of questionnaire. Survey Instrument and Procedures The survey instrument was administered through the Internet. Respondents received an e- mail notification asking for participation in the survey. The e- mail message included the URL for the survey home page and a unique username and password. Respondents were instructed to go to survey home page where they received more instructions, viewed a questionnaire preview section, and then logged into the actual survey to begin responding to the questions. The survey home page is shown in Figure 3-1; the preview page is shown in Figure 3-2.
Figure 3-1: Home page for survey
14
Figure 3-2: Questionnaire preview page
Because pre-testing showed that respondents viewed the survey as somewhat complex, the preview page was meant to give the respondents an overview of what to anticipate in each section of the questionnaire. The actua l questionnaire flow is shown in Figure 3-3.
Instructions
About the Organization
About the Project
Respondent’s Own Organization
Relationship with a Low Salience Organization
Relationship with a Medium Salience Organization
List of Participating Organizations
Relationship with a High Salience Organization
Other General Questions
Figure 3-3: Dynamic online survey sequence
15
•Urgency •Power •Legitimacy •Roles of Stakeholders
After reading the introduction and logging into the survey, the respondent read additional instructions and then was asked a series of questions describing his/her own organization. Next, the respondent was asked to name a project in which the organization was or had been involved that related to the integration of traffic management and emergency response. If the organization had not been involved in such a project, the respondent was able to “opt-out” of the survey at this point. If there was such a project, the respondent went on to answer a series of questions describing the project. Following these descriptive questions was a question of particular importance that asked the respondent to indicate the other stakeholders who were directly involved in the project. The respondent selected these from a list of twenty- four potential stakeholders that was developed during the pre-testing phase of the survey. These potential stakeholders are shown in Table 3-1. Table 3-1: List of Stakeholders 1 2 3 4 5 6 7 8 9 10 11 12 13 14 15 16 17 18 19 20 21 22 23 24
Stakeholders Public Service Answering Point (PASP) Regional or Local Traffic Department Wireless Carrier Local Police Department Fire Department Commercial Systems Integrator Consultant Ambulance Service Fleet Operator Federal Communications Commission Trauma Center Insurance Company Regional Planning Commission Hospital Third-Party Call Center Professional Association US DOT Traffic Information Provider University Research Center State DOT Recovery Service Other Commercial Supplier State Police/Dept. of Public Safety Transit Authority
At this point, the survey became “dynamic.” Based on the respondent’s choice of the participating stakeholders (see Table 3-1), the website generated a set of questions asking about the involvement and influence of only those stakeholders indicated by the respondent and then general questions about the interactions and the relationships within the group of participating stakeholders. The responses to these questions were used to calculate the “salience” of each participating stakeholder based on a multiplicative factor of involvement times influence. This salience measure was later used by the website to generate sets of customized questions for a high, medium, and low salience organization (if three or more participating stakeholders were indicated). The next section asked a set of questions about the respondent’s own organization. Then, for one high, medium and low salience stakeholder, the respondent was asked a set of questions
16
regarding the respondent organization’s relationship with that stakeholder. The dynamic nature of the survey meant that these questions were customized – that is, each item included the name of the stakeholder group. For example, if the stakeholder group was the “consultant” the question read “The consultant had the resources needed to make or break this project” and so on. To end the survey, the respondent answered several more questions about his or her own organization.
3.3 Response Characteristics In this section, we provide descriptive information about the response rate, the characteristics of the respondents in the sample, and the nature of the project about which they were responding. Response Rate We were able to track the response rate as the survey progressed. Below is the tracking page (Figure 3-4) as it appeared near the end of the data collection time period. Table 3-2 reports the final statistics relevant to the response rate for the on- line survey.
Figure 3-4: Response tracking page
17
Table 3-2: Response rate Count Potential Respondents
2243
Invalid Response (Computer Error)
17
Opted Out (No Integration Project)
180
Stopped Somewhere in the Questionnaire
41
Completed Questionnaire
310
Total Responses
548
Overall Response Rate
24.4%
Based on the nature of outcomes to any questionnaire, the number of usable responses will vary somewhat depending on where the respondent stopped in the questionnaire. In our case, the data analysis includes the 310 respondents who completed the entire survey, plus the 41 other respondents who stopped before completing the entire questionnaire. On one hand, several respondents simply failed to click the “submit” button on the last page of the survey and therefore we have data for most research variables of interest. On the other hand, several respondents stopped at earlier sections for various reasons – perhaps because of an interruption (telephone, etc.) or lack of interest. Thus, the maximum number of responses on any question is 351. To check on potential response bias, we examined the response patterns of the various stakeholder groups. The results are shown in Table 3-3. Table 3-3: Nature of response by stakeholder group
Nature of Response Opted Out (No Integration Project) Count % within Nature of Response Stopped Somewhere Count % within Nature of Response Completed Questionnaire Count % within Nature of Response Total Count % within Nature of Response
Transportation
First & Second Responders
Law Enforcement
Commercial Private Sector
Other Government or Non-Profit
69 39.2%
30 17.0%
45 25.6%
11 6.3%
21 11.9%
16
9
5
4
5
41.0%
23.1%
12.8%
10.3%
12.8%
139 45.1%
49 15.9%
57 18.5%
34 11.0%
29 9.4%
224
88
107
49
55
42.8%
16.8%
20.5%
9.4%
10.5%
Based on the responses noted in the table, members of the law enforcement stakeholder group were more likely to report they were not involved in an integration project (25.6% versus 20.5% total) (i.e., opted out), but were less likely to stop somewhere in the questionnaire (12.8% versus 20.5% total). The first and second responders group was more likely to stop (23.1% versus 16.8%). Finally, the transportation group was more likely to complete the questionnaire than the other groups (45.1% versus 42.8%). Overall, however, there are no extreme response biases across the stakeholder groups.
18
Respondent Characteristics Table 3-4 shows the distribution of respondents by stakeholder groups for which we have complete (or near compete) data. Table 3-4: Distribution of stakeholder groups among respondents Frequency
Percent
Transportation First and Second Responders Law Enforcement
155 58 62
44.2% 16.5% 17.7%
Commercial Private Sector Other Government or Non-Profit Unclassified Stakeholders Total
38 34 4 351
10.8% 9.7% 1.1% 100.0%
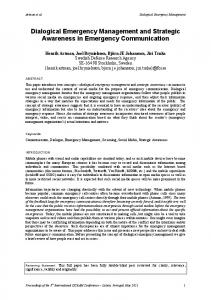
The responses are weighted heavily toward the transportation sector which was expected. Nonetheless, there are a substantial number of first and second responders, law enforcement, and commercial private sector respondents on which to base some insightful analysis. We also considered the respondents’ perceptions of their knowledge of the project. This was important to assure the respondents were informed about the project on which they were reporting. Table 3-5 and Figure 3-5 report the results to a question asking respondents to rate their individual knowledge of the project on a scale of one to seven (1 = “I know a little about the project” and 7 = “I know a great deal about the project”). Table 3-5: Respondents’ self-reported knowledge of the project Score
Frequency
Percent
1 (know very little) 2
0 14
0% 4.0%
3 4 5 6
14 36 46 82
4.0% 10.3% 13.1% 23.4%
7 (know a great deal) Missing Total
138 21 351
39.3% 6.0% 100.0%
19
160
140
120
100
80
60
Frequency
40 Std. Dev = 1.42
20
Mean = 5.8 N = 330.00
0 2.0
3.0
4.0
5.0
6.0
7.0
Figure 3-5: Response frequencies on knowledge question
The results show that the respondents generally considered themselves very knowledgeable about the project which was the focus of the survey. Organizational Characteristics In the section above (Respondent Characteristics), we described the stakeholder groups from which the respondents were drawn. Below are several other characteristics of the organizations: size of organization (number of employees in the whole organization and number of employees at the respondent location), and the respondents’ ratings of the ir organization’s innovativeness. Table 3-6: Responding organizations’ size Number of Employees in Organization 5,171 Median 300
Mean Median
50
Mode
Mode
25
Mean
3,000
Minimum Maximum Percentiles
Number of Employees at Location
1
Minimum
1,000,000
Maximum
30%
100
60% 90%
Percentiles
194
1 6,000 30%
20
572
60%
80
4,000
90%
400
The data in Table 3-6 indicate a substantial variation in the size of the organizations in the sample. The data are skewed, however, by a small number of respondents from very large organizations (e.g. US-DOT). Thus, the mean size of the organizations is 5,171, but the median is only 300. Likewise the mean number of employees at the respondent’s location is 194, while the median number is 50.
20
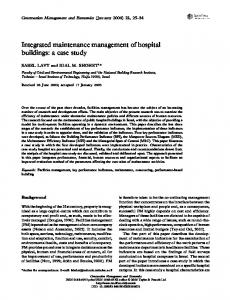
We asked the respondents to evaluate their organizations in terms of the level of innovativeness. Figure 3-6 below shows the results to a single question asking, “How innovative or creative do you consider your organization to be?” Respondents rated their organization on a scale of one to seven (1 = “This is a very innovative and creative organization” and 7 = “This organization is slow to change and not at all creative”). For ease of interpretation, we reverse scored this variable. Thus, a high number indicates greater innovativeness. 100
80
60
Frequency
40
20 Std. Dev = 1.60 Mean = 5.2 N = 298.00
0 1.0
2.0
3.0
4.0
5.0
6.0
7.0
Figure 3-6: Organization’s innovativeness
As indicated by the graph, the respondents in the sample considered their own organizations to be quite innovative. The mean rating is 5.2 and the responses are skewed toward the innovative end of the scale. Since incident management programs are not universally deployed and are just beginning to grow in number, it is not surprising to find the more innovative organizations to be the ones involved in such projects. Project Characteristics There were 193 unique projects reported by the 351 respondents. Most projects had from one to three respondents in the sample. Inspection of this list shows the wide variety of projects reported by the respondents. The projects for which there were more than three respondents are listed in Table 3-7. Table 3-7: Projects with four or more respondents Integration Projects
Frequency
Percent
Wisconsin TIME
16
4.8%
Birmingham ATMS
12
3.6%
COATS
12
3.6%
Northern Shenandoah ITS
9
2.7%
21
Table 3-7: Projects with four or more respondents (continued) Integration Projects
Frequency
Percent
ARTIMIS
8
2.4%
Emergency Responder Safety Institute
8
2.4%
Maricopa REACT
6
1.8%
Birmingham CCTV
5
1.5%
Rhode Island IM Task Force
5
1.5%
TIM Roadmap to Future
5
1.5%
Birmingham Integrated Traffic and Emergency Response System
4
1.2%
CapWIN
4
1.2%
Monroe ITS Planning
4
1.2%
North Carolina Incident Management
4
1.2%
Pennsylvania GIS/ITS Initiative
4
1.2%
Silicon Smart Valley Corridor
4
1.2%
Other Projects
221
63.0%
Missing
20 351
5.6% 100.0%
Total
Because the project was funded by the University Transportatio n Center for Alabama (UTCA), the most frequent responses came from projects in the Birmingham, Alabama region (a total of 21 respondents or 6.0% of the sample). This is still a relatively small portion of the sample and there is a wide representation of various projects from across the country. Appendix B provides the complete list of projects described by the respondents in the survey. The projects in the sample involved various elements of what might be a completely integrated traffic incident management system. We asked the respondents to indicate which of seven incident management categories were included in the focal project. The results are shown in Table 3-8. Table 3-8: Frequency of integration elements included in the project
Frequency Percent
Detection
Verification
197 56.1%
190 54.1%
Integration Elements Motorist Site Information Response Management 210 59.8%
264 75.2%
178 50.7%
Traffic Control
Clearance
261 74.4%
165 47.0%
In addition to the response frequency, we also considered the extent of integration of each project, that is, how many of the integration elements were included in any one project. On average, each project included 4.4 integration elements. The frequency distribution is shown in Table 3-9 below. These results indicate the projects varied in scope and complexity.
22
Table 3-9: Number of integration elements in reported projects Number of Integration Elements
Frequency
Percent
1.00
36
2.00
32
9.1%
3.00
47
13.4%
4.00
51
14.5%
5.00
48
13.7%
6.00
32
9.1%
7.00
84
23.9%
10.3%
Missing
21
6.0%
Total
351
100.0%
In addition, we considered the stage of the project. As shown in Table 3-10, the projects also varied with regard to the current stage of deployment. Most projects, however, were either in the implementation stage (29.6%) or the deployment was completed (23.9%). Table 3-10: Stage of reported project Frequency
Percent
Planning Stage Design Stage
40 41
11.4% 11.7%
Implementation Stage Deployment Completed Expansion Stage
104 84 61
29.6% 23.9% 17.4%
Missing Total
21 351
6.0% 100.0%
Stakeholder Involvement As described earlier in the section on data collection procedures, we asked respondents to check off from a list of twenty- four the stakeholders who were involved in the project. Three- hundred and twenty five respondents provided this information. Figure 3-7 shows the results.
23
50
40
30
20
Percent
10
0 1 to 4
5 to 9
10 to 14
15 to 19
20 to 23
Figure 3-7: Number of stakeholders involved in each project
The average number of stakeholders involved in each project was 7.8. Most projects (27%) had between five and nine stakeholders involved. While a large percent (44.2%) of the respondents are from transportation (see Table 3-4 on page 19), the other stakeholders involved in the projects ranged from First and Second Responders to Non-Profit Organizations. Table 3-11 shows the frequency and percents of stakeholder groups named by the respondents as being involved in the projects. Table 3-11: Other Stakeholder groups involved in the reported projects Frequency
Percent
Transportation First and Second Responders Law Enforcement
768 563 462
29.1% 21.3% 17.5%
Commercial Private Sector Other Government or Non-Profit Total
590 257 2640
22.3% 9.7% 100.0%
The respondents evaluated these other stakeholders in terms of their involvement and influence in the project. Then later in the survey, the respondents answered a series of in-depth questionnaire items for (up to) three of the stakeholders involved in the project (high, medium, and low salience). These findings are reported in the Measurement Development section and the Results section of this report.
3.4 Measurement Development To develop reliable and valid measures, we created multi- item measurement scales for key research variables and obtained preliminary fa ce-validity checks through in-depth interviews with Alabama and national stakeholders. The analysis procedure for developing the multi- item scales included individual item analysis, an iterative factor analysis procedure, an evaluation of the internal cons istency of each scale, and a check on the overall scale properties.
24
In determining the number of factors underlying the various constructs related to integrated incident management programs, we used a trade-off among several criteria including eigenvalues, variance explained, and most importantly – interpretability. For example, because this was an exploratory study and the measures have no previous basis in the literature, we sometimes used factor solutions with eigenvalues of less than 1.0. The underlying themes however, had strong face validity. Similarly, we sometimes used single- item measures when multi- item measures were unavailable or did not hold up to basic standards for psychometric properties. We used coefficient alpha as the measure of internal consistency for multiple item measures and the bivariate correlation for scales with only two items. We also considered the skewness and kurtosis of both the individual items and the scales. Skewness concerns the symmetry – that is the distribution looks the same to the left and right of the center point. The skewness estimate for a normal distribution is equal to zero. Kurtosis is a measure of whether the data are peaked or flat relative to the normal distribution. High kurtosis means the data has a distinct peak near the mean, but then declines rapidly; low kurtosis means the data has a flat top near the mean rather that a normal or sharp peak. The kurtosis estimate for a normal distribution is equal to zero. Underlying Project Benefits During the literature review and in-depth interviews, we developed a list of the ten most common benefits achieved through incident management programs. These were the benefits that seemed to cut across a wide range of projects. We asked the respondents to describe the focal project in terms of the relevancy of these benefits on a scale of one to seven (1 = “Not Relevant” and 7 = “Extremely Relevant”). The results are shown in Table 3-12 in rank order from the most to the least relevant benefits. Table 3-12: Relevancy of project benefits Benefit Reduces deaths and serious injuries on the roadways
Mean 5.5
Standard Deviation 1.9
Enhances my organization’s image in the community
5.2
1.8
Reduces congestion
5.2
2.1
Gives my organization access to new data
5.0
2.0
Improves my organization’s operations
4.8
2.2
Provides more efficient use of my organization’s current resources
4.8
2.2
Reduces the time it takes my organization to perform its actions
4.5
2.3
Increases my organization’s ability to predict operational needs
4.3
2.1
Allows my organization better analysis of our performance
4.1
2.2
Decreases costs to my organization
3.3
2.2
25
The relevancy of these benefits provides a glimpse into the nature of incident management programs ; however, some of these benefits may be interrelated. We therefore performed a factors analysis to reveal the underlying benefit themes. We used the principal components method with a varimax rotation (assumes the factors are uncorrelated). The purpose is to reduce the list of benefits to an underlying set of factors that are able to explain the variation in the larger number of benefits more efficiently. The three factors shown in the table include all the benefits except “Enhances my organization’s image in the community.” This benefit was excluded because it did not clearly load on any one factor. The three factors shown in Table 3-13 account for 75.7% of the variance in the remaining nine benefit items. The eigenvalue for the third factor was 0.925. All factor loadings greater than 0.40 are shown in the results below. Since there was some “cross-loading” between factors one and two, we also performed the same analysis using an oblique rotation (assumes the factors are correlated). This confirmed the appropriateness and interpretability of the three factors. We then interpreted the three factors by giving them descriptive names – also shown in the table of results below. Table 3-13: Factor analysis results for project benefits Benefits
Organizational Efficiency
Data Analysis Capability
Reduces the time it takes my organization to perform its actions
.88
Improves my organization’s operations
.83
.31
Provides more efficient use of my organization’s current resources
.80
.36
Decreases costs to my organization
.76
Gives my organization access to new data
Public Benefit
.85
Increases my organization’s ability to predict operational needs
.40
.74
Allows my organization better analysis of our performance
.44
.73
Reduces deaths and serious injuries on the roadways
.85
Reduces Congestion
.84
The first factor is named “organizational efficiency” because it deals exclusively with benefits internal to the organization that improve processes and reduce costs. The second factor is named “data analysis capability” because it deals wit h data access, prediction, and analysis. The cross loadings are moderate (0.40 and 0.44) and make sense, since we would expect data analysis capability to be related to organizational efficiency. Finally, the third factor is named “public benefit” since it deals with the two benefits external to the organization. We next assessed the reliability of the three multi- item scales. The reliability measure for the first two scales is coefficient alpha, whereas the Pearson product- moment correlation is used for the last scale (since it is comprised of only two items). These results are shown below.
26
Table 3-14: Scale properties for benefit factors Scale (and items) Organizational Efficiency Reduces the time it takes my organization to perform its actions Improves my organization’s operations
Reliability
Scale Mean
Standard Deviation
Skewness
Kurtosis
a = .89
4.3
1.9
-.44
-1.04
a = .82
4.4
1.8
-.39
-.87
r = .52
5.3
1.7
-1.1
.33
Provides more efficient use of my organization’s current resources Decreases costs to my organization Data Analysis Capability Gives my organization access to new data Increases my organization’s ability to predict operational needs Allows my organization better analysis of our performance Public Benefit Reduces deaths and serious injuries on the roadways Reduces Congestion
The third factor is somewhat skewed – this is understandable because, by their nature, most incident management projects involve some public benefit. Overall, however, the three benefit scales show good scale reliability properties and therefore are used in the subsequent analyses. Project Challenges and Enablers Based on an extensive review of the literature and published reports, we also created a list of the most common challenges and enablers facing incident management project participants. These described the circumstances that seemed to cut across a wide range of projects. We asked the respondents to describe the focal project in terms of the rele vancy of each of these challenges and enablers on a scale of one to seven (1 = “Not Relevant” and 7 = “Extremely Relevant”). The results immediately below show a rank ordering from the most to the least relevant challenges.
27
Table 3-15: Relevancy of stakeholder process challenges Mean
Standard Deviation
Interoperability
4.0
2.1
Difficult Finding Funds
3.7
2.3
Difficult to Evaluate
3.4
1.9
Lack of Cooperation - Stakeholders
3.2
2.0
Lack of Support from Higher-Ups
2.9
2.1
Lack of Skills and Training
2.8
1.8
Afraid of Change
2.7
1.9
Uncertain about Outcomes
2.7
1.7
Too Much Red Tape
2.6
1.8
Lack of Cooperation - Own Organization
2.6
1.8
People Think Won't Work
2.5
1.7
Leadership is Unclear
2.2
1.7
Lack of Data Security
2.0
1.5
Challenges
Similar to the analysis performed on the list of benefits, we used factor analysis to reveal the underlying themes related to the challenges. Four items were subsequently excluded because they did not load clearly on any one factor: “Difficult to evaluate,” “Lack of cooperation – stakeholders,” “Afraid of change” and “Leadership is unclear.” The five factors shown in Table 3-16 account for 80.2% of the variance in the remaining nine challenges items. The eigen value for the fifth factor was only 0.652, however, the five- factor solution had strong face validity. All factor loadings greater than 0.40 are displayed. Table 3-16: Factor analysis results for challenges Challenges
Organizational Inertia
Lack of Support from Higher-Ups
.83
Lack of Cooperation - Own Organization
.77
Too Much Red Tape
.73
Uncertainty
People Think Won't Work
.85
Uncertain about Outcomes
.77
Lack of Skills & Procedures
Lack of Data Security
.84
Lack of Skills and Training
.63
Interoperability
Interoperability
Funding
.94
Difficult Finding Funds
.92
The first factor is named “Organizational inertia” because the three challenges indicate characteristics of the organization that would cause a lack of action, slowing the project down and stifling energy toward the project. The second factor, “Uncertainty,” is self evident. The third factor is named “Lack of skills & procedures” because it deals both with the capabilities of the organizational members and the lack of procedures for data security. The last two factors are single items and are therefore called by the ir descriptive labels, “Interoperability” and “Funding.” The scale properties for each of these five factors are shown below. 28
Table 3-17: Scale properties for challenges Reliability
Scale Mean
Standard Deviation
Skewness
Kurtosis
a = .80
2.7
1.6
0.76
-0.32
r = .55
2.8
1.6
0.50
-0.76
r = .44
2.4
1.4
0.84
0.03
Interoperability
single item
4.0
2.1
-0.12
-1.37
Funding
single item
3.7
2.3
0.14
-1.48
Scale (and items) Organizational Inertia Lack of Support from Higher-Ups Lack of Cooperation - Own Organization Too Much Red Tape Uncertainty People Think Won't Work Uncertain about Outcomes Lack of Skills & Procedures Lack of Data Security Lack of Skills and Training
The first three factors are somewhat skewed toward lower values. Thus, the respondents were likely to report lower organizational inertia, uncertainty, and lack of skills and procedures. This may be an artifact of the nature of these innovative projects. That is, the respondents come from organizations that are less likely to experience these challenges, or they have already worked to overcome the challenges. The last two factors show kurtosis – in fact they appear to be “bimodal”, meaning respondents either had interoperability and/or funding problems or they did not. We performed similar analyses on the set of project enablers. Table 3-18 lists the eleven process enablers included in the survey. The results are shown as a rank ordering from the most to the least relevant enablers. Table 3-18: Relevancy of stakeholder process enablers Mean
Standard Deviation
Supportive Climate
5.5
1.6
Clear Accountability
5.4
1.7
High Level of Trust
4.8
1.8
No Difficulty Communicating
4.8
1.7
Able to Deal With Conflict
4.8
1.7
Geographically Close
4.8
2.0
Familiar Jargon
4.7
1.7
Had Necessary Resources
4.5
1.7
Similar Goals
4.4
1.8
Similar Cultures
4.0
1.7
Power Shared Equally
3.7
1.7
Enablers
29
The results of the factor analysis of the enabler items is shown in Table 3-19. Of the original eleven items, two were excluded because they did not load clearly on any one factor: “No difficulty communicating” and “Similar goals.” The five factors shown below account for 79.9% of the variance in the remaining nine enabler items. The eigen value for the fifth factor was only 0.655, however, we accepted this solution because of the strong interpretability. All factor loadings greater than 0.40 are displayed. Table 3-19: Factor analysis results for enablers
Enablers
Efficacy
Clear Accountability
.84
Had Necessary Resources
.78
Able to Deal With Conflict
.75
Climate of Trust
Supportive Climate
.92
High Level of Trust
.65
Underlying Factors Shared Understanding
Familiar Jargon Similar Cultures
Sense of Equality
Proximity
.84 .41
.68
Power Shared Equally
.95
Geographically Close
.95
The first factor is named “Efficacy” because the three items describe the basic foundations required for the ability to perform effectively – accountability, resources, and ability to deal with conflict. Thus, efficacy concerns the power to produce intended effects (as in efficacy of medicine in counteracting disease). The second factor, “Climate of trust,” deals with the context in which the group is working. The third factor is named “Shared understanding” because it concerns similarities of language and organizational cultures. There is a cross-loading of the item “Similar cultures” with the first factor. This might be because – while they are independent factors – there may be a close relationship between a climate of trust and efficacy. The last two factors are single items and are called by descriptive labels, “Sense of equality” and Proximity.” The scale properties for each of these five factors are shown below. Table 3-20: Scale properties for enablers Scale (and items) Efficacy
Standard Deviation 1.4
Skewness
Kurtosis
a = .80
Scale Mean 4.9
-.62
-.21
r = .50
5.1
1.5
-.69
-.31
r = .34
4.4
1.4
-.08
-.36
Reliability
Clear Accountability Had Necessary Resources Able to Deal With Conflict Climate of Trust Supportive Climate High Level of Trust Shared Understanding Familiar Jargon Similar Cultures
30
Table 3-20: Scale properties for enablers (continued)
Sense of Equality
Reliability single item
Scale Mean 3.7
Standard Deviation 1.7
Skewness .37
Kurtosis -.71
Proximity
single item
4.8
2.0
-.53
-.98
Scale (and items)
Factors one and two are somewhat skewed towards higher values. This indicates that the respondents were reporting on projects that are already high on these enablers (Efficacy and Climate of trust). The last factor “Proximity” shows kurtosis – the proximity of the stakeholders for these projects is more evenly distributed across the projects than one would expect from a standard- normal distribution that would be peaked in the center near the mean. Perceived Success The perceived success of the focal project was an important dependent variable in the study. We used four items to measure success. The means and standard deviations of the four items are shown below. Table 3-21: Four-item success scale Mean
Standard Deviation
In your opinion, what is the success of this project to date: (1=Failure and 7=Extremely Successful)
5.3
1.5
I believe we have achieved the planned goals of the project to date (1=Strongly Disagree and 7=Strongly Agree)
5.4
1.5
My organization is generally satisfied with the project outcomes to date (1=Strongly Disagree and 7=Strongly Agree)
5.3
1.6
The project was accomplished [behind – ahead] of schedule or expectations (1=Behind Schedule and 7= Ahead of Schedule)
3.9
1.7
Item
The four success scale items were submitted to a principal components method of factor analysis. The results indicated the first component had an initial eigen value of 2.72. We therefore concluded that one factor was appropriate. The scale statistics are shown below. Table 3-22: Scale properties for perceived success Scale Perceived Success
Reliability
Scale Mean
Standard Deviation
Skewness
Kurtosis
a = .82
5.0
1.3
-.70
-.20
The success measure is slightly skewed toward higher scores – that is, the projects in the sample are more likely to be perceived as successful. Stakeholder Relations and Perceptions We developed a number of measures to assess the relationships among the stakeholders and their perceptions of one another. These included salience, urgency, power and legitimacy. Following the accepted use of the term in social science, we defined “salience” as the degree to which managers considered the stakeholder to be prominent or central to the project. As reported 31
in the section on Response Characteristics, the respondents indicated that an average of 7.8 stakeholders were involved in each project. For each of these (a total of 2640 stakeholders), we asked the respondents to react to five questionnaire items. The means and standard deviations of the five items are shown below (see Table 3-23). Table 3-23: Five-item salience scale Item
Mean
Standard Deviation
How much involvement did this stakeholder have to date on the project? (1 = Low Level of Involvement and 7 = High Level of Involvement)
5.0
1.8
How much influence did this stakeholder have to date on the project? (1 = Low Level of Influence and 7 = High Level of Influence)
4.8
1.9
The “named stakeholder” received a great deal of time and attention from my organization (1=Strongly Disagree and 7=Strongly Agree)
4.5
2.0
Satisfying the demands of the “named stakeholder” was important to my organization (1=Strongly Disagree and 7=Strongly Agree)
4.9
1.8
The “named stakeholder” didn’t mean much to my organization when it came to this project (1=Strongly Disagree and 7=Strongly Agree) (reverse scored)
5.6
1.6
The five salience scale items were submitted to a principal components method of factor analysis. The results indicated the first component had an initial eigen value of 2.86. We therefore concluded that one factor was appropriate. The scale statistics are shown below. Table 3-24: Scale properties for salience scale Scale Salience
Reliability
Scale Mean
Standard Deviation
Skewness
Kurtosis
a = .81
5.0
1.6
-.52
-.54
The salience measure is slightly skewed toward higher scores – that is, the stakeholders working on the project are more likely to be perceived as relevant to the project. Again, this result makes sense because the respondents are reporting on ongoing projects, many of which were in the implementation stage or already completed. We measured the organization’s perception of its own urgency, power, and legitimacy as well as the perceptions of the urgency, power and legitimacy of the other stakeholders involved in the project. Urgency concerns the extent to which a stakeholder pays attention to the project and makes it a priority. The power of a stakeholder is its potential influence on the project and over the other stakeholders. Legitimacy is the perception that stakeholder was an appropriate and desirable participant in the project. The items used to measure these three constructs are listed in Table 3-25. The anchor points for all the items were 1 = strongly disagree and 7 = strongly agree. The results are reported separately for “own” and “other” perceptions. The sets of questions were customized in the survey – thus, one set said “my organization” and the other sets identified the particular stakeholder group named by the respondent earlier in the survey.
32
Table 3-25: Original items for urgency, power and legitimacy Item Urgency The “named stakeholder” pushed to complete the project as soon as possible Completing this project quickly was high on the agenda for the “named stakeholder
Mean
Own Organization St. Dev Skew.
Kurt.
Mean
Other Stakeholders St. Dev. Skew.
Kurt.
5.0
1.7
-0.66
-0.42
4.0
2.0
-0.01
-1.19
4.8
1.8
-0.54
-0.78
4.2
2.0
-0.16
-1.09
5.2
1.8
-0.67
-0.77
4.9
1.8
-0.51
-0.78
The “named stakeholder” had the ability to make this project a reality
5.1
1.8
-0.87
-0.28
4.1
2.1
-0.06
-1.38
The “named stakeholder” had little power over the other stakeholders (reverse scored)
4.5
1.9
-0.35
-1.06
4.1
1.9
0.00
-1.16
The “named stakeholder” had the resources needed to “make or break” this project
4.9
2.1
-0.62
-0.99
3.8
2.2
0.12
-1.39
The involvement of the “named stakeholder” in the project was not desirable (reverse scored)
6.3
1.3
-2.40
5.54
6.1
1.4
-1.73
2.50
It was appropriate for the “named stakeholder” to participate in the project
6.4
1.2
-3.00
9.43
5.9
1.5
-1.53
1.89
Having the “named stakeholder” involved in the project was the right thing to do
6.5
1.2
-3.39
12.42
6.1
1.4
-1.69
2.61
The “named stakeholder” didn’t have a sense of urgency about this project (reverse scored) Power
Legitimacy
The legitimacy items are badly skewed – more so for own organization than for other organization. In retrospect, this makes sense since typically respondents would not question the legitimacy of their own organization being involved in the project. We used factor analysis to confirm the underlying scales related to the three constructs. The factor analysis results for both own and for others indicated that two items should be excluded: one power item (“little power” [reverse scored]) and one legitimacy item (“was not desirable” [reverse scored]). The final three factors account for 77.1% (own) and 82.1% (other) of the variance in the remaining seven items. All factor loadings greater than 0.40 are displayed in Table 3-26. The scale statistics are shown in Table 3-27.
33
Table 3-26: Factor analysis results for urgency, power and legitimacy items Own Organization Items The “named stakeholder” pushed to complete the project as soon as possible Completing this project quickly was high on the agenda for the “named stakeholder
Urgency
The “named stakeholder” didn’t have a sense of urgency about this project (reverse scored)
Legitimacy
Other Stakeholders Power
Urgency
Power
.74
.73
.42
.81
.81
.80
.85
The “named stakeholder” had the ability to make this project a reality
.86
.89
The “named stakeholder” had the resources needed to “make or break” this project
.88
.91
Legitimacy
It was appropriate for the “named stakeholder” to participate in the project
.91
.90
Having the “named stakeholder” involved in the project was the right thing to do
.92
.93
Table 3-27: Scale properties for urgency, power and legitimacy Own Organization Scale
Other Stakeholders
Reliability
Mean
St. Dev
Skew.
Kurt..
Reliability
Mean
St. Dev
Skew.
Kurt..
Urgency
a = .74
5.0
1.5
-0.43
-0.58
a = .80
4.4
1.6
-0.12
-0.79
Power
r = .65
5.0
1.8
-0.76
-0.47
r = .76
3.9
2.0
0.05
-1.27
Legitimacy
r = .73
6.5
1.1
-3.18
11.53
r = .76
6.0
1.3
-1.48
1.89
The scales tend to have better reliability when the respondents were thinking about other stakeholders rather than their own organization. The legitimacy scale is badly skewed (as the items were) – worse for own organization (-3.18) than for others (-1.48). Since these were ongoing projects, the involvement of the stakeholders was already legitimized by their participation. Stakeholder Management Strategies The stakeholder management strategies concern the approaches or behaviors that one stakeholder uses with regard to another stakeholder. Based on the literature review, we developed a list of eight stakeholder management strategies that were relevant to complex projects of a nature similar to integrated incident management. Table 3-28 shows these in rank order from highest to lowest in terms of extent of agreement with the statement (1= strongly disagree and 7 = strongly agree). Once again, these questions were customized in the survey by naming the actual stakeholder group identified by the respondent.
34
Table 3-28: Stakeholder management strategies Strategy Cooperated With Stakeholder Communicated What Was at Stake Followed Stakeholder Adapted to Stakeholder Acted as the Leader with Stakeholder Defended Against Stakeholder Pressured Stakeholder
Cut Out Stakeholder
Statement About Strategy With the “named stakeholder”, my organization was cooperative; together we tried to be successful My organization made sure the “named stakeholder” understood what was at stake with this project The “named stakeholder” vision and ideas for the project were f ollowed by my organization My organization adapted to the “named stakeholder” needs throughout the project With the “named stakeholder”, my organization took charge; it was viewed by the stakeholders as the leader With the “named stakeholder”, my organization defended and guarded its interests on the project To get its way on the project, my organization used high pressure tactics with the “named stakeholder” My organization cut off and kept the “named stakeholder” out of the loop on the project
Scale Mean
Standard Deviation
Skewness
Kurtosis
5.7
1.5
-1.20
1.05
5.1
1.6
-0.76
-0.10
4.7
1.6
-0.37
-0.44
4.5
1.8
-0.35
-0.67
4.4
2.1
-0.30
-1.16
4.0
1.9
-0.12
-1.05
1.7
1.3
2.05
4.05
1.7
1.3
2.33
5.61
The respondents tended to report more reliance on the “positive” approaches (cooperation, communication adaptation) and less on the “negative” approaches (pressuring or cutting out another stakeholder). Nonetheless, there is some variance in these responses that is considered in the subsequent analysis. Summary of Research Measures Table 3-29 provides a summary of the research measures used to develop various models that are reported in the Results Section of this report. Table 3-29: Research measures Measures Individual Characteristics Project Knowledge
Definition Self assessment of knowledge of the focal project described in the survey
Organizational Characteristics: Stakeholder Group
Type of organization based on five categories of stakeholders (collapsed from the original 24 types of stakeholders)
Organizational Size
Number of employees in whole organization Number at location
Innovativeness
Reverse score of “lack of innovativeness”
Project Characteristics: Extent of Integration
Number of integration elements that were part of the project (indicator of the complexity of the project)
Project Stage
Stage of completion (five stages from planning to expansion)
35
Table 3-29: Research measures (continued) Measures Project Characteristics: (continued)
Definition
Organizational Involvement
Extent of own organization’s involvement in the project (from low to high)
Project Benefits
Relevance of three underlying benefits to the focal project
Process Characteristics: Process Challengers
Relevance of five underlying challenges to the focal project
Process Enablers
Relevance of five underlying benefits to the focal project
Stakeholder Relations and Perceptions Interaction
Extent of interaction by the respondent organization with other stakeholders involved in the project
Salience
Degree to which a stakeholder is prominent or central to the project
Urgency
Perceived importance and time sensitivity of the project
Power
Potential influence on the project; ability to bring about project outcomes
Legitimacy
Involvement of the stakeholder is desirable and appropriate
Stakeholder Management Strategies
Structured ways in which the organization interacts with other stakeholders
Outcomes Success
Extent to which goals of the project are being met
36
4.0 Results The previous section (3.0 Research Methodology) reported the development of metrics for the various concepts thought to be related to the success of traffic incident management projects. The main results of the survey, however, concern the following important questions: 1. From the numerous concepts identified and measured in the study, which of these are related to project success? 2. Of those concepts that are significantly related to project success, what is the relative importance of each? 3. How do the different stakeholder groups perceive one another? In this section (4.0 Results) we describe the analysis procedures and findings related to these three questions. In the following section (5.0 Project Conclusions and Recommendations) we interpret the findings in light of the problems related to successful projects. 4.1 Predictors of Success The first focus of our analysis was the identification of the key predictors of success. As reported in Section 3.4 (Measure Development), we created a number of metrics for gauging the relevance of different factors in the projects. In this section, we report the results of a modelbuilding process to identify the impact of these factors on the perceived project success. We conducted a series of stepwise regressions – each time using success as the dependent variable, but using a different set of independent variables each time. The results are shown in Table 4-1. We then took the significant variables from each stepwise regression model and pooled them in an overall model of success. The use of stepwise regression helps provide an understanding about the factors or variables that are the best predictors of project success. The full model indicates seven predictors have an influence on the perceived success of the project: stage of project, organization's involvement, benefit factor 3 - public benefit, challenge factor 2 – uncertainty, enabler factor 1 – efficacy, enabler factor 4 - sense of equality, and own power. We then used these seven predictors to estimate their relative influence in a final regression model. The results are shown in Table 4-2 and Table 4-3.
37
Table 4-1: Results of stepwise regression models (Success as the dependant variable) 1
Models Individual and Organizational Characteristics
Variables Entered Respondent's Knowledge Organizational Innovativeness
Variables Excluded Number of Employees at Location
2
Project Characteristics
Stage of Project Organization's Involvement Extent of Integration
Number of Stakeholders Involved
3
Benefit Factors
Benefit Factor 3 - Public Benefit
Benefit Factor 1 - Organizational Efficiency Benefit Factor 2 - Data Analysis Capability
4
Challenge Factors
Challenge Factor 2 - Uncertainty
Challenge Factor 1 Challenge Factor 3 Procedures Challenge Factor 4 Challenge Factor 5 -
Organizational Inertia Lack Skills and Interoperability Difficult Finding Funds
5
Enabler Factors
Enabler Factor 1 - Efficacy Enabler Factor 4 - Sense of Equality
Enabler Factor 2 - Climate of Trust Enabler Factor 3 - Shared Understanding Enabler Factor 5 - Proximity
6
Stakeholder Perceptions and Relations
Own Urgency Interaction with Stakeholders Own Power
Own Legitimacy
7
Full Model (all entered variables from above models)
Stage of Project Organization's Involvement Benefit Factor 3 - Public Benefit Challenge Factor 2 – Uncertainty Enabler Factor 1 - Efficacy Enabler Factor 4 - Sense of Equality Own Power
Own Urgency Interaction with Stakeholders Extent of Integration Organizational Innovativeness Respondent's Knowledge
Table 4-2: Model summary
R .686
Adjusted R Square .458
R Square .470
Std. Error of the Estimate .94526
The overall model of success accounts for about 46% of the variance in the predictors. This is a reasonably high r-square for social science survey research. Table 4-3: Coefficients Unstandardized Coefficients Constant Stage of Project
ß 1.171 .309
Std. Error .348 .046
Enabler Factor 1 – Efficacy Challenge Factor 2 - Uncertainty Organization's Involvement
.264 -.161 .133
.040 .036 .036
.097 .091 .067
.035 .032 .033
Own Power Benefit Factor 3 - Public Benefit Enabler Factor 4 - Sense of Equality
38
Standardized Coefficients ß .299
t 3.369 6.666
Sig. .001 .000
.295 -.202 .184
6.581 -4.485 3.700
.000 .000 .000
.135 .123 .088
2.739 2.809 2.019
.007 .005 .044
We considered only those variables with t statistic s of significance greater than 0.05. For ease of interpretability, the significant variables in the regression model above are sorted in Table 4-3 from the highest to the lowest standardized beta coefficients. This provides insights about the relative influence of each variable on the success of the project. The stage of the project had the most impact on the perceived success of the project (ß = .299). Understandably, because some of the projects were already completed, they may have been perceived as more successful just by that fact. Alternatively, projects that failed (and ended before they got very far) are not part of this sample. Thus, the finding also means that projects are perceived as less successful in the earlier stages indicating this is where the greatest potential lies for conflict and dysfunctional interactions. The extent to which the enabler efficacy is present had a large impact (ß = .295) comparable to that of the stage of the project. This factor encompasses three enabler variables: accountability, resources, and conflict management. Efficacy is a critical process enabler leading to success and is clearly important for both organizational and project effectiveness. From the five challenge factors, uncertainty (challenge factor 2) is the only one that is significantly related to success of the project. This factor encompasses two variables – “people think it won't work” and are “uncertain about outcomes.” This predictor has a negative beta weight (ß = -.202), indicating that as uncertainty is reduced, project success increases. The extent of the organization’s involvement in the project is also related to project success (ß = .184). The logic for this finding is somewhat similar to that regarding stage of project. Thus, more involvement, independent of other factors, results in greater perceived success of the project. Moving down the list, the next variable with a significant impact on project success is the perceived power of one’s own organization (ß=.299). This and the organization’s involvement may imply somewhat of a “halo” effect – that is, to the extent that the organization has committed time and resources to the project, and believes it has control over the other stakeholders, there is a belief that the organization has done the right thing, i.e., the project is a success. Only one benefit factor – public benefit – is significantly related to project success (ß=.123). This factor includes two variables, the degree to which the project reduces (1) deaths and serious injuries on roadways and (2) congestion. To the extent that the project provides visible benefits to the public, the stakeholders believe they have performed well. Finally, a second process enabler factor – sense of equality – is significantly related to project success (ß=.088), although the relative impact compared to the other variables is small. This seems to temper the strong findings with regard to organization’s involvement and own power. Thus, while the participants seem to believe their own organization is respons ible for project success, they also value the extent to which the power was shared with other stakeholders. The final model of success factors is show below in Figure 4-1.
39
Characteristics
Development & Management of Stakeholder Relationships
Challenge Factor 2: Uncertainty Project Stage
Outcomes
-.202 (p