INTEGRATED TURBULENCE FORECASTING ALGORITHM 2001 METEOROLOGICAL EVALUATION Jeffrey A. Weinrich* Titan Systems Corporation, Atlantic City, NJ Danny Sims Federal Aviation Administration, Atlantic City, NJ Victor Passetti Federal Aviation Administration, Atlantic City, NJ
1.0 INTRODUCTION The Federal Aviation Administration (FAA) Aviation Weather Research Program (AWRP) has provided funding to the National Center for Atmospheric Research (NCAR) to develop a forecasting tool that mitigates the dangers to commercial and general aviation aircraft from unexpected, hazardous, clear-air turbulence (CAT). This effort is within the domain of the Turbulence Product Development Team (PDT). The PDT includes meteorological experts from private, government and academic organizations and receives its overall funding and direction from the AWRP. In response to the direction provided, NCAR has developed the Integrated Turbulence Forecasting Algorithm (ITFA), which produces CAT forecasts for the contiguous United States. In support of ITFA's development in 2000 the FAA William J. Hughes Technical Center (WJHTC) Communication/Navigation/ Surveillance Engineering and Test Division, Weather Branch (ACT-320) performed an event-driven meteorological evaluation of the ITFA. Ten severe turbulence events were used in the 2000 ITFA study, which focused on the predictions, meteorological conditions, and operational impact of the predictions (Passetti, et al., 2000). In 2001, a newer version of ITFA was rerun on the ten events from the 2000 study. ACT-320 analyzed output from this latest version to determine how the performance, characteristics, and trends compared to the 2000 ITFA. 2.0 ALGORITHM OVERVIEW 2.1 Algorithm Processing ITFA generates predictions of CAT produced by upper level influences (e.g., jet stream and upper fronts) above 15,000 ft. ITFA does not produce forecasts for CAT resulting from nearby convection, mountain waves or turbulence of any type below 15,000 ft. To create CAT forecasts, ITFA relies
* Corresponding Author Address: Jeffrey A. Weinrich, FAA/ACT 320/Titan, William J. Hughes Technical Center, Atlantic City International Airport, NJ 08405; e-mail:
[email protected]
on several indices and algorithms, each having strengths and weaknesses as CAT predictors. These indices and algorithms are listed in Table 1. ITFA uses the forecasted fields of the Rapid Update Cycle (RUC) gridded forecast model to compute each index and algorithm then integrates the outputs of each predictor to produce a forecast of CAT potential and intensity (Sharman et al., 2000) Table 1. ITFA (2001) resident indices and algorithms.
Richardson Number Ellrod TI1 Index Ellrod TI2 Index Brown's 2 Index Potential Vorticity Gradient Colson-Panofsky Index Endlich Empirical Wind Index DTF3 DTF5 AGI ABSIA Vorticity squared Horizontal Shear Divergence VWS NGM1 Predictor
2.2 Algorithm Differences from ITFA 2000 to ITFA 2001 Several changes were instituted in the algorithm processing for ITFA 2001. The number and types of indices used in processing the algorithm were changed. Table 2 shows the indices used in ITFA 2000. In comparison to ITFA 2001 (Table 1), it can be seen that the number of indices has increased, however some of the ITFA 2000 indices were removed and replaced with other indices. In addition, the range of altitudes was also changed. ITFA 2001 has a forecast range of 15,000 feet to 45, 000 feet, while ITFA 2000 had a range of 22,000 feet to 41,000 feet. The forecast range also increased from 4,000foot layers to 5,000-foot layers.
Table 2. ITFA (2000) resident indices and algorithms. Richardson Number Ellrod Indices Brown's Index Potential Vorticity Gradient CCAT Index Colson-Panofsky Index Dutton's Empirical Index Endlich Empirical Wind Index Reap MOSS Predictors SCATR Index DTFs AWC Algorithms
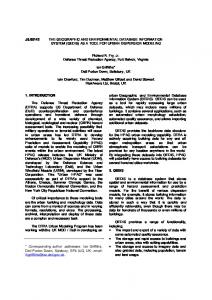
2.3 Algorithm Output The ITFA is run every three hours in conjunction with the RUC model run. Output includes 0, 3, 6, 9 and 12hour CAT forecasts for each 5,000-ft layer between 15,000 and 45,000 ft. A composite product that displays the greatest value predicted in any layer is also created. Figure 1 contains a sample of the ITFA composite forecast product. Figure 1. ITFA 0-hr composite forecast.
Table 3. Range of ITFA forecasts vs. operational interpretations. ITFA Prediction 0.0 to 0.25 0.25 to 0.5 0.5 to 0.75 0.75 to 1.0
Turbulence Interpretation No Turbulence Likely At Least Light Turbulence Likely At Least Moderate Turbulence Likely At Least Moderate or Greater Turbulence Likely
The ITFA forecasts are presented graphically on a contoured national map that coincides with the RUC model domain. Initial 0-hr forecast products include plots of Pilot Reports (PIREPs) received during the 90 minutes previous to the corresponding RUC model run. The color scheme applied for turbulence predictions ranges from no coloring for negligible turbulence, to cool colors (blues) for light turbulence, then warm colors (greens and yellows) for at least moderate turbulence, and finally to hot colors (reds and maroons) for at least moderate or greater turbulence. 3.0 Methodology 3.1 Data Collection The ten turbulence events occurred from 1 January through 30 April 2000. Data was collected and stored on a Sun workstation located in the WJHTC Aviation Weather Development Lab. The data include Significant Meteorological Information advisories (SIGMETs), PIREPs, upper air plots, numerical weather prediction output, and ITFA output. The data was received at the lab via automated ftp scripts that accessed the information from NCAR, National Weather Service (NWS), and Florida State University public ftp sites. Several Unix shell scripts were created to automate the extraction of relevant information from the large database of PIREPs and SIGMETs assembled during the evaluation period. This data was used in the ITFA 2001 Meteorological Evaluation. For the 2001 evaluation, visible and IR satellite imagery that corresponds to the identified events were acquired from NCAR via their ftp site. In addition NCAR re-ran the ITFA 2001 for the ten events used in the 2000 evaluation (Table 4).
The ITFA output contains turbulence predictions ranging from 0.0 to 1.0; higher values imply the likelihood of turbulence of a higher intensity. Table 3 provides an approximate correlation of the ITFA predictions to operational turbulence interpretations. A final determination of the relationship between ITFA predictions and operational interpretations will come after future intensive evaluations.
3.2 Data Analysis The 2001 ITFA Meteorological Evaluation first reevaluated the meteorological environments associated with each of the ten turbulence events. This reevaluation involved analyzing visible and IR satellite imagery (that was not available for the 2000 ITFA Meteorological Evaluation) for the presence of mountain waves and convection in and near the event areas, and determining any implications of this
analysis on prior conclusions and recommendations from the 2000 ITFA Meteorological Evaluation. If the presence of mountain waves and or convection were identified, then the event would be removed from the study since ITFA is not currently configured to forecast turbulence resulting from these two phenomena. The satellite imagery did not identify any mountain wave or convective activity in the vicinity of the turbulence events, thus further confirming the applicability of ITFA to the events.
SIGMET/PIREP analysis (see Passetti, et al, 2000, for a description of the event identification procedures). While subjective in nature, this methodology attempted to evaluate the ITFA more in terms of its ability to "point out" to a user a region of concern rather than statistically match ITFA forecast values (0.0 to 1.0) with reported conditions. Table 5. Differences in Lead-time (hours) Events
After the meteorological environments associated with each event were clarified, the output of ITFA 2001 from 12 hours prior to each event through the end of each event were analyzed and compared to the output from the 2000 evaluation to determine algorithm differences. As stated previously, the comparison focused on performance issues, characteristics, and trends noted in the 2000 evaluation. Table 4. Identified CAT events, affected regions, duration and number of associated PIREPs. Event
Region
1
Northeast, Midwest, Mid-Atlantic Plains
2 3
Midwest, Great Lakes Midwest, Great Lakes Northwest
4
5 6
8
Midwest, Mid-Atlantic Plains, Midwest, Great Lakes Central CA
9
Mid-Atlantic
10
Great Lakes
7
4
Duration Date and Time (UTC) 1/24/00 1320 1/25/00 1255
# of PIREPs
2/11/00 1500 2/11/00 2320 2/14/00 0100 2/14/00 0945
6
2/26/00 1530 2/27/00 0305
20
3/2/00 2010 3/3/00 0525 3/3/00 1400 3/4/00 0230 3/10/00 1945 3/11/00 0355
21
3/4/00 1945 3/5/00 0420 3/22/00 1320 3/23/00 0135 4/2/00 1525 4/3/00 0050
12
33
6
16 8
4 9
Results
4.1 Lead-time The methodology for determining the ITFA lead-time for each case involved identifying the ITFA products that contained forecasts of turbulence potential that corresponded with the event area as defined by the
1 2 3 4 5 6 7 8 9 10
ITFA 2001 Lead-time (hours) 12 0 0 3 12 *6 **12 6 12 6
ITFA 2000 Lead-time (hours) 9 0 0 3 0 0 3 3 12 6
Difference in Lead-time (hours) +3 0 0 0 +12 +6 +9 +3 0 0
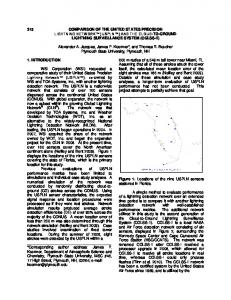
* 6 hours lead-time was for 30 – 35 kft only. This positive indication was not consistent with the F3 and F0 ITFA runs. ** 12 hours lead-time was for 30 – 35 kft only. This positive indication was not consistent with the F9, F6, and F3 ITFA runs. For the overall evaluation period, ITFA lead times ranged from 0 to 12 hours. ITFA 2001 increased the lead-time for some events, the results shown in the last column of Table 5, compared to ITFA 2000. Five of the events had no lead-time increase for ITFA 2001, while the remaining five events had a lead-time increase in ITFA 2000. Events 6 and 7 had a leadtime of six and twelve hours respectively. However, these forecast lead-times were isolated to the 30 – 35 kft layer and did not appear in subsequent forecasts. Event 5 had the greatest increase in lead-time for all the events. The ITFA 2001 algorithm focused on the advisory area (Figure 2) with values of .5 to .75, which is at least moderate turbulence likely. As an example, Figure 3 shows the ITFA 12 hour forecast, valid at 2100 UTC on 02 March 2000. The forecast shows a small area of 0.625 to 0.75 values along the Northwest Pacific coast, which correlates well with the advisory area in Figure 2. This trend continued in the subsequent forecasts with increased ITFA forecasts in the advisory area.
Figure 2. Event 5 SIGMET advisory area issued by the AWC.
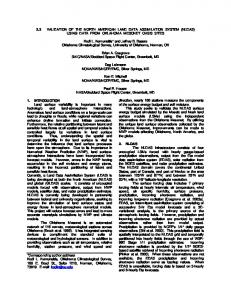
Figure 4. ITFA 2000 12-hour forecast, Event 5, 26 – 30kft.
As shown in Figure 4, ITFA 2000 forecasted light turbulence areas (< .5) in the advisory area. This trend of light forecasting also continued until the 0 hour forecast. Thus for ITFA 2000, there was a 0 hour lead-time. Comparing the two, there is a significant improvement in the lead-time for this event using the 2001 version of ITFA. Figure 3. ITFA 2001 12-hour forecast, Event 5, 25 – 30kft.
4.2 End-time In 2000, ITFA generally diminished forecasts towards the end of the events. However, in some events in ITFA 2001 it was seen that the forecast did not diminish for the end of the event. Because the evaluation was performed using SIGMETs and PIREPs, there is the possibility that the ITFA 2001 is correct. When SIGMETs are discontinued, it could be because PIREPs are not available to support the continuance of the SIGMET. This may be due to aircraft diverting away from the turbulence regions, the lack of aircraft during overnight hours, or the turbulence moved away from United States airspace. 4.3 Intra-event Consistency ITFA products created prior to and during each event were compared to each other to determine how ITFA resolved each particular event over time. Overall, it was observed that ITFA output from successive generation times valid for the same time periods were consistent with each other, with onset, evolution and end of the event generally being resolved with greater accuracy with each successive ITFA run. For example, for most of events the 9-hour forecast showed more turbulence forecasted in the advisory area than the 12-hour forecast, and so on. However, observations were made of ITFA products produced at 1200 UTC that contained forecasts with decreased spatial resolution and/or lower forecast values than those products valid for the same time produced at 0900 and 1500 UTC. While the ITFA 1200 UTC products are not generated in a manner different from other runs, it is possible that the RUC fields used as input to ITFA at 1200 UTC may be the cause of the
observed discrepancy. In ITFA 2001, this occurred in events 1, 7, and 9.
State University and NWS for providing timely access to their aviation weather products.
4.4 PIREP Processing
7.0 REFERENCES
In 2000 a PIREP override function was used so that a PIREP of severe turbulence could influence future output (up to six hours). This was not observed in any of the events in 2001. While ITFA 2001 runs appeared to be well correlated well with the PIREPs, this did not appear to be due to a PIREP override, but rather was an influence of the overall algorithm output.
Passetti, V., D. Sims, T. Carty, and J. Weinrich, 2000; Integrated Turbulence Forecasting Algorithm Meteorological Evaluation. Ninth Conference on Aviation, Range, and Aerospace Meteorology, Orlando, FL, 472 – 475.
5.0 Conclusions The 2001 ITFA Meteorological Evaluation indicated improvement in the ITFA 2001 compared to ITFA 2000 for the forecasting of turbulent regions. ITFA lead-time ranged from 0 to 12 hours. The leadtime increased for half the events in ITFA 2001 over ITFA 2000. ITFA 2001 correlated with the end-time if the events decreased compared to 2000. This was due to increased coverage and intensity of the forecasts at the end of the event as compared to the 2000 results. The Intra-event consistency of the forecasts tended to show an increase in coverage and intensity. This occurred as the forecast progressed closer to the beginning of the event time, from the 12 hour forecast to the 0 hour forecast. This did not occur on some occasions for the 1200 UTC hour. This decrease in forecast intensity and coverage is possibly due to the RUC model. For several of the ITFA runs, PIREPs of moderate or greater intensity correlated well with the turbulence forecasts. This correlation increased with the changes in the algorithm in 2001. The PIREP override function that occurred in ITFA 2000 was not observed in ITFA 2001. Feedback of the results will be presented to the Turbulence PDT for the improvement of ITFA. Future ACT-320 work will include the analysis of the individual indices making up ITFA. This will determine which indices have the best performance in detecting turbulent regions. Final results of all work will be documented in an ACT-320 report. 6.0 ACKNOWLEDGEMENTS The authors wish to thank NCAR personnel for their time and support of this project. Thanks especially to Bob Sharman, Celia Chen for organizing the ITFA data and supporting the transfer of the ITFA output to the WJHTC, and Jamie Vogt for her technical guidance. Additional thanks are offered to the Florida
Sharman, R., Brown B. and S. Detting; Preliminary Results of the NCAR Integrated Turbulence Forecasting Algorithm (ITFA) to Forecast CAT. Ninth Conference on Aviation, Range, and Aerospace Meteorology, Orlando, FL, 460 – 465.