erscheint in: In Silico Biology 5(1), 2005
Integrating Data from Biological Experiments into Metabolic Networks with the DBE Information System Ljudmilla Borisjuk Mohammad-Reza Hajirezaei Christian Klukas∗ Hardy Rolletschek Falk Schreiber Institute of Plant Genetics and Crop Plant Research Corrensstr. 3, D-06466 Gatersleben, Germany
Summary Modern ’omics’-technologies result in huge amounts of data about life processes. For analysis and data mining purposes this data has to be considered in the context of the underlying biological networks. This work presents an approach for integrating data from biological experiments into metabolic networks by mapping the data onto network elements and visualising the data enriched networks automatically. This methodology is implemented in DBE, an information system that supports the analysis and visualisation of experimental data in the context of metabolic networks. It consists of five parts: (1) the DBE-Database for consistent data storage, (2) the Excel-Importer application for the data import, (3) the DBE-Website as the interface for the system, (4) the DBE-Pictures application for the up- and download of binary (e. g. image) files, and (5) DBE-Gravisto, a network analysis and graph visualisation system. The usability of this approach is demonstrated in two examples. Keywords: Metabolic networks, Visualisation, Metabolic profiling, Information system, Data integration
1
Introduction
Metabolic pathways or more generally biological networks provide the basis for every living organism. In order to understand the interactions between different metabolic ∗ To
whom correspondence should be addressed (
[email protected])
1
pathways, biochemical experiments are carried out. These experiments produce a large amount of data such as expression profiles and metabolic time series. Experiments are often repeated multiple times to compare the influence of different growth conditions or genetic modifications, and often many substances are detected at once. For data analysis purposes the biological context (e. g. the metabolic network) needs to be considered. We discuss an approach for the mapping of data onto metabolic networks for their dynamic visualisation and analysis. This methodology is implemented in a comprehensive information system called DBE (Data analysis and visualisation system for B iological E xperiments), which helps biologists in managing and analysing their experimental data, especially metabolic data. In addition to the data mapping, the DBE data storage layer makes it possible to store experimental results in a single place and in a consistent form. Mapping experimental data onto metabolic networks opens new possibilities in analysing and visualising this data in the context of networks. Contrary to other systems which map such data onto static pictures [13, 14], network-mapping allows new analysis methods (e. g. the computation of metabolic paths with the highest data changes) and advanced interactive visualisation and navigation techniques.
2 2.1
Methods Mapping of experimental data onto dynamic networks
Biological experiments are carried out in order to gain a deeper understanding of the metabolism of an organism, under changing conditions or while comparing different lines or mutants. Modern techniques like mass spectrometry allow biologists to analyse metabolite concentrations of up to 100-200 substances at once. This helps to gain a more complete view of the changes in the metabolism. But even more important than the number of analysed substances is the knowledge of the underlying processes. The measured metabolites are part of a huge network of metabolic reactions. This is the foundation for the presented integration method. During the analysis of experimental metabolic data an integrated view of the underlying network and the corresponding measured values needs to be considered. Our approach consists of three parts: (1) dynamic networks, (2) data mapping and (3) charting for the display of the measured values. (1) Contrary to mapping of data onto static pictures [13, 14] we consider dynamic networks. Dynamic networks are networks that are either derived from databases (e. g. Proton/MARGBench[4, 5], KEGG[7]) or given by the user. They may, for example, change depending on the set of substances analysed in a particular experiment. (2) Data mapping is the assignment of data from experiments onto network elements. Here we consider the assignment of metabolite measurements to metabolic networks, but in general different experimental data can be mapped onto corresponding network elements of biological networks: protein levels onto protein-protein-interaction networks, transcriptomic data onto gene regulatory networks, and so on. Such a map-
2
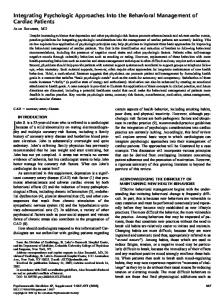
Figure 1: Components of the DBE information system and the external data source Proton/MARGBench. ping can be carried out automatically if there exists a function which assigns every data value to a network element. (3) Charting techniques (e. g. bar or line charts) are used to display measured values in the context of the network elements. Metabolite levels are shown inside the corresponding network nodes (metabolites), elucidating the interpretation of the data and the interaction between various metabolic routes.
2.2
The DBE information system
The DBE information system consists of a number of components, see Fig. 1: (1) the DBE-Database, (2) the Excel-Importer application which extracts biological experimental data out of Excel-files and stores this data in the database, (3) the DBE-Website as the interface of the system, (4) the DBE-Pictures application, which supports the up- and download of binary (image) files and (5) DBE-Gravisto, a network analysis and visualisation system. The Proton/MARGBench system [4, 5] allows the integration of biological network data from different relational databases (e. g. KEGG, BRENDA). It is not a component of the DBE system but closely coupled to it. Although different techniques are used to implement the individual components of the information system, they are all uniformly accessible from the DBE-Website. In the following the different components are described in more detail: (1) DBE-Database: The focus of this database, implemented as an Oracle 9i
3
Figure 2: Entity-Relationship-Model of the DBE-Database database, is the storage of metabolite data connected to biological experiments. The Entity-Relationship-Model [12] is shown in Fig. 2. The top entity is the “experiment”table, which stores information about the import (e.g. time, username, name of experiment). For each experiment a number of “plants” can be stored. Genotype, variety and growth-conditions of these plants are saved in this entity. From these plants biologists take “samples”. For each sample a number of “measurements” can be stored in the database. Two entities for user management, the “account” and “usergroup” tables, are used to specify the accessibility of an experiment for different users. Additional reference information can be assigned to the “substance” and “substancegroup” entities. These tables store reference information so that the users use a defined vocabulary for substances and measurement-units. (2) Excel-Importer : While examining different laboratory PCs it became clear, that these PCs run different Windows versions and special laboratory software that is suited for the special types of analysis apparatus that are in use by the biologists. The common export format from these software packages is Microsoft Excel. A solution that can process Excel files enables the biologists to copy the experimental data tables from the analysis software directly into the import template. A number of additional fields in the template, such as start of the experiment, notes, plant names and growth conditions can be added too. This way it is possible to enter all relevant data at one place into one file. (3) DBE-Pictures: In order to be able to compare raw data and the corresponding pictures and chromatograms it is of great importance to include all this information in the database. This enables the users to identify known and unknown substances even after a very long period. To manage this type of data the DBE-Pictures application was designed. This application makes it possible to upload and assign image files to experiments, plants and to individual measurements. Additional commands make it
4
possible to remove individual files or all files that are assigned to experiments, plants or measurements. It is also possible to download, save or view uploaded images and binary files. Therefore the user can also store experiment related files (e.g. documentation) in one place, which makes it easy to share experiment related data. (4) DBE-Website: The web interface makes it possible to access the different components of the information system. It can be used to initiate the import of experimental data into the database, to do basic data retrieval tasks, and to manage the experimental data stored in the database. The DBE-Pictures and DBE-Gravisto applications can be started directly from the DBE website by using Java Web Start [8]. (5) DBE-Gravisto: This system is based on Gravisto [1], an extensible graphlibrary and -editor. We developed several Gravisto-plugins (application extensions) to access the DBE-Database, to map experimental data onto given networks, to visualise the data-enriched networks, and to perform network analysis tasks. Visualisations created with DBE-Gravisto can be exported into standard graphics formats such as JPG, PNG, SVG or PDF. Examples for such visualisations are shown in the following section. The visualisation can be enhanced by using different levels of detail. A simple drawing of the chart without labels or captions is well suited for a larger view of the biological network. For a high zoom level where only few network elements are visible, more details (captions, legend and label) can be shown.
3 3.1
Results Example 1 - comparison of different bean plant lines
To demonstrate the utility of our integrative bioinformatics approach we used metabolite data from the seed development of beans (Vicia narbonensis). Beans and other legume species are an economically important plant-derived protein source in the worldwide feed and food industry. In this case transgenic technology was used to increase protein accumulation by introducing the bacterial enzyme PEPC into the seed. The enzyme re-fixes HCO3 - deliberated by respiration and together with phosphoenolpyruvate yields oxaloacetate that can either be converted to aspartate or into malate and other intermediates of the citric acid cycle. PEPC controls the anaplerotic carbon flow and may improve seed carbon economy [6]. Analysis of mature seeds revealed that transgenic seeds have a significant increase in crude protein content up to 20% per gram and a higher dry weight. Combining both effects reveals that protein content per seed increases by 40 to 50% [10]. Tracer experiments could further show a clear stimulation of both [14 C]-CO2 uptake and incorporation into proteins. This corresponds to higher in vivo fluxes via the PEPCcatalysed pathway. Because the transgenic effect appeared with different intensities and varied in many trangenic lines, visualisation of multiple changes for a snap overview was needed to recognize general tendencies. To characterise the responsible metabolic shift within seeds from sugars/starch into organic acids/amino acids/proteins, the metabolite pattern for gylcolysis, citrate cycle as well as related sugars and free amino acids was analysed. Metabolites were
5
Figure 3: Visualisation of experimental data in the context of a metabolic network: Relative substance levels of different Vicia narbonensis lines (wild type in dark-grey, transgenic lines in light-grey), mapped onto the glycolysis and the citric acid cycle.
6
measured by liquid chromatography coupled to mass spectrometry (LC-MS). This technique allowed the separation according to retention times and molecular masses, and enabled parallel quantitative determinations with very low detection limits (subpicomolar range). A detailed description of this metabolite profiling technique can be found in [10]. Visualisation of metabolites within their pathways (Fig. 3) gives an immediate overview of specific changes in metabolism within transgenic seeds. There was a clear trend towards the decrease of sucrose and phosphorylated sugars of the glycolytic pathway (Glucose-6-P, Glucose-1-P, Fructose-1,6-diP), but increases in the pool size of certain free amino acids due to transgene expression. Concentration of Acetyl-CoA was significantly higher in all transgenic lines as well as an overall trend towards higher levels of intermediates of the citric acid cycle. Thus, the PEPC expression in Vicia narbonensis seeds leads to changes in the metabolite pattern, indicating a shift of metabolic fluxes from sugars/starch into organic acids/amino acids/proteins. The metabolite profiling approach combined with bioinformatics tools and visualisation techniques used here enables the identification of the effects of transgene expression on plant metabolism in a fast and efficient way. In certain types of experiments it may help scientists to find new targets for transgenic invasions.
3.2
Example 2 - seed development time series analysis
In this example we investigated the metabolite pattern of growing barley caryopses (Hordeum vulgare). The agronomical importance of cereal seeds is principally based on their accumulation of storage products, mainly starch and proteins. Despite extensive studies on the structure, biochemistry and genetics of developing grains [2, 3, 9] the regulatory mechanisms underlying their high storage capacity are largely unknown. During their growth, caryopses undergo distinct differentiation events. These in turn are reflected in changes of the metabolic state and biosynthetic fluxes. To investigate their specific temporal patterns, time series analyses of metabolites are required. Seed development includes the pre-storage, intermediate and storage phase. Within the pre-storage phase caryopsis consists mainly of pericarp tissue, embedding the liquid endosperm. Increase in the fresh weight and starch accumulation is low. The subsequent intermediate phase begins after endosperm cellularisation at 4-5 days post anthesis (DPA) and proceeds with the differentiation of endosperm tissues. Starch accumulation starts, although with low synthesis rates. The endosperm enlarges, becoming the main storage organ of cereal seeds. During the main storage phase (from 10-11 DPA onwards), the high starch synthesis rate is evident (Fig. 4). Caryopses were harvested every 2 days over a growth period of about 20 DPA. Dynamic changes of about 70 metabolites were characterised. A typical example visualisation of time series data is given in Fig. 5. In this case we used two line charts for the display of the time series data, the chart at the top of each network element shows the development of the metabolite concentrations for samples taken at day, the chart below shows the experimental data from samples taken at night. Such representation allows to observe not only developmental changes, but also metabolic responses on day/night conditions. Effect of light and darkness
7
Figure 4: Structural changes of growing barley caryopsis and localisation of starch accumulation during pre-storage-, intermediate- and main storage stage of development. Starch deposition is visualised within the cross sections through caryopsis (shown in dark colour, after iodine staining, upper panel) and tissues structures shown in darkfield images (lower panel): 1-pericarp, 2-endosperm.
8
Figure 5: Visualisation of experimental data in the context of an metabolic network: Relative substance levels of Hordeum vulgare seeds sampled during day (top diagram inside the network elements) and night (bottom diagram), respectively.
9
on accumulation of storage products and metabolic fluxes is recently under investigation [11]. It is shown, that the amplitude of this response changes during development and visualisation of these changes in developmental scale is of big importance.
4
Discussion
We presented an approach for integrating data of biological experiments into metabolic networks by mapping the data onto network elements and visualising the data enriched networks automatically. The developed information system allows the user to store the results of biochemical experiments and digital images of plants, chromatograms and experiment related binary files consistently in one place. Because of the built-in usermanagement and access-system biologists can easily share their work results (measured values and visualisations) within their group, between different departments or even with the public. Our approach has already proved it’s usefulness as biologists use the system to support their scientific work, as shown in the application examples. Different charting techniques are useful in various applications. In the first example a condensed bar chart is used, where each displayed data point is based on a number of repeated measurements. The standard error of these measurements, represented by a line of variable length, makes it easier to estimate the relevance of differences. A future task is the integration of statistical methods to allow a more comprehensive data analysis. In the second example line charts are well suited for the display of time series data. The stacking of different result sets (here day and night), gives an immediate overview of the data. Because of high quality output of the visualisations and the export functionality (graph file export in GML format, and image export in JPG, PNG, SVG and PDF format) the system is also in use for presentation purposes such as the creation of images for posters or papers. In the future we plan to develop network-search and filter algorithms, which allow the user to analyse and visualise parts of metabolic pathways that are of interest or for which experimental data is available. Along with that we plan to develop interactive network layout and navigation methods. The DBE information system has significant potential as a powerful tool in experimental biology and biotechnology. Its visualisation and modelling of metabolic pathways allows better understanding of the systems and consequences of experimental manipulation. This leads to more efficient, targeted and successful experimental design, and promotes better achievement of biological and biotechnological goals. Taken together we present a tool combining bioinformatics and biochemistry in order to facilitate for biochemists the storage, management and visualisation of all processed results. Further work is still needed to find out whether it might be possible to make predictions about any interaction between metabolite channelling through various compartments and how an efficient modification of a pathway can be prepared to increase and/or decrease an endproduct. Currently the DBE information system is already in use by scientists at the IPK. After implementation of the discussed extensions the components of the system will
10
be available for public users.
Acknowledgements We would like to thank Prof. Franz J. Brandenburg, Michael Forster, Andreas Pick, and Paul Holleis (all University of Passau) for excellent cooperation and for granting usage of Gravisto; Prof. Ralf Hofest¨adt and Andreas Freier (Bielefeld University) for fruitful cooperation and permission to use the PROTON/MARGBench system. For helpful discussion and support we thank Prof. Ulrich Wobus and Prof. Uwe Sonnewald (IPK Gatersleben). This work was supported by the German Ministry of Education and Research (BMBF) under grant 0312706A. We acknowledge funding by the Land Sachsen-Anhalt (MK-LSA 0031KL/1002L).
References [1] C. Bachmaier, F. J. Brandenburg, M. Forster, M. Raitner, and P. Holleis. Gravisto: Graph visualization toolkit. In Proc. Intl. Symposium on Graph Drawing (GD’04), 2004, to appear. [2] J. D. Bewley and M. Black. Seeds - Physiology of Development and Germination. Plenum Press, New York, London, 1994. [3] C. M. Duffus and M. P. Cochrane. Carbohydrate metabolism during cereal grain development, pages 43–66. Elsevier Biomedical press, 1982. [4] A. Freier, R. Hofest¨ adt, M. Lange, and U. Scholz. MARGBench - an approach for integration, modeling and animation of metabolic networks. In Proceedings of the German Conference on Bioinformatics (GCB ’99), pages 190–194, 1999. [5] A. Freier, M. Lange, and R. Hofest¨adt. Integrative analysis of gene networks using dynamic process pattern modelling. In Bioinformatics of Genome Regulation and Structure, pages 257–264. Kluwer Academic Publishers, 2004. [6] S. Golombek, U. Heim, C. Horstmann, U. Wobus, and H. Weber. Phosphoenolpyruvate carboxylase in developing seeds on Vicia faba. gene expression and metabolic regulation. Planta, 208:66–72, 1999. [7] M. Kanehisa and S. Goto. KEGG: kyoto encyclopedia of genes and genomes. Nucleic Acids Research, 28(1):27–30, 2000. [8] M. Marinilli. Java Deployment with JNLP and WebStart. Sams Publishing, 2001. [9] O. A. Olsen, R. H. Potter, and R. Kalla. Histo-differentiation and molecular biology of developing cereal endosperm. Seed Science Research, 2:117–131, 1992.
11
[10] H. Rolletschek, L. Borisjuk, R. Radchuk, M. Miranda, U. Heim, U. Wobus, and H. Weber. Seed-specific expression of a bacterial phosphoenolpyruvate carboxylase in Vicia narbonensis increases protein content and improves carbon economy. Plant Biotechnology Journal, 2:211–219, 2004. [11] H. Rolletschek, W. Weschke, H. Weber, U. Wobus, and L. Boriskuk. Energy state and its control on seed development: starch accumulation is associated with high atp and steep oxygen gradients within barley grains. Journal of Experimental Botany, 55:1351–1359, 2004. [12] G. Saake and A. Heuer. Datenbanken, Konzepte und Sprachen. Thomson Publishing, 1997. [13] O. Thimm, O. Bl¨ asing, Y. Gibon, A. Nagel, S. Meyer, P. Kr¨ uger, J. Selbig, L. A. M¨ uller, S. Y. Rhee, and M. Stitt. MAPMAN: a user-driven tool to display genomics data sets onto diagrams of metabolic pathways and other biological processes. The Plant Journal, 37:914–939, 2004. [14] G. Wolf. Visualising gene expression in its metabolic context. Briefings in Bioinformatics, 1(3):297–304, 2000.
12