Integrating Decision-Making Support in Geocollaboration Tools
Pedro Antunes,1 Gustavo Zurita,2 Nelson Baloian,3 Claudio Sapateiro4 1
Victoria University of Wellington, School of Information Management
PO Box 600, Wellington 6140, New Zealand
[email protected] 2
Universidad de Chile, Economy and Business School,
Diagonal Paraguay 257, Santiago de Chile, Chile
[email protected] 3
Universidad de Chile, Engineering School,
Blanco Encalada 2120, Santiago de Chile, Chile
[email protected] 4
University of Lisbon, Department of Informatics
Campo Grande, 1749-016 Lisbon, Portugal
[email protected]
Corresponding author: Pedro Antunes PO Box 600, Wellington 6140, New Zealand Phone: +64-4-463-5525 Fax: +64-4-463-5446 Email:
[email protected]
1
Abstract Collaborative Spatial Decision Making (CSDM) involves multiple stakeholders making strategic decisions based on spatial data. Current CSDM tools have been exploring different ways to integrate spatial data with collaboration, distribution and mobility. Notably, decision-making support has not seen the same level of attention. This paper discusses the challenges raised by the integration of decision-making models in CSDM tools. We review a large collection of decision-making models using three different views: sequential, dynamic and continuous. From this review we derive a conceptual model and a set of functional requirements necessary to integrate decision-making support in CSDM tools. The conceptual model highlights the importance of several functions in decision-making processes: representing problems, finding alternatives and making choices (sequential view); classification and communication (dynamic view); and perception, comprehension and projection (continuous view). The paper also describes a prototype developed to validate the model. The paper provides two main research contributions: a unified view of decision-making support and an innovative CSDM tool blending spatial data with decision-making support.
Keywords Collaborative Spatial Decision Making, Decision Making Models, Collaboration Support.
1. Introduction This study is motivated by the aim to develop a collaborative tool supporting e-planning (Arias et al. 2000). E-planning is the label adopted by a wide-ranging research agenda addressing the interaction between information technology and planning, including various key concerns such as territorial management, policy making, governance, citizenship and participation (Curwell et al. 2005). Our mission was supporting a group of stakeholders (architects, urban designers, city planners, public administrators, and social and political scientists) collaboratively developing city plans. E-planning is a complex task involving various types of geographically related data, including physical infrastructure, environment and landscape, land use, human and organizational presence, economic data and crime statistics, just to mention a few (Stevens et al. 2007). It is context-dependent, as the stakeholders are expected to change along the exploratory process. And it is also a prolonged
2
process, which may cycle through several stages, but that should necessarily evolve towards a concrete plan. Thus an e-planning tool should combine various types of information with various types of tasks in a coherent but flexible decision-making process. The integration between spatial data, collaboration and decision-making is relatively recent. The research community refers to it as Collaborative Spatial Decision Making (CSDM) (Rinner 2006; Rinner et al. 2008). On the one hand, CSDM expands Geographical Information Systems (GIS) with new ways to collect spatial data, to relate spatial data with other types of data, and to display and analyse all this data according with their geographical context (MacEachren 2005; MacEachren et al. 2005; MacEachren et al. 2006). On the other hand, CSDM builds upon GIS with decision-making models and processes, task coordination, collaboration, and new types of collaboration data like talks, chats, discussions, negotiations, and brainstorms (Arnott and Pervan 2005; Jankowski 2009). Though research has been showing that it is very difficult to integrate decision-making support in collaborative systems. Zurita et al (2008) refer the lack of interoperability with other tools commonly used by organizations. Briggs et al (2003) highlight their inherent lack of generality: decision-making support must be carefully engineered for sustainable success within a particular group accomplishing a specific task. Uran and Janssen (2003) point out the design problems resulting from meeting specifications that are not clearly linked to the decision problems these systems are expected to support. Briggs et al (2001) emphasize the social dimension of the problem, saying that the technology must be perceived as useful and easy to use in order to be successful. Kolfschoten et al (2009) also highlight emotional factors such as satisfaction with the process and the results, and commitment to the process. Munkvold and Anson (2001) emphasize the organizational dimension of the problem, identifying management support, the role of project champions and formalized project plans as critical success factors. Gray and Mandiwalla (1999) adopt a more theoretical stance, stating that the main problem lies in an insufficient interplay between computer science, behavioural science, and management science. For instance, a strict attention on assessing existing technology forgets that computing tools are permanently evolving. The strict focus on tool development disregards the accumulated knowledge about group behaviour, participation and decision-making. And the strict focus on management issues
3
necessarily overlooks that computing tools raise unexpected opportunities for redesigning work activities. In this paper we address CSDM using Gray and Mandiwalla’s eclectic view. Our research is influenced by technical challenges posed by the integration of spatial data with decision modelling and collaboration. But it is also highly influenced by the necessity to bring together the best practices found in behavioural and management sciences. We have structured our research according with three consecutive goals: (1) review existing models, considering different assumptions about the nature of decision-making processes; (2) derive a conceptual model capable to integrate these different views and identify a set of requirements for developing CSDM tools; and (3) validate the conceptual model in an innovative CSDM tool. The remaining text is organized as follows. In the following section, we review a large collection of models, emphasizing the sequential, dynamic and continuous characteristics of decision-making processes. In section three we discuss the main communalities we find in the reviewed models and propose a unifying conceptual model. In section four we review a collection of CSDM tools using the conceptual model. This highlights the main advantages of having a unified model, which facilitates tool comparisons and serves to identify omissions and opportunities. In section five we describe how the conceptual model influenced the e-planning tool development. We conclude the paper with a synthesis and discussion of the obtained results.
2. Overview of Decision-Making Models We organize this overview according with three complementary perspectives we identify in the research literature: sequential view, characterizing the progressive nature of decision-making processes; dynamic view, which brings forward the dynamic context of the decision-making process; and continuous view, which emphasizes decision-making as a dynamically coupled activity.
2.1. Sequential view Many models have been proposed to explain the structure of decision-making processes. One highly influential perspective is the Subjective Expected Theory (Ramsey 1931; Fishburn 1981). Basically this theory considers that rational people, when facing a set of alternatives and outcomes, will start by defining a utility function and then determine which choices should be elected. This theory is
4
the basis for what has been designated normative approach to decision making under uncertainty (Fishburn 1981). Other theories follow this normative approach. For instance, the Analytic Hierarchy Process (AHP) (Saaty 2008) recommends breaking down the problems into sets of decision elements and then collecting data regarding these elements, estimating the relative weights of decision elements, and finally aggregating the relative weights to obtain a set of ratings for the decision alternatives. Simon (1987; 1997) criticized the normative approach for its perfect utility-maximizing rationality, emphasizing that in real-world organizations people do not have the perfect conditions necessary to frame the problems, define criteria and evaluate the alternatives in a systematic way. This occurs because problems are complex, evaluation processes face multiple constraints and the solutions are often politically influenced. For that reason Simon proposed the Problem Solving Model, which breaks down the decision-making process in three stages: representing the problem, analysing alternatives and making choices (these elements are often designated intelligence, design and choice). Simon suggests that these three stages are not necessarily followed in turn, as often the decision makers have to go back and forth, but they may nevertheless be found in any decision process. Two fundamental concepts necessary to understand the Problem Solving Model are heuristics and the notion of satisficing. Heuristics explain why decision makers often diverge from the normative approach by simplifying the search for alternatives through compromises and rules of thumb. The notion of satisficing explains why decision makers often do no aspire to maximize utility but instead just seek to satisfy reasonable conditions for their solutions. Many other theories further elucidate the activities done in each one of the Simon’s stages. For instance, the Cooperative Decision Making model (Wong 1994) introduces the importance of negotiating conflicts when analysing alternatives. The Participatory Decision Making model (Kaner 1996) highlights that decision makers should work in a divergent mode while representing problems but should converge when making choices. The Collaboration Engineering approach (Kolfschoten and de Vreede 2009), which has been investigating the detailed design of decision-making processes, proposes a collection of generic (or patterned) activities that may be adopted in each one of the Simon’s stages. In this collection we may find activities such as generate, reduce, clarify, organize, evaluate and build consensus.
5
Bringing forward the geographical context of the decision-making process, we note that spatial data may support any activity conducted at any of the three stages discussed above, even though the relationships between spatial data and problem representation seem stronger, as this stage emphasizes data collection and analysis. Figure 1 provides a brief summary of the models described above.
Figure 1. Sequential view.
2.2. Dynamic view The dynamic view challenges the previously discussed models on the assumption that very often problems have a dynamic nature that forbids a sequential approach. This argument is emphasized by the Recognition Primed Decision Making (RPDM) theory (Klein 2008), which most distinctive characteristic is regarding decision making as highly dependent on time pressure, uncertainty, illdefined goals, life and economic threats, and other external conditions affecting people in naturalistic settings. This approach, instead of trying to define how decisions should be structured, seeks to understand how decisions are actually made. In particular, RPDM has been applied to understand emergency management teams such as fire-fighters (Mendonça and Wallace 2004). RPDM stresses three fundamental components of decision-making: experience the situation, recognize and classify, and react to the situation. Action plays a very significant role in this model because it is considered a fundamental decision-making strategy aiming at better understanding the problem situation as it evolves through time. Departing from a completely different frame of reference, but also adopting a dynamic perspective over the decision-making process, we find the Soft Systems Methodology (SSM) (Checkland and
6
Poulter 2006). SSM proposes a conceptual approach to decision making based on research in action, where wicked problems cannot be completely solved, because they are not fully understood, but instead they are iteratively situated, modelled, debated, accommodated and then acted upon in multiple trial and search cycles. As with RPDM, SSM emphasizes action as a fundamental driver for decision making, instead of analysis and structure. We finally observe that the geographical context may be related with the recognition phase, since spatial data may help better situating problems in their physical world. Figure 2 overviews the discussed models.
Figure 2. Dynamic view.
2.3. Continuous view Decision-making should also be regarded as a collection of activities affected by almost invisible individual and collaborative functions (Fisher and Dourish 2004). One of the earliest models addressing this view is the Stimulus-Organism-Response model (Card et al. 1983). It regards humans as information-processing machines where events ignite cognitive activities, followed by physical actions, which in turn originate new events. In this model, decision-making is a sequential endeavor systematically adjusted through feedback information. The Stimulus-Organism-Response has been highly influential but is no longer widely accepted. More recent proposals regard humans as information processing systems, where the relationships between events, actions and feedback become much more complex (Yamanaka and Kawakami 2011). In particular, the Contextual Control Model (COCOM) (Hollnagel and Woods 2005) suggests that
7
events and actions are dynamically coupled in a continuum of permanent context determination and action planning. As such, decision-making should be seen as continuous rather than discreet. Another approach that explores the complexity of humans as information-processing systems is the Sensemaking theory (Weick et al. 2005). This theory highlights that the decision-making process depends on the equivocal perceptions and cognitive biases of the sensemakers. In particular, the Sensemaking theory defines two functions, enactment and retention, which influence how individuals decide to salient some aspects of a problem and not others. The retention function is particularly relevant because it underlines that past views of the situation influence the future views. The enactment function is related with what cues people decide to extract from available information. Overall, we observe that the continuous flow of cognitive activities is permanently supported by action and feedback information. Actually, the reviewed models hint that the notion of feedback may be quite restrictive. For instance, the Sensemaking theory considers that enactment is influenced by a mixture of attention, struggle for alertness, reflection, trial-and-error learning, and sense of retrospect (Weick 2001). Perhaps the best notion capable to elucidate these cognitive phenomena is situation awareness (Endsley et al. 2003): the perception of the elements in the environment, the comprehension of the current situation, and the projection of future status. We observe that the geographical context is related with this continuous view in several ways. First, spatial data may provide important cues to situation awareness, for instance highlighting important features of the physical world. Second, CSDM tools may support the retention of information elements manipulated by users. Finally, CSDM tools may stimulate dynamic coupling through dynamic data visualization. In Figure 3 we present a visual representation of the reviewed models. It should however be noted that this representation does not convey the whole richness of the referenced models. This figure primarily serves to highlight how problems and solutions are dynamically coupled and to suggest how spatial data may support such dynamic coupling.
8
Figure 3. Continuous view.
3. Conceptual Model and Design Requirements Based on the previous discussion, we now propose an integrated view of the decision making process. The diagram shown in Figure 4 integrates the main conceptual elements we have discussed in the previous section. Since most concepts are associated with activities, we adopted Use Case diagrams to model their relationships.
Figure 4. Conceptual model.
We define the decision-making process as including one main activity, sequential decision making, which reflects the importance generally attributed to the sequential view. This activity includes three sub-activities: •
Represent the problem – Several authors suggest this type of activity should be accomplished in a divergent mode (Briggs et al. 2003).
9
•
Find alternatives – We do not find guidance from the research literature indicating in what mode this type of activity should be accomplished (Fjermestad and Hiltz 1999).
•
Make choices – Several authors suggest a convergent mode for this type of activity (Briggs et al. 2003).
Then we consider two extensions to the decision-making activity: dynamic and continuous decision-making. We regard them as extensions because they have more restricted applicability than the sequential view. The former addresses situations where decision-making is constrained by dynamic factors such as lack of time, while the latter addresses cases where continuous adjustments to the decision making process are necessary, such as for instance in command and control operations. The dynamic decision-making use case includes the following activities: •
Recognition – Understand the problem situation through experience and knowledge. Here we distinguish two main sub-activities mentioned in the discussed models: classify, i.e. organize information according with salient features; and communicate, addressing the interaction between the decision-makers necessary to understand the situation.
•
Action – As previously stated, actions stimulate an active understanding of the physical world and therefore should be regarded as a decision-making strategy.
And we finally define one main activity for the continuous decision-making use case: •
Situation awareness – Set up by three sub-activities: maintaining a permanent account of the data elements relevant to the problem situation; perceiving their relationships with the physical environment; and understanding their possible evolution according with time through trial-and-error.
Based on this conceptual model, we may now derive some requirements for integrating spatial data with the decision-making process.
R1.a – CSDM tools should contextualize spatial data with information relative to the decisionmaking stages where such data is produced and exploited. As we have seen, making decisions comprises three stages: represent the problem, find alternatives and make choices. All these stages involve creating and managing spatial data in different ways and with various purposes. We propose that CSDM tools should explicit the sequence nature of the decision-making process and their corresponding activities by establishing the link between the data
10
and the stages where data is produced and exploited. Of course, this should be accomplished in a nonprescriptive way, retaining the decision makers’ capacity to design the decision-making process according with their own objectives and goals. Basically, this requirement suggests augmenting spatial data with a structured view of the decision-making process.
R1.b – CSDM tools should support sequential design of the decision-making process. This requirement corresponds to an extension of the previous one. If decision-making processes can be designed in so many different ways, then CSDM tools should allow users to explicitly design the process. This way both data and process management will be effectively integrated.
R2.a – CSDM tools should support dynamic problem recognition through feature classification of spatial data. Classifying salient features of the problem situation is a main characteristic of the dynamic view of the decision-making process. CSDM tools may combine geographical-oriented and problem-oriented features in spatial data.
R2.b – CSDM tools should support dynamic problem recognition through the combination of spatial data with communication-oriented information. Another salient characteristic of the dynamic view is the interaction between the decision-makers to debate, accommodate perspectives, analyse influential factors, and delineate actions to overcome the problem situation. CSDM tools may combine spatial data with this communication-oriented information.
R.3 - CSDM tools should exploit spatial data management to build situation awareness. Feedback, disturbances and ecological changes are necessary to engage the decision makers in a continuous flow of situation awareness and action; and spatial data should provide the adequate context for this realization. The collaborative dimension of decision-making processes mandates that situation awareness should be foraged from the whole group of decision makers. Since decision-making processes also involve data management, as mentioned above, it is reasonable to consider that data management should supply the stimuli necessary to build situation awareness.
11
We already pointed out that situation awareness involves the perception of the elements in the environment, the comprehension of the current situation, and the projection of future status. Spatial data should support these different types of awareness. CSDM tools can deliver cues about the objects present in the environment, who is interacting with those objects, and what the participants are actually doing, thus supporting perception. The comprehension of the current situation requires complementing these cues with a broader interpretation of the decision-making process. That is, the technology should be able to contextualize spatial data with the sequential decision-making activities that have been accomplished along the process. Finally, the capacity to project the future status may also be supported with spatial data. For instance, spatial data may be used to retain comments and notes about how the decision process is enfolding and what is the projected outcome.
4. Assessing Current CSDM Functionality In this section we analyse a collection of CSDM tools using the proposed conceptual model. We adopted the following approach to analyse the related literature. First, we started by collecting papers published in journals, conferences and workshops on the subject of enabling work on spatial data while simultaneously making collaborative decisions (MacEachren et al. 2005). This task allowed us to identify a set of 61 papers. We then reduced our selection to papers focused on the analysis, design, development and evaluation of CSDM tools, excluding papers centred on literature review, framework and theory development, infrastructure support to CSDM and specific application scenarios. A total of 18 papers were found to fulfil these criteria. Based on the previous set, we elected seven tools as most representative of current CSDM functionality. Tables 1 and 2 summarize our review of the selected applications.
(Convertino et al. 2005) (Rinner 2006)
R1 – Sequential view R1.a – Explicit R1.b Sequential stages process design Not supported, Not supported, activities are illactivities are structured organized according with roles Not supported Not supported, although the authors mention that the argumentation model may structure the decision-making
R2 – Dynamic view R2.a – Feature R2.b classification Communication Combines a database Chat tool, shared text with a map, supporting editor and shared visual landmarks and interactive map public annotations Database with Uses an geospatial objects argumentation model to structure discussions
12
(MacEachren et al. 2006) (Convertino et al. 2007; Convertino et al. 2008) (Capata et al. 2008) (MacEachren and Brewer 2004)
(Brewer et al. 2000)
Not supported, there is one single activity around the whiteboard Not supported, although it provides private and shared workspaces Not supported, although it supports thematic layers of work Defines exploration, analysis, synthesis and presentation stages, but does not actually implement them Not supported
process Not supported
Not supported, activities are organized according with roles Not supported
Tracks the users’ spatial interests and focus of attention
Captures spoken language and natural gestures
Database with geospatial objects that can be annotated; conventional symbols can also be associated to objects Database with map modifications approved by the coordinator
Annotations and scribbles
Not supported
Not supported
Supports messaging through a centralized coordinator Drawing and selection tools, voice communication
A need for activity logging was suggested
3D manipulations, voice communication
Table 1 – Literature analysis of CSDM requirements (part one).
(Convertino et al. 2005) (Rinner 2006)
Perception Activity awareness indicators, change icons and buddy list Hypermap metaphor
(MacEachren et al. 2006)
Multiple cursors
(Convertino et al. 2007; Convertino et al. 2008) (Capata et al. 2008)
Sidebar with shared annotations, telepointer, role-based indicators Popup change notifications sent to all team members Members’ behavioural cues, avatars, pointing gestures Depicts changes over time, gestures
(MacEachren and Brewer 2004) (Brewer et al. 2000)
R3 – Continuous view Comprehension Overview display with filters tailored for each specific role Visual access to geoargumentative relations Whiteboard with objects that may represent physical entities Multiple layers of geographical data
Projection Not supported Not supported Specialized incident management objects, like incident markers, roadblocks and shelters Not supported
Map overview
Not supported
Split-screen views
Temporal database queries and time series animation
3D data representation component
Queries at different temporal scales
Table 2 – Literature analysis of CSDM requirements (part two).
From this selection we may now draw some observations and comments. Our first observation is that none of the reviewed applications conveniently addresses the sequential view of the decisionmaking process (R1.a and R1.b). Actually, only MacEachren and Brewer (2004) refer the importance of managing various decision stages, although such functionality is not implemented in the prototype.
13
Most applications support the classification activity through a database retaining geospatial objects and associated symbols and annotations (R2.a). The communication requirement (R2.b) combines GIS functionality, such as mapping, selecting and drawing, with communication objects like shared annotations, chatting, text editing, and voice messages. From the group of reviewed applications, the most distinct one combines GIS with an argumentation model (Rinner 2006). Regarding situation awareness (R3), we note that perception seems to have received significant attention from the developers, with multiple available mechanisms, such as member awareness and activity awareness icons, change propagation markers, sidebars and telepointers. Comprehension is also very rich, based on overviews, whiteboards, screen layers and split screens. However, projection seems to be underdeveloped, being restricted to temporal database queries. One notable exception implements specialized situation awareness markers (MacEachren and Brewer 2004). More strategic features could be implemented nonetheless. This review illustrates how the conceptual model helps thinking about the decision-making process, benchmarking different applications and identifying areas deserving further developments. The review highlighted one area where to focus our design efforts: sequential process design (R1.b). Such support is described in the next section.
5. Developed Tool 5.1. Design considerations Our design considerations are strongly related with the requirements described in the previous section. Like most reviewed CSDM tools, the e-planning tool offers workspaces supporting map visualization and interaction. The map may be complemented with several geographically related objects like sketches, drawings and free-hand text contributed by the users. The map and associated objects materialize what we have been designating in generic terms by spatial data. Reflecting the conceptual model and derived requirements, the e-planning tool was structured around three different workspaces: ideation, discussion and planning. These workspaces explicit the three stages we defined in the sequential view of the decision-making process. Dedicated functionality supports process design. The component responsible for such functionality is described later.
14
We define that ideation is divergent and discussion and planning are convergent. This allows users’ free whiling and divergent thinking while gathering ideas, but requests the users’ focus of attention while processing ideas and developing a final plan. Consequently, the users work individually on ideation, and share the contents of the discussion and planning workspaces. The ideation workspace allows users preparing their ideas before sharing them with the others, which reduces free-riding, production blocking and evaluation apprehension problems (Stroebe et al. 1992). The discussion workspace serves to explore and refine ideas. Initially it only shows the map, but allows copying contents from the ideation workspace. In this way the users may share, organize and refine a set of ideas according with their geographical context. The planning workspace is functionally equal to discussion. It is initially empty and may be populated by copying contents from the discussion workspace. What makes it different from the discussion workspace is that it addresses a different stage of the decision-making process, being primarily intended to develop a final representation of the decisions made by the group, although it can be used for other similar purposes. For instance, if more than one alternative is generated in the discussion workspace, the participants could explicitly rank the alternatives in the planning workspace. Every workspace displays a map downloaded from Google Maps in the background and visual objects created by the users on top. Several icons (seen to the left of Figure 8 and also in Figure 6) are available to access additional functionality for editing visual objects, changing the current workspace, and other features like zoom-in and zoom-out (see menus in Figures 6 and 7). The decision-makers can communicate about the problem situation through sketching, drawing and writing over shared workspaces. We currently do not consider other data types such as chatting or voice communication, mainly because the tool is oriented to face-to-face collaboration. Feature classification is based on a database of geographically related visual objects. This database logs the changes made to the visual objects placed on top of the displayed map. This database supports version control in order to allow reviewing how objects were created and changed along a timeline. The users may individually or collectively cycle between the ideation-discussion-planning workspaces whenever necessary or convenient. This avoids having a prescriptive approach to the decision-making process. The literature shows that for certain simple decisions only the fist stage is necessary, and therefore only the ideation workspace may be used. More complex decisions may require using all workspaces. We note again that there is no functional distinction between the
15
discussion and planning workspaces. The different uses are more dependent on the implicit functionality associated to the decision-making stage than the tool’s constraints. Situation awareness is addressed at the perception, comprehension and projection levels. At the perception level, the tool provides visual cues about object manipulations done in shared workspaces, when creating and editing annotations and sketches, and also when changing their properties like colour and thickness. The comprehension and projection levels are related with process design and require discussing in more detail how users design the decision-making process (section 5.3).
5.2. Visualization and interaction support The e-planning tool runs on most Web browsers (Chrome, Safari, Mozilla). Internet access is necessary to work with the tool (more details in section 5.4). Since the tool is aimed at supporting geocollaboration, we developed it to operate with various mobile devices like notebooks, tablets and smartphones. These mobile devices afford having CSDM across physical locations, favouring face-toface interaction during the decision-making process and facilitating situation awareness through perception, comprehension and projection of the physical place where work is being carried out. Besides the mobile scenario, the tool also supports other work settings like having users face-toface in one single location, either using one single physical device attached to a large electronic whiteboard or having multiple physical devices projected over a large screen. The tools’ user interface was specifically developed to accommodate electronic whiteboards supporting touch-screen interactions, besides the traditional point-and-click interactions. A significant development effort has been done to implement touch-screen gestures over typical Web browsers. In order to describe in more detail the users’ interaction with the tool, we will illustrate a simple case where five users are working on planning the most adequate locations for placing bicycle rental stands and parking places in downtown Santiago de Chile. This planning activity was set up with the purpose to explore the adoption of ecological transportation in the city centre. Of these five users, two use iPads, two use portable MacBooks and one uses an iPhone. Figures 6 and 7 provide various views of the tool’s interface in these various devices. The left side of Figure 6 shows the tool running in the iPad’s Safari browser. The left side of figure 7 shows the tool being used in the iPhone. The right side of Figure 6 shows the tool being used in the MacBook’s Chrome browser. The right side of Figure 7 shows the tool running in the iPad’s Safari browser.
16
Figure 6. At left, the tool running in iPad’s Safari browser. At right, the tool running in MacBook’s Chrome browser.
Figure 6 shows how the tool displays information about who is currently participating in the working session (“User A” to “User D”). When a user joins a working session, the tool automatically synchronizes the shared workspaces and associated spatial data.
5.3. Sequential process design As we have seen, the tool supports three decision-making stages, expressed as ideation, discussion and planning. This is made explicit through what we designate mini-maps (see the right columns in each interface shown in Figures 6 and 7). The mini-maps serve a dual purpose: (1) allowing users selecting the workspace they interact with, which serves at the same time to specify what decisionmaking stage they wish to engage; and (2) organizing the decision-making process as a sequence of steps defined within these stages. Each step corresponds to a snapshot of the space and its visual objects done at a particular point in time. On the right side of the interfaces shown in Figure 6, we may observe several vertically aligned mini-maps, organized in three groups. The top ones are linked to the ideation workspace, while the following ones are linked respectively to the discussion and planning workspaces. The ideation mini-
17
map is shown in more detail in the interface shown at the right side of Figure 6. It is also possible to observe two vertically aligned snapshots, which were created by a user. Whenever the users interact with the workspaces, the tool logs the events and stores them in the database as a snapshot. Whenever the user activity on a workspace is suspended for a period of time, or the users move between workspaces, a new snapshot is created. The users may navigate the snapshots, maintaining this way a sequential view of their work. Figure 6 shows two users adding sketches on the map in a convergent mode (discussion workspace), although the data has not yet been synchronized by the tool, since the interface shown to the left displays a previous state. This occurs because the tool synchronizes snapshots, not individual sketches, and they take time to synchronize. Besides giving a sequential view of the users’ activities over time, the mini-maps also simplify the selection and edition of objects using snapshots. The mini-maps support vertical scrolling but do not use scrollbars to preserve space. Snapshots in a mini-map can be selected by a single touch or mouse click. The mini-maps may be hidden/shown with a menu option located at the upper-left side of the mini-map. This allows gaining space for the workspace. Figure 7, illustrates how the tool reconciles the user interface for different devices. In both cases the functionality and proportion of the menu items are the same. The gestures that may not be available in some devices are available through menu options. For instance, moving the map may be done with a gesture and also with the “arrows” icon shown at the top left of Figure 7. The same applies to the zoom functionality, which can be done both with a gesture and using the “magnifying glass” icons. The combination of mini-maps and snapshots is what integrates the decision-making process with spatial data management in the e-planning tool. In the one hand, the mini-maps differentiate the users’ goals according with the three decision-making stages. In the other hand, the activities are decomposed in successive slots of data construction.
18
Figure 7. At left, iPhone’s user interface.
At
right,
iPad’s
user
interface.
Visual objects may be copied from one workspace to another using the mini-maps. This is a critical function because it allows reusing spatial data while accomplishing different decision-making activities. Likewise data synchronization, the copy and paste operations are performed at a level of granularity that considers snapshots, not individual objects. Both the current workspace and mini-maps can serve as origins/destinations of copy/paste operations. The visual objects copied this way preserve their original geographical references. Figure 8 shows at the right an enlarged view of the iPhone’s interface. It shows four icons over the snapshots, which are used to copy and paste data into a minimap. The “create” option explicitly generates a new snapshot at the top of the mini-map. The “delete” option eliminates the selected snapshot. Therefore users may share, organize and refine their ideas and comments using mini-maps, managing data granularity with snapshots.
19
Figure 8. Left, several functions available to interact with the workspace. Right, picture shows various options for managing snapshots.
Considering again situation awareness, we observe that navigating the mini-maps supports comprehension about what activities have been performed by the users, and navigating the snapshots supports retrospective analysis and projection of those activities. The left side of Figure 8 illustrates several functions allowing users to interact with a workspace. The one in the background shows the writing function activated. The one in the foreground shows options for annotating geo-referenced visual objects. The geo-referenced visual objects created over the map may be deleted, cloned, moved or annotated with text, images and sketches. In Figure 7, at the right, an object is being annotated. Tables 3 and 4 summarize how the developed tool addresses the CSDM requirements discussed in Chapter 3 following the same schema we used for categorizing the tools reviewed in Section 4.
R1 – Sequential view R1.a – Explicit stages R1.b Sequential process design Ideation workspace The tool is organized Supports divergent according with the representation of ideas, ideation-discussionproblems and possible planning stages. solutions. This workspace is private. Although this structure is made explicit to the Discussion workspace participants, the tool Supports convergent does not enforce it. The discussion of individual participants may change plans externalized by from one stage to the participants. This another at any time.
R2 – Dynamic view R2.a – Feature R2.b - Communication classification The tool supports creating Text and sketches can be visual objects over a map. shared in the discussion and All visual objects planning workspaces. They created/modified in the can be moved/copied discussion and planning between the ideation, workspaces are shared. discussion and planning workspaces. For each space, the tool provides a mini-map. The All other types of mini-map allows grouping communication must be a set of visual objects supported with other tools according with the (e.g. voice communication).
20
workspace is shared. Planning workspace Supports convergent development of a final plan. This workspace is shared.
geographical context. Within a workspace, the users’ sequential activities are preserved with snapshots.
Table 3 – How the e-planning tool addresses the CSDM requirements (part one).
Perception The tool provides feedback about any object changes made in shared workspaces. Properties of mini-maps (color and thickness) indicate the current activity.
R3 – Continuous view Comprehension The mini-maps provide activity context. In particular, they support timelines, grouping objects according with the time of their creation.
Projection The tool supports user-interaction with the mini-maps, giving a chronological view of the activities done by the group.
Table 4 – How the e-planning tool addresses the CSDM requirements (part two).
5.4. Implementation details The tool was developed in HTML 5 to allow execution in a wide variety of physical devices, since HTML 5 is a standard supported by most popular browsers available in smartphones, tablets and laptop computers. This means that users have to contact a certain URL on a server and a Web page containing HTML tags and JavaScript will be downloaded and executed in the client. The downloaded code implements all user-interface interactions described in the previous section. The implementation uses many HTML 5 features, like the Canvas object, to implement freehand drawing, sketching and geopositioning features. This means that most of the computing work is performed in the client side. This is possible because mobile devices nowadays are powerful enough to perform the required processing and the bottleneck is frequently related with client-server communication. In order to implement data synchronization, a centralized approach was adopted. The server receives events from clients and distributes them to the other clients. It also keeps a master copy of all data changes done in a working session, which are necessary to update the clients when they join the session and also to implement snapshots. In this type of application, the server has to proactively contact the clients when new data is received. However, the simple HTTP client-server protocol does not allow servers to contact clients. The typical solution to this problem consists in having the clients constantly polling the server. In our implementation, we adopted a more recent approach supported by Google App Engine (http://code.google.com/intl/en/appengine/). Google App Engine is a cloud
21
computing service hosting web applications in Google-managed data centres. This service offers Channel API, which allows the creation of persistent connections between remote applications and Google servers, therefore allowing the server to send messages to JavaScript clients in real time. This approach also integrates well with Google Maps, which we used to deliver maps to workspaces.
Figure 9. Simplified class diagram of the e-planning client.
Most part of the developed code runs on the client browsers. A simplified class diagram of the eplanning tool is shown in Figure 9. The Client class manages all communication with the servers, which involves downloading maps from the Google Maps server and sending workspace events to the Google App Engine server. The Client receives data from the Google App Engine server when a shared workspace is modified. The Client class interacts with the Mapsketcher object, which manages data visualization. The Mapsketcher class implements the user interface. The WorkMap class contains all necessary information for managing the map displayed in the current workspace. Objects of Room class store information concerning all instantiated workspaces. There are as many Room objects as workspaces in use. Each Room object has an Overlay object, which contains the visual objects created over the map. Only one such object may be active. Mapsketcher manages that object. The most important visual objects are from the class Polyline (for sketches) and Marker (for geo-referenced objects). Finally, an object of the Project class manages the current session.
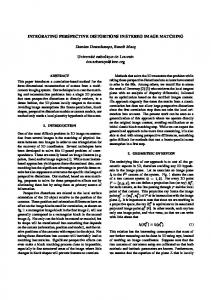
5.5. Benchmarks Since we do not have any control over the server’s performance, we wanted to make some testing on how the system responds when there is a lot of collaborative activity. This is a critical issue for a
22
system which implements real-time synchronization of workspaces and where users’ strokes, images and map locations must be shared among a large number of users in a reasonable time frame.
Response time from the server 1400 1200 1000 0,5Kb
800 Milliseconds
600
1,0Kb
400
2Kb
200
4Kb
0 0
5
10
15
20
25
30
Users
Figure 10. The graphic shows the time required for data synchronization in the e-planning tool with variable number of users and four different message sizes.
For this benchmark we set up an experiment consisting in having clients sending data every 4 seconds and using data units representing serialized sketches and markers. We varied the data size, as well as the number of clients, and we measured the elapsed time since the client sends the data to the server until it reaches the last client after being distributed by the server. In order to simplify these measurements, the distribution algorithm was set to return data to the client that originated it in the last place, after distributing it first to the other participating clients. Therefore, the time we measured was the number of milliseconds passed since the client sends the message until it receives it back. The experiments were performed for messages with sizes of 0.5, 1.0, 2.0 and 4.0 Kb. These are typical sizes for messages generated by the e-planning tool. We repeated the experiment for settings with 1 up to 25 clients. The results are shown in Figure 10. As expected, the time required for data synchronization significantly increases with the number of clients. However, it seems the message size does not affect too much the tool’s performance when the number of clients remains under 20. Moreover, fewer than 15, the response time is in any case less than a second, which seems more than acceptable for synchronizing distributed work in our collaborative setting. The literature reports that for this kind of work, groups of more than 10 people are rather
23
infrequent (Fjermestad and Hiltz 1999). We can therefore conclude that for the requirements of this research the use of Google App Engine was a good choice.
6. Synthesis and Discussion The main contribution of this work is an integrated perspective of the relationships between spatial data and decision-making support. In fact, from the revised literature we can see that most geocollaboration tools previously developed are aimed at supporting the decision-making process in various ways: in Brewer, et al. (2000), the system is aimed at building a shared understanding of environmental processes in order to make decisions about measurements to preserve the environmental balance. The work developed by Capata, Marella and Russo (Capata et al. 2008) aims to support decision making during crisis situations, while Convertino et al. (Convertino et al. 2008) was focused on emergency planning. Curwell et al. (Curwell et al. 2005) aimed at supporting urban planning. These works however are more spatial-oriented than decision-oriented. The tools developed by Jankowski et al. (1997), MacEachren et al. (2006) and Rinner et al. (2008) make the decision-making process more explicit, although they still do not support sequential process design. This work goes a step further by analysing the requirements for CSDM and proposing a conceptual model integrating decision-making processes with collaboration support and spatial data. We also present a tool developed under this perspective. In order to elaborate the conceptual model, we analyse the decision-making process from different angles and theoretical backgrounds, emphasizing the different challenges brought by sequential, dynamic and continuous decision-making. The conceptual model highlights that these three complementary views can be combined: sequential decision-making concerns process design through patterned activities; dynamic decision-making brings forward the notion that these activities involve recognition and action; and continuous decision-making highlights the importance of situation awareness in maintaining dynamic coupling. From this integrated perspective we extracted a set of critical functions for CSDM: 1) represent the problem, find alternatives and make choices, which are related with the sequential view; 2) classify and communicate, which are related with the dynamic view; and 3) perception, comprehension and projection, which setup the notion of situation awareness. All these components must interact with spatial data to support CSDM.
24
We also highlight several design requirements that developers should consider when building CSDM tools: supporting decision stages and sequential process design, supporting classification and communication of spatial data, and supporting the perception, comprehension and projection through spatial data. Perception emphasizes a cognitive view over the decision-making process. It brings forward the need to convey information in a way that stimulates decision makers to enact cognitive functions necessary for action, like identification, interpretation, selection, task definition, planning and externalization. Comprehension and projection go even further in the objective to stimulate more complex interpretations about the spatial data generated by the decision makers. Classification concerns withholding personal and organizational experiences resulting from the confrontation between events and actions, interpretations, choices, and other constructs. We conceive this requirement as the need to preserve spatial data in a coherent scaffold that promotes learning and recall. Communication brings forward the view that decision-making is a collective endeavour and knowledge must be brought from the individuals to the team. Here we highlight the need to integrate spatial data with communication-oriented data. The consideration for decision stages highlights the assumption that decision-makers should be able to manage the set of activities necessary to reach their goals. This indicates that CSDM tools should explicitly support decision stages, although avoiding prescribed procedures. In the e-planning tool, this flexible management was supported with mini-maps and snapshots. Another important contribution of this work is the support to sequential process design. Our review of the state of the art shows that existing CSDM tools lack support to sequential process design. We developed workspaces and snapshots to address this issue, considering in particular how to implement data management, which may be quite complex in a situation where spatial data must be integrated with other data types generated by collaboration technology. We believe that other tools seeking to exploit spatial data in a decision-making context can adopt such combination of workspaces and snapshots with maps and visual objects. Nevertheless, more research is necessary to understand several challenges that emerged during our research work. One challenge is related with integrating more diverse forms of communication in the tool, especially voice communication. Specific functionality must be developed to integrate voice messages in workspaces
25
and snapshots without much additional effort from the users. We have also observed in our field tests with the tool that the snapshots do not give sufficient cues that they are supporting a temporal view of the decision-making process, which is significantly different from the spatial perspective afforded by the workspaces. This may result in users developing equivocal mental modals. Only extensive experiments with the tool will allow determining if training is sufficient to overcome this problem. Another issue to consider is that the tool, although providing a sequential view of the decisionmaking process through snapshots, restricts that view to each workspace. A complete sequential view is not currently supported and further research would be necessary to understand the best way to accomplish that. We note in particular this would require improving sequential process design to help the users modelling and reflecting over their decision making process.
Acknowledgements This research was supported by the Portuguese Foundation for Science and Technology (PTDC/EIA-EIA/117058/2010). References Arias, E., H. Eden, G. Fischer, A. Gorman and E. Scharff (2000). "Transcending the individual human mind - creating shared understanding through collaborative design." ACM Transactions on Computer Human-Interaction 7(1): 84-113. Arnott, D. and G. Pervan (2005). "A critical analysis of decision support systems research." Journal of Information Technology 20(2): 67-87. Brewer, I., A. MacEachren, H. Abdo, J. Gundrum and G. Otto (2000). Collaborative geographic visualization: Enabling shared understanding of environmental processes. Proceedings of IEEE Symposium on Information Visualization, Washington, DC. Briggs, B., J. Nunamaker and D. Tobey (2001). The technology transition model: A key to selfsustaining and growing communities of gss users. Proceedings of the 34th Hawaii International Conference on System Sciences, Hawaii. Briggs, R., G. Vreede and J. Nunamaker (2003). "Collaboration engineering with thinklets to pursue sustained success with group support systems." Journal of Management Information Systems 19(4): 31-64.
26
Capata, A., A. Marella and R. Russo (2008). A geo-based application for the management of mobile actors during crisis situations. Proceedings of the 5th International ISCRAM Conference, Washington, DC. Card, S., T. Moran and A. Newell (1983). The psychology of human-computer interaction. Hillsdale, NJ, Lawrance Elrbaum. Checkland, P. and J. Poulter (2006). Learning for action: A short definitive account of soft systems methodology, and its use for practitioners, teachers and students. Chichester, UK, Wiley. Convertino, G., Z. Dejin, C. Ganoe and J. Carroll (2007). A role-based multiple view approach to distributed geo-collaboration. Proceedings of HCI International 2007 Conference, Beijing, China. Convertino, G., C. Ganoe, W. Schafer, B. Yost and J. Carroll (2005). A multiple view approach to support common ground in distributed and synchronous geo-collaboration. Proceedings of Third International Conference on Coordinated and Multiple Views in Exploratory Visualization, London, UK, IEEE Computer Society. Convertino, G., H. Mentis, P. Bhambare, C. Ferro, J. Carroll and M. Rosson (2008). Comparing media in emergency planning. Proceedings of the 5th International ISCRAM Conference, Washington, DC. Curwell, S., M. Deakin, I. Cooper, K. Paskaleva-Shapira, J. Ravetz and D. Babicki (2005). "Citizens' expectations of information cities: Implications for urban planning and design." Building Research and Information 33(1): 55-66. Endsley, M., B. Bolté and D. Jones (2003). Designing for situation awareness. London, Taylor & Francis. Fishburn, P. (1981). "Subjective expected utility: A review of normative theories." Theory and Decision 13(2): 139-199. Fisher, D. and P. Dourish (2004). Social and temporal structures in everyday collaboration. Proceedings of the SIGCHI Conference on Human Factors in Computing Systems, Vienna, Austria, ACM Press. Fjermestad, J. and S. Hiltz (1999). "An assessment of group support systems experimental research: Methodology and results." Journal of Management Information Systems 15(3): 7-149.
27
Gray, P. and M. Mandiwalla (1999). "New directions for gdss." Group Decision and Negotiation 8: 7783. Hollnagel, E. and D. Woods (2005). Joint cognitive systems: Foundations of cognitive systems engineering. Boca Raton, FL, CRC Press. Jankowski, P. (2009). "Towards participatory geographic information systems for community-based environmental decision making." Journal of Environmental Management 90(6): 1966-1971. Jankowski, P., T. Nyerges, A. Smith, T. Moore and E. Horvath (1997). "Spatial group choice: A sdss tool for collaborative spatial decision-making." International Journal of Geographical Information Science 11(6): 577-602. Kaner, S. (1996). Facilitator's guide to participatory decision-making. Philadelphia, PA, New Society Publishers. Klein, G. (2008). "Naturalistic decision making." Human Factors 50(3): 456-460. Kolfschoten, G. and G. de Vreede (2009). "A design approach for collaboration processes: A multimethod design science study in collaboration engineering." Journal of Management Information Systems 26(1): 225-256. Kolfschoten, G., G. Duivenvoorde, R. Briggs and G. de Vreede (2009). Practitioners vs facilitators a comparison of participant perceptions on success. Proceedings of the 42nd Hawaii International Conference on System Sciences, Hawaii, IEEE. MacEachren, A. (2005). Moving geovisualization toward support for group work. Exploring geovisualization. J. Dykes, A. MacEachren and M. Kraak, Elsevier: 445-462. MacEachren, A. and I. Brewer (2004). "Developing a conceptual framework for visually-enabled geocollaboration." International Journal of Geographical Information Science 18(1): 1-34. MacEachren, A., G. Cai, R. Sharma, I. Rauschert, I. Brewer, L. Bolelli, B. Shaparenko, S. Fuhrmann and H. Wang (2005). "Enabling collaborative geoinformation access and decision-making through a natural, multimodal interface." International Journal of Geographical Information Science 19: 293-317. MacEachren, A., C. Guiray, I. Brewer and J. Chen (2006). "Supporting map-based geocollaboration through natural interfaces to large-screen displays." Cartographic Perspectives 54: 4-22. Mendonça, D. and B. Wallace (2004). "Studying organizationally-situated improvisation in response to extreme events." INternational JOurnal of Mass Emergencies and Disasters 22: 5-30.
28
Munkvold, B. and R. Anson (2001). Organizational adoption and diffusion of electronic meeting systems: A case study. Proceedings of the 2001 International ACM SIGGROUP Conference on Supporting Group Work, Boulder, Colorado, ACM. Ramsey, F. (1931). Truth and probability. The foundations of mathematics and other logial essays. F. Ramsey. New York, Harcourt, Brace & Co. Rinner, C. (2006). Argumentation mapping in collaborative spatial decision making. Collaborative geographic information systems. S. Balram and S. Dragićević. Hershey, PA, Idea Group Publishing Rinner, C., K. Keßler and S. Andrulis (2008). "The use of web 2.0 concepts to support deliberation in spatial decision-making." Computers, Environment and Urban Systems 32(5): 386-395. Saaty, T. (2008). "Decision making with the analytic hierarchy process." International Journal of Services Sciences 1(1): 83-98. Simon, H. (1987). "Decision making and problem solving." INTERFACES 17(5): 11-31. Simon, H. (1997). Administrative behavior: A study of decision-making processes in administrative organizations (4th edition). New York, Free Press. Stevens, D., S. Dragicevic and K. Rothley (2007). "Icity: A gis–ca modelling tool for urban planning and decision making." Environmental Modelling & Software 22(6): 761-773. Stroebe, W., M. Diehl and G. Abakoumkin (1992). "The illusion of group effectivity." Personality & social psychology bulletin 18(5): 643. Uran, O. and R. Janssen (2003). "Why are spatial decision support systems not used? Some experiences from the netherlands." Computers, Environment and Urban Systems 27: 511-526. Weick, K. (2001). Making sense of the organization. Oxford, UK, Blackwell. Weick, K., K. Sutcliffe and D. Obsfeld (2005). "Organizing and the process of sensemaking." Organization Science 16(4): 409-421. Wong, S. (1994). "Preference-based decision making for cooperative knowledge-based systems." ACM transactions on information systems 12(4): 407-435. Yamanaka, K. and M. Kawakami (2011). Proposal model of human behavior by visual information processing mechanism for reliability-based system design. 2011 International Conference on Biometrics and Kansei Engineering (ICBAKE), Takamatsu, Kagawa, IEEE Press.
29
Zurita, G., P. Antunes, N. Baloian, F. Baytelman and A. Farias (2008). Visually-driven decision making using handheld devices. Collaborative decison making: Prospectives and challenges. P. Zaraté, J. Belaud, G. Camilleri and F. Ravat. Amsterdam, The Netherlands, IOS Press: 257269.
30