1993; Cleasby and others, 2000; Kimball and others, 1994; Kimball and ...... Baes, C.F., Jr., and Mesmer, R.E., 1976, The hydrolysis of cations: New York, John.
INTEGRATING HYDROLOGIC AND GEOLOGIC CONTROLS ON METAL LOADING TO STREAMS: MASS-LOADING ANALYSIS OF MINERAL CREEK, COLORADO. By Briant A. Kimball1, Robert L. Runkel2, Katherine Walton-Day2, and Dana J. Bove3 1
U.S. Geological Survey, 2329 W Orton Cir, West Valley City, UT 84119 U.S. Geological Survey, Box 25046, MS 415, Denver, CO 80225 3 U.S. Geological Survey, Box 25046, MS 973, Denver, CO 80225 2
ABSTRACT Stakeholders, including land-management agencies, often are faced with choosing cost-effective remediation of abandoned and inactive mines located in environmentally sensitive mountain watersheds. Remediation decisions require knowledge of the most significant sources of metals to streams and important instream processes that affect instream metal concentrations. The significance of a given source not only depends upon the concentrations of a toxic metal, but also on the total mass, or load of metal added to the stream. To determine loads, a tracer-injection to measure discharge is combined with a detailed spatial sampling of the stream and inflows to produce a mass-loading profile. A mass-loading profile meets many of the information requirements for making decisions. It allows comparison of sources, indicates where ground-water sources occur, and indicates the extent of instream physical and chemical processes. This approach is illustrated with an analysis of zinc and aluminum loading in Mineral Creek, Colorado. Along the 15-kilometer study reach, 93 kilograms per day of zinc were added to Mineral Creek. Less than half of this load came from well-defined areas that included both mined and non-mined parts of the watershed. More than half of the load came from many dispersed, subsurface inflows, which contribute a substantial load that could limit the effectiveness of remediation. The load profile of aluminum indicated dynamic transformations between dissolved and colloidal phases. Mass-loading analysis quantified the extent of physical mixing and chemical reaction in two important mixing zones, indicating which process was dominant under given conditions during transport. The mass-loading approach provides a tool for detailed watershed evaluation of metal loading and instream processes to support remediation decisions.
INTRODUCTION Mass-loading studies have been used to provide a watershed context for the quantification of constituent loads in many hydrologic settings (Broshears and others, 1993; Cleasby and others, 2000; Kimball and others, 1994; Kimball and others, 1999a; Kimball and others, 2001; Kimball and others, 2002). These studies also provide streamreach scale quantification of ground-water inflows and instream chemical processes (Kimball and others, 2002). The purpose of this paper is to illustrate the utility of mass1
2
loading studies with selected examples from Mineral Creek, Colorado (fig. 1). A detailed report of the study in Mineral Creek is in preparation, but some of the data have been used for reactive solute-transport modeling of remediation alternatives (Runkel and Kimball, 2002). Mineral Creek originates near Red Mountain Pass in the San Juan Mountains of southwest Colorado at an elevation of more than 10,000 feet above sea level. Mineral Creek discharges to the Animas River, near Silverton, Colorado. Over most of the 15,000-meter (m) study reach, Mineral Creek has a steep gradient with cobble and boulder bed material. The area is within the collapsed Silverton caldera, and there are several different alteration types that crop out in the watershed (Bove and others, 2000). There is regional propylitic alteration, but the types that are most prominent include a quartz-sericite-pyrite (QSP) type, an acid sulfate (AS) type, and a weak sericitic type.
METHODS Mass-loading studies have been applied to mine drainage research as part of the U.S. Geological Survey Toxic Substances Hydrology Program to investigate loadings (Kimball and others, 1994, 1999b, 2001, 2002; Kimball, 1997; Cleasby and others, 2000). The approach includes a tracer-injection to define stream discharge and other hydrologic characteristics (Bencala and others, 1990), coupled with synoptic sampling to provide a detailed chemical characterization of the stream and its inflows along the study reach (Bencala and McKnight, 1987). The combination of detailed discharge and the chemical data provides a profile of mass loading along the study reach, allowing a comparison of loading among sources in the watershed. Because a conservative tracer is diluted by any inflow to the stream between each pair of stream sites, this method also addresses the quantification of both surface- and ground-water inflow to a stream. Tracer Injections The tracer-injection study began with a careful evaluation of all visible inflows to the study reach, which was accomplished by walking the entire study reach from Red Mountain Pass to the U.S. Geological Survey gaging station near the mouth (fig. 1). Sampling sites for the synoptic study are referenced in the report by the measured distance along the study reach and a few key locations are indicated by letters A through D on figure 1. Because of the substantial length of the study reach, the stream was divided into three separate injection reaches. The upper injection reach was 3,428 m long, the middle reach was 6,994 m long, and the lower reach was 5,248 m long (fig. 1). Precision metering pumps were used to inject the tracer to maintain a constant rate. No adverse effects were observed from the injection of the tracer solution. Lithium bromide was selected for the tracer injection solution. The combination of lithium and bromide was considered a good tracer pair because of the variable pH of the stream and the lack of geologic sources of lithium and bromide in the watershed. Lithium is a conservative tracer at pH less than about 5 and bromide is conservative at pH greater than about 5. Over most of the study reach the mole balance of lithium and bromide was equal. 3
A continuously injected chemical tracer provides a way to measure discharge that includes the hyporheic flow of the stream because the tracer follows the water as it moves in and out of the streambed. During base-flow conditions, tracer dilution allows the detection of increases in streamflow of only a few percent. Once the tracer reaches a steady concentration at each point along the stream, called the plateau condition, discharge can be calculated at any point. During the tracer plateau, numerous samples along the stream provide a synoptic sampling. Each stream sample has a measured discharge because of the tracer concentration in the synoptic sample. Stream samples were collected by integrating methods (Ward and Harr, 1990). Concentrations of bromide in stream environments are typically low, with preinjection concentrations at or near the lower detection limits. Also, the spatial variability in background concentrations is small, such that background concentrations are nominally uniform. Given the assumption of uniform background concentrations, stream discharge at any location downstream from the injection is given by: QD = where QD
QINJ C INJ CD − CB
(1)
=
stream discharge, in L/s,
QINJ
=
the injection rate, in L/s,
CINJ
=
the injectate concentration, in milligrams per liter (mg/L),
CD
=
the tracer concentration at plateau, in mg/L, and
CB
=
the naturally occurring background concentration, in mg/L.
Tracer dilution accounts for visible inflows, such as tributaries and springs, as well as dispersed, subsurface inflow. To divide the total inflow into surface- and ground-water components would require a secondary measurement of the inflow. Synoptic Sampling and Chemical Analysis Synoptic sampling gives a spatially intensive "snapshot" of chemistry and discharge to quantify instream loads. Reach-scale information is available for changes that occur between each pair of stream sites, which we call a stream segment. Stream segments capture both visible tributary inflow and dispersed, subsurface inflow to the stream. Some stream segments have sampled inflows and others are without sampled inflows, but both quantify the total change in load due to distinct or dispersed inflows. Three operationally defined concentrations were obtained for each metal from the synoptic stream samples. An unfiltered sample provides a measure of the totalrecoverable metal concentration (dissolved + colloidal). Tangential-flow ultrafiltration, using 10,000-Dalton molecular weight filters, provides a dissolved-metal concentration. Tangential-flow filtration, using a 0.45-micrometer (µm) filter, provides a comparison of the ultrafiltration to aquatic standards that are written for 0.45-µm filtration, and provides the “dissolved” concentration for most inflow samples. Colloidal-metal concentrations are defined as the difference between the total-recoverable and the ultrafiltrate metal concentrations for stream samples (Kimball and others, 1995). 4
All metal concentrations were determined by inductively coupled plasma-atomic emission spectrometry. Anion concentrations were determined from 0.45-µm filtered samples using ion chromatography (Kimball and others, 1999a). Total alkalinity was determined by titration in the laboratory. Temperature, pH, and specific conductance were determined in the field. Determination of loads The solute load at each stream site can be quantified by multiplying the discharge and the solute concentration. When this calculation is made for each stream site, it provides a longitudinal profile of the sampled instream load. A change in load for a stream segment is determined by subtracting the upstream load from the downstream load for a pair of stream sites. A positive difference indicates a gain in solute load and implies that there is a source of the solute between the two stream sites. A negative difference indicates a net removal of the solute load from the stream. However, a net-negative value does not eliminate the possibility that there could be a source within that particular stream segment. Summing all the positive values of change along the study reach generates a cumulative instream load. This is the best estimate of the total solute load added to the stream along the study reach, even though it is a minimum estimate because it is based on net loadings for its calculation. Because tracer dilution accounts for the change in discharge between stream sites, there is a second approach to calculating loads. The change in discharge between two stream sites, multiplied by the total-recoverable solute concentration for a sampled inflow gives an estimate of the total inflow load for a stream segment. A cumulative sum of inflow load along the study reach indicates how well the sampled inflows account for the load measured in the stream. If we could obtain a representative inflow concentration for each segment, then the cumulative instream and cumulative inflow profiles would be equal. Sampled inflows are chosen to be representative of all the inflows along the study reach, but it is not possible to sample every surface inflow. Nor is it possible to sample all the dispersed, subsurface inflow along the study reach.
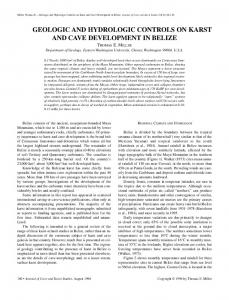
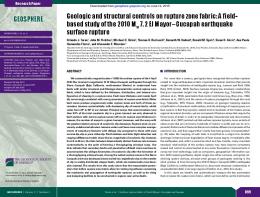
RESULTS Synoptic sampling for all three injection reaches consisted of 86 stream segments and 65 inflow sites. This discussion will focus on the variation of the bromide tracer, pH, aluminum, and zinc. Discharge The variation of bromide along the study reach for all three injections and the calculated discharge are shown in figure 2. For each injection, the bromide tracer provided a clear bromide signal that was elevated above background concentrations, which were consistently were less than detection (fig. 2). With a uniform background concentration, it was possible to use equation 1 to calculate discharge. The increase in discharge along the study reach was 3,255 liters per second (L/s); of which 548 L/s 5
Stream bromide Inflow bromide Stream discharge Inflow discharge
11,458 m (Zuni Creek)
13,103 m (Bear Creek, Columbine Mine)
South Fork (D) 10,943 m
Middle Fork (C) 6,981 m
Mill Creek 3,530 m
Big Horn Gulch (B) 2,396 m
3,000
2,500
2,000
1,500
1,000
DISCHARGE, IN LITERS PER SECOND
1
Mineral Creek 888 m
10
Longfellow-Koehler (A) 226 m
BROMIDE CONCENTRATION, IN MILLIGRAMS PER LITER
100
0.1 500
0
0.01 0
2,000
4,000
6,000
8,000
10,000
12,000
14,000
16,000
DISTANCE, IN METERS ALONG THE STUDY REACH
Figure 2. Variation of injected bromide concentration and calculated discharge with distance, Mineral Creek, Colorado, September 1999.
occurred in segments with no sampled inflows. This indicates that a minimum of 17 percent of the total increase in discharge that might be directly attributed to ground water. The five largest inflows account for about 77 percent of the increase in flow: South Fork (1,320 L/s), Middle Fork (512 L/s), the segment ending at 11,458 m that includes Zuni Creek (294 L/s), Mill Creek (232 L/s), and the inflow near the end of the study reach at 13,103 m (136 L/s) that includes Bear Creek.
6
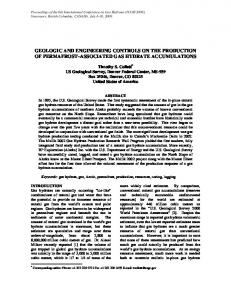
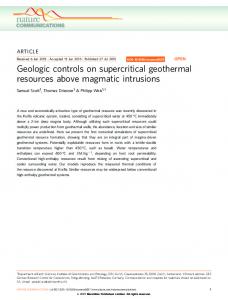
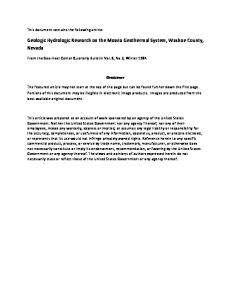
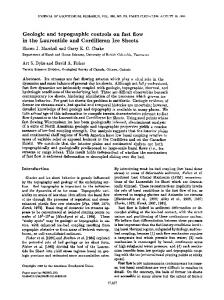
Characterization of synoptic chemistry Synoptic sampling of inflows gives a context for understanding loadings and instream chemical reactions. In a watershed affected by many natural processes and anthropogenic activities, inflows can range from acidic to alkaline and from dilute to saline. All the different types of inflows can affect stream chemistry. Variation of pH along the Mineral Creek study reach reflects a great diversity among inflows (fig. 3). Note the great number of samples collected for this synoptic study. Such detailed spatial sampling allows for adequate characterization of possible sources and for understanding the details of instream processes. Among inflow samples, the pH ranges from 2.43 to 7.70. Instream pH varies from 2.84 to 6.89 in response to the inflows. There are a few abrupt changes in pH, where the pH crosses a value of 5.25. These changes occur (A) downstream from the inflow of the Longfellow-Koehler discharge (226 m), (B) downstream from Big Horn Gulch (2,396 m), (C) downstream from the Middle Fork (6,981 m), and (D) downstream from South Fork (10,943 m). Variation of aluminum concentration, both dissolved and colloidal, shows a pattern similar to pH (fig. 4). The graph shows total-recoverable aluminum divided into the amounts that were dissolved and colloidal. A great increase in dissolved-aluminum concentration occurs downstream from the Longfellow-Koehler drainage (A). Downstream from Big Horn Gulch (B), the concentration is much lower, and most of the aluminum is colloidal rather than dissolved. Downstream from the Middle Fork (C) both dissolved and colloidal aluminum concentrations increase substantially and are almost equal; dissolved-aluminum concentration is about 2 mg/L and colloidal concentration is about 1.7 mg/L for a total just under 4 mg/L. Finally, downstream from South Fork (D), the aluminum concentrations are diluted and all the aluminum is essentially colloidal. The transformations between dissolved and colloidal aluminum correspond to changes in pH (fig. 5). At low pH, the colloidal aluminum fraction is smallest. Samples downstream from the Longfellow-Koehler drainage (A) have a colloidal fraction ranging from about 0 to 0.28. Samples downstream from the Middle Fork (C) to South Fork (D)have a greater colloidal fraction, but the pH is generally higher. In fact, the pH is in the range of transition between the two phases (Bigham and Nordstrom, 2000). Samples with a higher pH downstream from Big Horn Gulch (B) and downstream from South Fork (D), have a much greater colloidal fraction, ranging from about .76 to .99. All the samples downstream from South Fork are mostly colloidal, with a fraction greater than 0.95.
7
8
Stream Inflows
7
6
South Fork (D)
Middle Fork (C)
4
Big Horn Gulch (B)
5 Longfellow-Koehler (A)
pH, IN STANDARD UNITS
pH 5.25 break
3
2 0
2,000
4,000
6,000
8,000
10,000
12,000
14,000
16,000
DISTANCE, IN METERS ALONG THE STUDY REACH
Figure 3. Variation of pH with distance, Mineral Creek, Colorado, September 1999.
The presence of colloids has important implications for understanding the dissolved concentrations of metals. Ultrafiltration has been used to obtain more truly dissolved concentrations (Kimball and others, 1992b). When colloidal solids, mostly aluminum and iron oxyhydroxides, form downstream from mine drainage, the initial particles are very small, on the order of 1-nanometer spherules (Ranville and others, 1989; Grundl and Delwiche, 1993). These particles rapidly aggregate and form a continuous range of particle aggregates, ranging in size from 1 nanometer to greater than 1 µm (Buffle and Leppard, 1995). Filtration through a 0.45-µm filter will likely include 8
some of this colloidal material. As 0.45-µm filtered samples are acidified for preservation, the fraction of colloidal aluminum (or iron) that has passed through the filter dissolves and is measured as “dissolved” iron rather than as colloidal. This sampling artifact can be much greater during runoff when particles are flushed into the stream (Church and others, 1997). The operational artifact would result in reporting of higher concentrations of dissolved aluminum, iron, and possibly other metals; and may result in reported concentrations that exceed aquatic standards, but may actually be below standards. The artifact may also lead to erroneous thermodynamic calculations of mineral saturation. The pattern of zinc concentration differs substantially from that of aluminum. Zinc concentrations consistently decrease downstream from Big Horn Gulch (B) and there is a lack of colloidal zinc (fig. 6). The high zinc concentrations downstream from the Longfellow-Koehler drainage (A), and other locations that are all upstream from Big Horn Gulch (B), indicate that the principal sources of zinc are in that section of the study reach. The lack of colloidal zinc relates to the distinct chemical behavior of zinc compared to aluminum. Aluminum hydrolyzes at a much lower pH than zinc. Lindsay (1979) provides a summary of hydrolysis constants for these and other metals. The first hydrolysis constant for aluminum has a pK1 of 5.02, while for zinc it is 7.69. Thus, the transformation to colloidal aluminum begins at a pH near 5.02, but for zinc the transformation would not begin until a pH near 7.7. The difference in chemical behavior, however, is more complex than suggested by the pK values. Aluminum tends to form polynuclear species at the lower pH, and these rapidly aggregate to colloidal particles greater than 10,000 Daltons (Da) (May, 1992; Kimball and others, 1992a). Zinc is less likely to form polynuclear species (Baes and Mesmer, 1976). When colloidal zinc occurs, it is more likely present as a sorbed species on iron colloidal material (Smith, 1999).
1
pK is mathematically analogous to pH; it is the negative logarithm of the dissociation constant.
9
Longfellow-Koehler (A)
17
15 14
12
4.0
3.5
South Fork (D)
3.0
2.5
2.0
Big Horn Gulch (B)
TOTAL ALUMINUM CONCENTRATION, IN MILLIGRAMS PER LITER
13
Dissolved Colloidal
Middle Fork (C)
16
1.5
1.0
0.5
0
2,000
4,000
6,000
8,000
10,000
12,000
DISTANCE, IN METERS ALONG THE STUDY REACH
Figure 4. Variation of total aluminum concentrations with distance, Mineral Creek, Colorado, September 1999. Total aluminum concentration is divided between the portions of dissolved- and colloidal-aluminum.
10
14,000
1.0
Downstream from Longfellow-Koehler (A) Downstream from Big Horn Gulch (B) Downstream from Middle Fork (C) Downstream from South Fork (D)
COLLOIDAL ALUMINUM FRACTION
0.8
0.6
0.4
0.2
0.0
3
4
5
6
7
pH, IN STANDARD UNITS
Figure 5. Variation of colloidal aluminum fraction with pH, Mineral Creek, Colorado, September 1999.
DETERMINING SOURCES: MASS-LOADING PROFILES Changes in chemical composition of stream samples must be evaluated in the context of solute loading to determine which inflows – sampled or unsampled – have the greatest affect on the stream. The mass-loading profile of zinc provides an example of how a mass-loading analysis helps to evaluate sources in a watershed (fig. 7). The first noticeable distinction between zinc concentration and zinc load is the increase in load downstream from Big Horn Gulch, in the area where concentration decreased (fig. 6). This shows the importance of establishing the hydrologic context to evaluate metal loads
11
because several of the significant loads downstream from Big Horn Gulch could have been missed in remediation planning if only concentrations were considered.
Longfellow-Koehler (A)
40 30
4.0
3.5
Big Horn Gulch (B)
3.0
2.5
2.0
1.5
1.0
South Fork (D)
Middle Fork (C)
TOTAL ZINC CONCENTRATION, IN MILLIGRAMS PER LITER
20
Dissolved Colloidal
0.5
0
2,000
4,000
6,000
8,000
10,000
12,000
DISTANCE, IN METERS ALONG THE STUDY REACH
Figure 6. Variation of total zinc concentration with distance, Mineral Creek, Colorado, September 1999. Total zinc concentration is divided between the portions of dissolved- and colloidal-zinc.
12
14,000
Below Columbine mine
South Fork (D)
Middle Fork (C)
Brown's Gulch
Porphory Gulch Big Horn Gulch (B)
40
Below Mineral Creek
60
A
Dissolved instream load Colloidal instream load Total instream load Cumulative instream load Cumulative inflow load
80 Longfellow-Koehler drain (A)
ZINC LOAD, IN KILOGRAMS PER DAY
100
20
0 0
6,000
9,000
12,000
15,000
B
226 m (A)
20
Surface-water inflow Unsampled inflow Loss
13,103 m
14,575 m
11,883 m 9,298 m
8,093 m
6,981 m (C) 6,450 m
5
1,676 m 1,989 m
10
5,406 m
15
656 m 976 m 1,194 m
CHANGE IN LOAD, IN KILOGRAMS PER DAY
3,000
0
-5
0
3,000
6,000
9,000
12,000
DISTANCE, IN METERS ALONG THE STUDY REACH
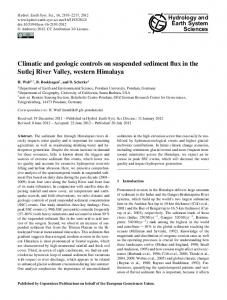
Figure 7. Variation of (A) zinc load with distance and (B) change in load for individual stream segments, Mineral Creek, Colorado, September 1999.
13
15,000
This method of illustrating loads distinguishes between sampled and unsampled loads. This distinction also is important for remediation planning because it can indicate the difficulty of identifying easily treatable sources. For example, the increase in load at the Longfellow-Koehler drainage (A) is a sampled inflow. Given an adequate remediation technology and funding, that source could be treated. However, other sources downstream from there, for example the sources at 656 m, 976 m, 1,989 m, 8,093 m, and 9,298 m (fig. 7B), are dispersed, subsurface inflows that are unsampled and could be much more difficult and expensive to gather and treat for remediation. Thus, the massloading information can guide remediation planning. Sources of zinc mass loading are closely related to the geology of the watershed. Those sources upstream from the site at 1,989 m are all related to the alteration near Red Mountain Pass, which includes both QSP and AS types (Bove and others, 2000). Of course, some of this alteration rock has been mined, and includes the Longfellow-Koehler drainage and the Carbon Lakes drainage (1,194 m). The sources from 6,450 m to 9,298 m are all associated with the Mt. Moly QSP-type deposit. Sources from 11,838 m to 14,575 m result from the Anvil Mountain drainage, which is an AS-type alteration.
INSTREAM PROCESSES: QUANTIFYING REACTIONS The mass-loading profile of aluminum provides information to quantify instream chemical reactions. At a pH of 5.02, which is the pK of the first hydrolysis reaction of aluminum, the total aluminum concentration predominantly consists of Al 3+ and Al (OH )2+ species, which are equal in concentration and are related by the reaction: Al 3+ + H 2O !
Al (OH )2+ + H + .
(2)
At a pH less than 5.02, Al 3+ predominates as dissolved aluminum. At a pH greater than 5.02, Al (OH )2+ predominates and most likely favors the formation of a colloidal-aluminum solid. If we represent the colloidal aluminum as Al (OH ) 3,coll , the transition between dissolved and colloidal aluminum essentially becomes:
Al 3+ + 3H 2O !
Al (OH )3,coll + 3H + .
(3)
This reaction implies that all the Al (OH )2+ that forms is used in the formation of colloidal aluminum. As suggested by the variations in dissolved- and colloidal-aluminum concentrations (fig. 6), this reaction is reversible. From the mass-loading, we can quantify the extent of this reaction at key locations along the study reach. Two confluences of particular interest are with the Middle Fork (C) and with the South Fork (D) (fig. 8). The most striking features of the aluminum mass-loading profile are the dominance of the source from the Middle Fork (C) and the dynamic changes in the loads of dissolved and colloidal loads. The greatest loading of aluminum occurs at the Middle Fork (C, fig. 8B). Upstream from the Middle Fork, total aluminum load is predominated by colloidal aluminum (fig. 9A). Middle Fork, however, is dominated by dissolved aluminum. When these two loads are combined, we can compare the sum of the loads to the sampled loads downstream from Middle Fork. For the Middle Fork, the 14
300
100
Brown's Gulch
200
South Fork (D)
Middle Fork (C)
400
Longfellow-Koehler drain (A)
ALUMINUM LOAD, IN KILOGRAMS PER DAY
A Dissolved instream load Colloidal instream load Total instream load Cumulative instream load Cumulative inflow load
500
0 0
3,000
6,000
9,000
12,000
15,000
14.033 m
9,298 m
100
6,350 m
200
13,103 m
6,981 m Middle Fork (C)
Surface-water inflow Unsampled inflow Loss
300
5,406 m
CHANGE IN LOAD, IN KILOGRAMS PER DAY
B
0
-100
-200 0
3,000
6,000
9,000
12,000
15,000
DISTANCE, IN METERS ALONG THE STUDY REACH
Figure 8. Variation of (A) aluminum load with distance and (B) change in load for individual stream segments, Mineral Creek, Colorado, September 1999.
15
calculated sum is essentially the same as the sampled distribution of dissolved and colloidal aluminum (about 5 percent, which is less than the calculated load error of 6 percent at that point along the study reach). Thus, downstream from the Middle Fork, we observe the result of mixing the two sources; any chemical reactions that occur are not detectable with our precision.
A
ALUMINUM LOAD, IN KILOGRAMS PER DAY
400
Colloidal Dissolved 300
200
100
0
Upstream
Middle Fork
Sum of upstream and Middle Fork
500
Sampled downstream load B
ALUMINUM LOAD, IN KILOGRAMS PER DAY
400
Colloidal Dissolved
300
200
100
0
Upstream
South Fork
Sum of upstream and South Fork
Sampled downstream load
Figure 9. Mass transfer of dissolved and colloidal aluminum reactions at (A) Middle Fork confluence and (B) South Fork, Mineral Creek, Colorado, September 1999.
16
Returning to figure 5, showing the colloidal fraction of aluminum, the group of samples from the Middle Fork to the South Fork are separate from all the other samples. The samples range from a colloidal fraction of 0.4 to 0.5. It is likely that this group remains in this range of dissolved fraction because the average pH of the stream in that location is 4.87, close to the crossover value of 5.02. Thus, it is possible that there is a dynamic equilibrium between the dissolved and colloidal fractions and there is no net change along this stream reach. A different scenario occurs at the confluence with the South Fork (figs. 8A, 9B). Upstream from the South Fork, the dissolved aluminum load is slightly greater than the colloidal load; the pH upstream from the confluence was 4.87. The South Fork, although the load was much smaller, was about equally split between dissolved and colloidal aluminum; the pH of the South Fork was 7.20. The sum of these two loads would result in little change in the dissolved to colloidal ratio. This would simulate the result of mixing without any reaction. However, the sampled load downstream from the South Fork was 99 percent colloidal, indicating a nearly complete transition to colloidal aluminum. The total aluminum load upstream and downstream of the South Fork was not significantly different, indicating that this transformation to colloidal aluminum was a process that occurred completely in the water column. It is also important that this reaction occurred within the time frame of transport through the stream segment, which would be on the order of seconds to minutes. This agrees with observations in the mixing zone downstream from Cement Creek, near Silverton (Schemel and others, 2000).
SUMMARY A series of three tracer injections quantified changes in discharge along a 15kilometer study reach of Mineral Creek, Colorado, in September 1999. Detailed spatial sampling of the stream and inflows along the study reach, along with the tracer discharge, are combined for a mass-loading profile that provides information for 86 stream segments. The mass-loading profile indicates that there were significant increases in zinc load in 21 of those segments. Six of these included inflows that can be attributed to mine drainage; these accounted for about 42 percent of the cumulative instream load of zinc along the study reach. The other 15 of the 21 gaining segments contributed 58 percent of the zinc load and likely represent weathering of altered bedrock. Unsampled inflow of zinc corresponds to occurrences of important alteration types. Aluminum mass loading identifies the extent of physical and chemical processes in the watershed. Downstream from the confluence with the Middle Fork, it appears that colloidal aluminum was transformed to dissolved aluminum. Instead, mass loading indicates that the downstream ratios of dissolved to colloidal aluminum can be explained by physical mixing. Reaction does occur, however, downstream from the confluence with the South Fork. Because the pH is substantially higher after mixing, essentially all the aluminum was transformed to the colloidal phase. These examples from Mineral Creek indicate the utility of mass-loading profiles in understanding the relative importance of different metal sources in a watershed. The studies also help to quantify and understand important instream processes. This 17
information is needed to make better science-based decisions about remediation of metals in watersheds.
ACKNOWLEDGEMENTS This work was done as part of the U.S. Geological Survey Toxic Substances Hydrology Program. Several members of the Animas River Stakeholder Group helped with the fieldwork. The mass-loading study in Mineral Creek was funded by the Bureau of Land Management as part of its Abandoned Mine Lands Program.
REFERENCES CITED Baes, C.F., Jr., and Mesmer, R.E., 1976, The hydrolysis of cations: New York, John Wiley & Sons, 489 p. Bencala, K.E., and McKnight, D.M., 1987, Identifying in-stream variability: Sampling iron in an acidic stream, in Averett, R.C. and McKnight, D.M. eds., Chemical Quality of Water and the Hydrologic Cycle: Chelsea, Michigan, Lewis Publishers, Inc., p 255-269. Bencala, K.E., McKnight, D.M., and Zellweger, G.W., 1990, Characterization of Transport in an Acidic and Metal-rich Mountain Stream Based on a Lithium Tracer Injection and Simulations of Transient Storage: Water Res. Res., v. 26, p. 989-1000. Bigham, J.M., and Nordstrom, D.K., 2000, Iron and aluminum hydroxysulfates from acid sulfate waters, in, Alpers, C.N., Jambor, J.L., and Nordstrom, D.K., eds., Sulfate minerals – crystallography, geochemistry, and environmental significance: Washington, D.C., Mineral Society of America, Reviews in Mineralogy and Geochemistry, v. 40, p. 351-403. Bove, D.J., Mast, M.A., Wright, W.G., Verplanck, P.L., Meeker, G.P., and Yager, D.B., 2000, Geologic control on acidic and metal-rich waters in the southeast Red Mountains area, near Silverton, Colorado: Society for Mining, Metallurgy, and Exploration, Inc., Proceedings from the fifth international conference on acid rock drainage, May 13-15, 2000, Denver, Colorado, p. 523-533. Broshears, R.E., Bencala, K.E., Kimball, B.A., and McKnight, D.M., 1993, Tracerdilution experiments and solute transport simulations for a mountain stream, Saint Kevin Gulch, Colorado: U.S. Geological Survey Water-Resources Investigations Report 92-4081, 18 p. Buffle, J., and Leppard, G.G., 1995, Characterization of Aquatic Colloids and Macromolecules. 1. Structure and Behavior of Colloidal Material: Environmental Science & Technology, v. 29, no. 9, p. 2169-2175. Church, S.E., Kimball, B.A., Fey, D.L., Ferderer, D.A., Yager, T.J., and Vaughn, R.B., 1997, Source, Transport, and Partitioning of Metals between Water, Colloids, and Bed Sediments of the Animas River, Colorado: U.S. Geological Survey Open-File Report 97-151, 135 p. 18
Cleasby, T.E., Nimick, D.A., and Kimball, B.A., 2000, Quantification of metal loads by tracer-injection and synoptic sampling methods in Cataract Creek, Jefferson County, Montana, August 1997: U.S. Geological Survey Water-Resources Investigations Report 00-4237, 39 p. Grundl, T., and Delwiche, J., 1993, Kinetics of ferric oxyhydroxide precipitation: Journal of Contaminant Hydrology, v. 14, p. 71-97. Kimball, B.A. 1997. Use of tracer injections and synoptic sampling to measure metal loading from acid mine drainage. U.S. Geological Survey Fact Sheet FS-245-96. 1997, at URL http://wwwdutslc.wr.usgs.gov/usgsabout/fs245/245.html Kimball, B.A., Broshears, R.E., Bencala, K.E., and McKnight, D.M, 1994. Coupling of hydrologic transport and chemical reactions in a stream affected by acid mine drainage: Environmental Science & Technology, v. 28, p. 2065-2073. Kimball, B.A., Callender, E., and Axtmann, E.V., 1995, Effects of Colloids on Metal Transport in a River Receiving Acid Mine Drainage, Upper Arkansas River, Colorado, U.S.A.: Applied Geochemistry, v. 10, p. 285-306. Kimball, B.A., McKnight, D.M., Broshears, R.E., and Bencala, K.E., 1992a, Effect of instream pH modification on aluminum, in Kharaka, Y.K. and Maest, A.S., eds., Water-Rock Interaction, Volume 1, Low Temperature Environments: Rotterdam, A.A. Balkema, p. 393-396. Kimball, B.A., McKnight, D.M., Wetherbee, G.A., and Harnish, R.A., 1992b, Mechanisms of iron photoreduction in a metal-rich, acidic stream (St. Kevin, Gulch, Colorado, U.S.A.): Chemical Geology, v. 96, p. 227-239. Kimball, B.A., Nimick, D.A., Gerner, L.J., and Runkel, R.L., 1999a, Quantification of metal loading in Fisher Creek by tracer injection and synoptic sampling, Park County, Montana, August 1997: U.S. Geological Survey Water-Resources Investigations Report 99-4119, 40 p. Kimball, B.A., Runkel, R.L., and Gerner, L.J., 1999b, Quantification of metal loading in French Gulch, Summit County, Colorado, using a tracer-injection study: U.S. Geological Survey Water-Resources Investigations Report 98-4078, 38 p. Kimball, B.A., Runkel, R.L., and Gerner, L.J., 2001, Quantification of mine-drainage inflows to Little Cottonwood Creek, Utah, using a tracer-injection and synopticsampling study: Environmental Geology, v. 40, p. 1390-1404. Kimball, B.A., Runkel, R.L., Walton-Day, K., and Bencala, K.E., 2002, Assessment of metal loads in watersheds affected by acid mine drainage by using tracer injection and synoptic sampling: Cement Creek, Colorado, USA: Applied Geochemistry, v. 17, p. 1183-1207. Lindsay, W.L., 1979, Chemical equilibria in soils: New York, John Wiley & Sons, 449 p. May, H.M, 1992, The hydrolysis of aluminum: Conflicting models and the interpretation of aluminum geochemistry, in Kharaka, Y.K. and Maest, A.S., eds. Water-rock Interaction, Volume 1: Low Temperature Environments: Rotterdam, A.A. Balkema, p. 13-21. 19
Ranville, J.F., Smith, K.S., Macalady, D.L., Rees, T.F., 1989. Colloidal properties of flocculated bed material in a stream contaminated by acid mine drainage, St. Kevin Gulch, Colorado. US Geological Survey Water-Resources Investigations Report 88-4220, p. 111–118. Runkel, R.L., and Kimball, B.A., 2002, Evaluating remedial alternatives for an acid mine drainage stream: Application of a reactive transport model: Environmental Science & Technology, v. 36, no. 5, p. 1093-1101. Schemel, L.E. Kimball, B.A., and Bencala, K.E., 2000, Colloid formation and metal transport through two mixing zones affected by acid mine drainage near Silverton, Colorado: Applied Geochemistry, v. 15, p. 1003-1015. Smith, K.S., 1999, Metal Sorption on Mineral Surfaces: An Overview with Examples Relating to Mineral Deposits, in Plumlee, G. S. and Logsdon, M. J., eds, The Environmental Geochemistry of Mineral Deposits Part A: Processes, Techniques, and Health Issues: Littleton, Colorado, Society of Economic Geologists, p. 161182. Ward J.R., and Harr C.A., 1990, Methods for collection and processing of surface-water and bed-material samples for physical and chemical analyses: U.S. Geological Survey Open-File Report 90-140, 71 p.
20