connections between concepts through explicit graph edges, to support conceptual ... World Explorer ...... [40] Viegas, F.B., Wattenberg, M., van Ham, F., Kriss, J.,.
Integrating Implicit Structure Visualization with Authoring Promotes Ideation Andrew M. Webb and Andruid Kerne Interface Ecology Lab Dept. of Computer Science & Engineering, Texas A&M University {andrew, andruid}@ecologylab.net ABSTRACT We need to harness the growing wealth of information in digital libraries to support intellectual work involving creative and exploratory processes. Prior research on hypertext authoring shifted the focus from explicit structure to direct presentation of content aided by “implicit” spatial representation of structure. We likewise shift the field of information visualization. Using hypertext's rubric, we redefine what most people think of as "information visualization" as explicit structure visualization. We alternatively address implicit structure visualization, presenting content directly, representing structure with spatiality and other visual features. We integrate authoring to emphasize the role of human thought in learning and ideation. Prior research has shown that people iteratively collect and organize information by clipping magazines, piling clippings in somewhat messy ways, and organizing them. MessyOrganizer is an iterative implicit structure visualization algorithm which, like human practice, gradually collects and organizes information clippings. Content is depicted directly. Structural relationships are visualized implicitly through spatial positioning of related elements, with overlap and translucence. The simulated annealing algorithm is applied to a model of semantic relatedness over a spatial grid. We develop an experiment comparing products created with the integrated environment versus separated visualization and authoring spaces. Results reveal that participants have more novel and varied ideas when visualization is integrated with authoring.
Categories and Subject Descriptors H.5.m [Information Systems]: Information Interfaces and Presentation – miscellaneous.
General Terms Algorithms, Design, Experimentation, Human Factors
Keywords creativity support tools, information visualization, authoring
1. INTRODUCTION The increasing abundance of information in digital libraries can
Permission to make digital or hard copies of all or part of this work for personal or classroom use is granted without fee provided that copies are not made or distributed for profit or commercial advantage and that copies bear this notice and the full citation on the first page. To copy otherwise, or republish, to post on servers or to redistribute to lists, requires prior specific permission and/or a fee. JCDL’11, June 13–17, 2011, Ottawa, Ontario, Canada. Copyright 2011 ACM 978-1-4503-0744-4/11/06...$10.00.
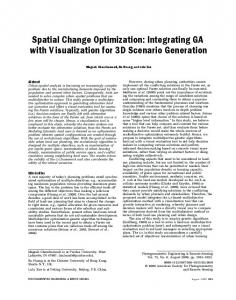
support creative processes for humans engaged in intellectual work like design, writing, learning, and problem solving. Consider a scenario in which a hypothetical high school student, Grace, uses Wikipedia to research ideas for a science project. Grace will explore a wide space of ideas across many documents. She will seek to understand relationships between the documents, collect and organize relevant information, annotate thoughts, think about the information, and develop a research topic. She could make use of explicit structure information visualizations, such as treemaps [43] or node-link diagrams [33] to understand relationships. However, content would not be directly visible. In intellectual work involving creativity, learning, or problem solving, content is at least as important as relationships between elements. For example, knowing when people posted images about Hurricane Katrina to Flickr, and with what tags, is useful, but seeing the images has another value [13]. Visualizing content and explicit structure together increases visual complexity, disrupting legibility. Implicit structure visualization expresses relationships through visual features such as spatial positioning, size, and translucence without adding new visual elements (see Figure 1). As prior information visualization uses explicit structure to convey relationships in abstract data to amplify cognition [7], we find that implicit structure form of information visualization represents relationships between information concepts to amplify sensemaking and ideation. Implicit structure visualization seeks to support users in simultaneously thinking about information content and understanding relationships while avoiding too high a demand on visual attention. As part of intellectual work, Grace engages in exploratory search, actively investigating information to learn something new [22]. The goal is to learn. Information-based ideation is the creative process where new ideas emerge from seeing relationships between existing ideas while working with information [19]. This can occur when Grace is authoring a prior work collection for her science project, highlighting a new focus for her research. Information-based ideation tasks involve assembling and seeing relationships among collected information, developing new ideas, and connecting answers to open-ended questions [20]. In exploratory search and information-based ideation tasks, people author collections with annotations to help them learn and formulate new knowledge. In building her prior work collection, Grace not only collects relevant documents. She annotates ideas on how research topics relate to each other. She organizes the information in a meaningful way. Authoring is essential to information-based ideation [18]. New ideas emerge for Grace when previously unrelated elements are juxtaposed (Figure 1). Authoring is typically separated from visualization. Grace would drag and drop information from the visualization to a different
Figure 1: Snapshot of an implicit structure visualization integrated with authoring being used by Grace to develop ideas for her science project, a low cost solar powered salt water purifier. In the center, she is authoring a collection of surrogates. In-context metadata details-on-demand for one surrogate are displayed. In the peripherae, MessyOrganizer visualizes extracted surrogates. application for authoring. Effort increases as she must switch context from exploring to authoring. Visual elements change, increasing demand on attention. Information semantics are lost in the transfer. We hypothesize that integrating implicit structure visualization with authoring will support information-based ideation. We developed MessyOrganizer, a new implicit structure visualization algorithm that supports integration with authoring. In this integration, the user is not only modifying parameters of the visualization, but changing the visualization through direct manipulation. The user rearranges elements, changing implicit structure, and connects processes of collecting and developing ideas. We will address design challenges arising from how integration affects ideation, visual representation, and interaction. We begin with a discussion of background material. We then explain the integration of implicit structure visualization with authoring. Next, we detail MessyOrganizer, our new incremental implicit structure visualization algorithm, and how it integrates with authoring. We evaluate the effect of integrating implicit structure visualization with authoring on ideation. We conclude by discussing implications for design of integrated environments.
2. BACKGROUND This research is grounded in creative cognition. Prior work in the field develops evaluation methods for ideation tasks. We examine annotation, a subset of authoring that is important to ideation and learning. Implicit structure relates directly to authoring and our approach to visualization. We draw on related work and explain an experience gap within information visualization. We explore explicit structure information visualization in digital libraries. We use clippings to represent content as surrogates. The integration of implicit structure visualization with authoring is investigated through mixed-initiative information composition.
2.1 Creative Cognition The creative cognition approach is grounded in the perspective that creativity results from a federation of cognitive mechanisms [38]. Creative ideation means having ideas. Ideas arise during cognitive tasks. Ideation is difficult to measure. Cognitive tasks involve either convergent or divergent thinking. Performance of convergent thinking tasks requires a single correct answer. Results are measured by speed and accuracy. These tasks and measures, which are widely used, are insufficient for creative cognition [12] and important areas of research into interactivity and information [4]. Divergent thinking tasks, in which one quests for many possible answers to open-ended questions, are designed to investigate creative ideation. Exploratory search and informationbased ideation tasks both involve divergent thinking. Shah, Smith et al. developed creative ideation metrics to evaluate performance of divergent thinking tasks: quantity, quality, novelty and variety of ideas [32]. Kerne et al extended these metrics for tasks involving information-based ideation and discovery [20]. Quantity of Ideas is assessed through evaluators breaking concepts down into individual functional solutions and then counting them. Having more ideas is important in Darwinian models of creativity, as more possible solutions are considered [36]. Quality is a measure of a product solution’s feasibility, clarity, and how well it meets design specifications. Novelty measures how unusual a product solution is. The concepts are sorted into bins of similar or identical solutions. We count how many experiment participants developed each. Variety measures the span of categories in an answer.
2.2 Annotations In information-based ideation tasks, annotations are used to
express novel ideas. Annotations have a role in supporting intellectual work. Marshall found that college students use annotations in textbooks as procedural signals, place markings, in situ problem working, and interpretive activity [23]. Annotating while reading supports understanding [27]. People annotate web documents to aid navigation and organization [14].
2.3 Authoring Implicit Structure We consider the role of structure in authoring and information visualization experiences. Beginning with Aquanet, Marshall and Rogers saw hypertext authors engaging in sensemaking tasks [30] eschew formal representations of semantics, instead opting for spontaneous organization [25]. This finding transformed hypertext research, moving from reasoning systems (e.g. gIBIS [9]) to spatial hypertext [26], and Kerne et al’s work in parallel, on more visual information composition [18]. Information composition is similar to spatial hypertext in terms of information layout, but differs in emphasis on visual design and communication.
2.4 Visualization of Implicit Structure “Formality Considered Harmful” retrospectively examines how converting thinking processes into formal models, such as nodelink structures, and schematized types, imposes extra cognitive steps into sensemaking, diminishing usability [34]. We apply this analysis to examine the roles of formal and informal structure in information visualization. Information visualization, e.g. with ManyEyes [40] or NodeXL [37], typically requires such formalization. Many document semantics visualizations focus on structural features like author relationships [e.g., 18]. It is difficult to include the information content itself, such as images clipped from documents, because they are visually complex and heterogeneous. The assumption of explicit structure representation can lead to an information visualization experience gap. Amar and Stasko identified gaps between representation and analysis [3]. Creative cognition is a super-set of analysis, exacerbating the problem. In response, we emphasize the representation of meaning. Simply visualizing structures is not sufficient for many sensemaking, problem solving, and ideation tasks, because the user may be very interested in the content, in the ideas inherent in each element. Our approach makes presentation of content, with image and text clippings, primary, while presenting relationships with implicit structure visualization. Just as what became spatial hypertext would not have been seen as hypertext in the field’s early days, so the MessyOrganizer implicit structure visualization is a new form of information visualization, with a different look than that developed by many prior practitioners.
2.5 Digital Library Information Visualization Several researchers have investigated visualizations for digital libraries and information collections, but none to our knowledge have addressed integrating authoring with the visualization. Xu et al designed and evaluated a treemap visualization for personal media collections [43]. Butcher et al explored search interfaces for digital libraries using multimedia strand maps, which visualize connections between concepts through explicit graph edges, to support conceptual discovery [6]. Druin et al developed SearchKid, a visual interface for searching, browsing, and viewing results for a children’s digital library [10]. They found that children wanted to use information they found, so they supported collection authoring, but through a separate application. Shen et al formalize the integration of browsing, searching, and visualization in digital libraries as theory [33]. They suggest blurring the line between searching and browsing to support exploratory search.
We take this one step further, integrating authoring to promote thinking about the information in creative ways. World Explorer uses implicit structure visualization to show aggregated data from Flickr images as variable sized tags spatially overlaid on a map [2]. Card et al used real world metaphors as a basis for WebBook, a visualization for grouped web pages in virtual books, and Web Forager, a 3D information workspace with virtual bookshelves [8]. Robertson et al developed Data Mountain to aid document management by visualizing documents on an inclined plane in a 3D virtual environment where users can arrange and organize, supporting authoring implicit structure [29].
2.6 Surrogates How documents are represented in a collection impacts user experience. A surrogate is a representation of an information resource that provides access to that resource [5]. Wildemuth et al investigated fast-forward surrogates for representing video documents within digital libraries [42]. Green et al examined how previews and overviews can be used as surrogates to support exploratory search [15]. A preview is a single image thumbnail, text clipping, or analytic object (e.g. bar in graph). Overviews combine visual objects to convey relationships. In mixed-initiative information composition, informative documents are represented by image and text surrogates that function as clippings, visualizing content and supporting implicit structure visualization [18]. Information composition surrogates provide navigation to textual documents to support exploration of concepts in intellectual work.
2.7 Mixed-initiative Information Composition To investigate how integrating implicit structure visualization with authoring can promote information-based ideation, we develop mixed-initiative information composition [18]. Composition, a term that comes from the arts, means an assemblage of connected elements to form a whole. Composition uses implicit structure to visualize relationships. In Grace’s composition, she spatially arranges surrogates in groups, such as solar panels, water purification and desalination. She emphasizes importance of ideas through surrogate sizes. Users create information compositions to answer open-ended divergent thinking questions, such as developing a research topic or planning a family vacation. It has been shown that authoring information compositions stimulates emergence of new ideas on information-based ideation tasks [20]. combinFormation is a creativity support tool that uses mixedinitiative information composition to represent information collections [18]. In combinFormation, computational agents extract image and text surrogates from documents and visualize them to the user in a composition space. The human user collects and organizes surrogates and annotates ideas to author a composition to answer open-ended question as part of an information-based ideation task. The prior visualization algorithm in combinFormation used a spreading activation technique [28][18] that placed new surrogates by giving high activation to unoccupied regions near the most relevant surrogates. This approach begins to fail as the visualization space fills with surrogates. The spread radius only extends so far from a surrogate. Once a surrogate is surrounded, future placements of related surrogates become random as no regions have adequate activation.
3. INTEGRATING IMPLICIT STRUCTURE VISUALIZATION WITH AUTHORING Integrating implicit structure visualization with authoring connects human processes for exploring and creating while working with
information. Prior environments support either exploratory processes through explicit structure visualization or creative processes through collection authoring and annotation. Hypertext browsing enables exploration of content. We hypothesize that connecting these processes will support users engaged in information-based ideation. Here we articulate issues associated with integration: connected visual spaces, serendipitous promotion of ideation, underlying semantics in the user experience, and interactive tools. Since monitors and the human field of vision are limited, visual space is at a premium. We emphasize human ideation as central to using information collections in intellectual work. To use space effectively, we divide the composition space into two regions, one in the center and the other peripherae (see Figure 1). The primary authoring space, which we call the cool space is located at the center. Changes in this space are only made by the user. Implicit structure visualization is generated in a peripheral region, called the hot space. MessyOrganizer is used to add and remove surrogates here. The cool space leaves a hole in the hot visualization space. Unlike prior visualizations, which occupy a contiguous rectangle [43], this constraint adds new complexity to the visualization algorithm. While the composition space is divided, the human process of authoring is integrally supported in both spaces. Grace is not limited to annotating or collecting information in only the cool space. She can also use the hot space to collect and annotate information for future reference. Visualization in the peripherae serves to aid creative processes. Engaging surrogates serendipitously appear, stimulating new insights. For example, as Grace authors ideas for her science project, an interesting surrogate of a portable water purifier appears, leading her to expand her research scope to address portability. An advantage of integration is that collection elements do not lose information semantics when moving between visualization and authoring spaces. Metadata, such as the author of a publication, caption for an image, and title and category for a Wikipedia article, is retained, providing context to support sensemaking. Semantics can influence visualization, such as algorithmic placement of surrogates in the hot space near related surrogates collected by the user in the cool space. Interactive tools support visualization and authoring across the spaces. The user affects information collection and visualization through an in-context interface for expressing importance of semantic features [41]. The user also adjusts visual features, such as spatial positioning, size, color, and translucence. She can group related surrogates and connect relationships between existing ideas, supporting information-based ideation. She can adjust the proportions of the cool and hot spaces, when authoring or visualization generation is more important in her task. In information-based ideation, a person alternates exploratory and creative processes, from browsing and collecting information to authoring ideas and vice versa [17].
4. MESSYORGANIZER VISUALIZATION We developed MessyOrganizer, a new incremental implicit structure visualization algorithm that supports integration with authoring. The implicit structure and incremental steps mimic human processes of collecting and organizing clippings. Emerging collections inevitably grow messy, because we lack a complete a priori cognitive schema. The resulting loosely organized messiness helps the user think about the information and
encourages rearrangement. In this section, we motivate and develop this algorithmic messiness. We describe how MessyOrganizer uses implicit structure visualization to layout surrogates incrementally based on functions designed to minimize messiness, and manage the mess by removing older surrogates.
4.1 Clippings and Messiness Marshall and Bly found that people desire organization of physical clippings to avoid appearing a “pack rat” [24]. Participants organized related clippings by pinning them next to each other on a wall. Clippings overlapped. Older clippings became buried underneath newer ones. MessyOrganizer simulates this collection process by spatially grouping and overlapping related surrogates. MessyDesk, inspired by human practices of organizing information on physical desks through messy piles, was designed to help people organize and remember information by enticing them to develop context through decoration of a desktop space [11]. MessyOrganizer extends the role of messy organization used in MessyDesk to support automated grouping of similar elements through use of white space, overlap, and translucence. In MessyDesk, users arrange information in spatial groups to help organize information. Groupings are the basis for emergent ideas in information-based ideation [20] and chunking [35]. The practice of mixed-initiative information composition, by students in a course on invention and entrepreneurship, produced corroborative evidence [17]: “I like things in an order. Through the process of making messy things organized, I came up with new ideas. If everything is linear and in order, there is no need to think anything new.” Messiness was found to play a formative role in creative cognition and situated creative learning.
4.2 Visualization Algorithm We simulate iterative human processes of collecting and organizing clippings to support creative cognition in informationbased ideation tasks. A person does not know in advance exactly what she will collect or how to organize it. Concepts and associated structures emerge. Thus, things get out of place as we visualize new information. While building personal collections, significance of ideas and focus on concepts shift. MessyOrganizer is designed to support these shifts. The messiness of MessyOrganizer engages users in organization of information. MessyOrganizer is an incremental visualization algorithm, designed to operate on a dynamically changing collection. We define incremental visualization formally as a dynamic presentation created by a sequence of placement decisions. Each decision places only a single element. Its operation is independent of the previous decision, as each placement runs separately. However, each placement changes the state of the visualization as a whole, and each placement decision is based on that whole state. Thus, the range of possible visualizations at any time n is constrained by the visualization at time n-1, making global optimization without moving elements impossible. We derive the MessyOrganizer algorithm from simulated annealing. Simulated annealing is a stochastic algorithm that models the annealing process in metallurgy to search a problem space to find an optimal solution [21]. In annealing, a metal is repeatedly heated to a high temperature, then cooled slowly, resulting in a restructuring of the crystallization and improving the metal’s durability. In a similar manner, MessyOrganizer attempts to find an optimal visualization (least messy) by minimizing an energy function for each element placed. The minimization of the energy function is performed by iteratively adjusting a potential
Figure 2: Example of MessyOrganizer attempted placement for an image. Fat pixel grid lines are displayed. Effects on energy function associated with each fat pixel are displayed. placement in small amounts, until the energy function is less than the desired value or until number of iterations exceeds a threshold. If the energy requirement is met, the placement is successful, and the element is placed. Otherwise, time expires, and the placement fails. A transition function uses a decaying temperature equation to simulate the cooling process affecting when a placement adjustment is accepted, allowing more changes in early iterations and fewer in later ones. Moves from lower to higher energy are allowed during earlier iterations to avoid local minima.
with MessyDesk, the messy organization has meaning. MessyOrganizer aims to develop meaningful messiness through the following functions for simulated annealing algorithms: (1) an energy function to evaluate messiness of a placement, (2) a neighbor function to make small changes to messiness, and (3) a transition function to navigate the messiness. The energy function calculates the quality of the current placement. The goal of MessyOrganizer is to minimize the energy function. The neighbor function specifies a new placement based on a small change in the existing placement. The transition function specifies probability of transitioning to a new placement based on the energy for both the current and new placements, and temperature reflected by a percentage of time.
4.4.1 Energy Function MessyOrganizer spatially groups related surrogates, using overlap along edges to connect groups. This is reflected in the energy function. The energy function for MessyOrganizer is presented in Equation 1, where C represents a constant, x and y represent the fat pixel grid coordinates of the top left corner for surrogate placement, w and h are the width and height in fat pixels of the surrogate, and d is the distance to the nearest fat pixel containing the most related surrogate.
4.3 Layout: structuring the messiness In MessyDesk, a user lays out information in groups and piles to develop meaningful contexts to help in organization and remembering. MessyOrganizer is designed to automatically visualize meaningful contexts by grouping related surrogates and minimizing distance between related information. The goal of the algorithm is to generate the optimal layout of surrogates by minimizing the mess created with each new surrogate. As a basis for layout, the integrated visualization and authoring space is divided into a grid of fat pixels (see Figure 2). A fat pixel is a rectangular area consisting of multiple pixels and having the same aspect ratio as the whole visual space. We define placement of a surrogate by the fat pixel that will contain the surrogate’s top left corner. A set of iterative placements constitutes a layout. MessyOrganizer selects an initial placement to begin calculating optimal placement for a new surrogate. We determine the initial placement by calculating an activation weight for each fat pixel based on the similarity between the surrogates in that fat pixel and the surrogate being placed. The similarity function uses semantic features in the form of term vectors [31]. This algorithm could also sensibly be used with a similarity function based on visual features, or a combination of both. Fat pixels containing surrogates more related to the surrogate being placed will have higher weights. The fat pixel with the highest weight is selected for initial placement. If the highest weight is shared by more than one fat pixel, the average weight of the fat pixels surrounding each of the highest weight fat pixels is calculated. The fat pixel with the highest average is selected for initial placement. As a result of the environment’s integration, information authored by the user in the cool space also impacts visualization. Activation is spread from fat pixels in the cool space across the border to the hot space. The result is increased activation for fat pixels in the hot space that are near related surrogates in the cool space. The goal is to help the user more easily make sense of the new information by placing it near already collected information. This helps maintain visual groupings so that information can be chunked effectively.
4.4 Functions: minimizing the messiness When people organize physical clippings or digital information
, , , ℎ,
,
=
, , ,
=
∙
+
1 ℎ
,
, ,
if fat pixel contains edge of surrogate
(1)
if fat pixel contains middle of surrogate if fat pixel is empty
ℎ , < and