Jan 11, 2006 - must be independent from a specific domain of application. A well-defined ..... to the development of new, integrated knowledge. ..... London, UK and Centre for Global Environmental Research, Tsukuba, Japan, x+59 pp.
Integrating Knowledge for Assessing Coastal Vulnerability to Climate Change Jochen Hinkel and Richard J.T. Klein January 11, 2006 Draft chapter forthcoming in ”Managing Coastal Vulnerability: An Integrated Approach”, edited by L. McFadden, R.J. Nicholls and E.C. Penning-Rowsell, Elsevier Science, Amsterdam, The Netherlands.
1
Introduction
In view of the high natural and socio-economic values that are threatened and might be lost in coastal zones, it can be important to identify the types and magnitude of changes to which coastal systems are exposed, as well as the options that are available to minimise risks and reduce possible adverse consequences. However, assessing coastal vulnerability is not a straightforward exercise, not in the least because there is confusion concerning the precise meaning of the term “vulnerability”. Vulnerability is specific to a given location or group or sector. There is therefore no single recipe for assessing vulnerability to climate change or any other type of change. Different scholarly communities have developed different conceptualisations of vulnerability, and different conceptualisations exist even within these communities. Existing conceptualisations are often found to be imprecise when attempting to make them operational for assessment. For example, the Third Assessment Report of the Intergovernmental Panel on Climate Change (IPCC) defined vulnerability as “the degree to which a system is susceptible to, or unable to cope with, adverse effects of climate change, including climate variability and extremes. It is a function of the character, magnitude and rate of climate variation to which a system is exposed, its sensitivity, and its adaptive capacity” (McCarthy et al., 2001). The extent to which this “definition” of vulnerability can be made operational is limited because its constituent concepts are either very general or remain undefined. In addition, it does not explain the functional relationships between these concepts. The diversity in conceptualisations and their being imprecise have led to a diversity in methodological approaches for assessing vulnerability (Brooks et al., 2003; O’Brien et al., 2004; Adger, 2006). In addition to this methodological diversity, methodologies have grown in complexity over the past two decades: they now consider multiple stimuli rather than a single stimulus, they allow for dynamic rather 1
than static analysis, they have become interdisciplinary and they have moved from a predominant emphasis on impacts to a stronger focus on adaptation and adaptive capacity (F¨ ussel and Klein, 2006). Notwithstanding the lack of commonly agreed definitions and approaches, there is a great need to be able to assess and compare the vulnerability of regions, countries and sectors. Knowledge of vulnerability would enable scientists and decision-makers to anticipate and act on the adverse consequences of current and future changes, including those resulting from sea-level rise and other effects of climate change. Comparability is key to the notion of vulnerability: decision-makers are often interested in knowing which countries, regions, communities or sectors are most vulnerable, so that they can prioritise their activities. How could a methodology for assessing vulnerability be specific enough to consider the unique circumstances of a given system whilst being generic enough to ensure that the vulnerability of this system can be compared with that of other systems, possibly assessed using different methodologies? In this chapter we argue that this would require two elements: (i ) a common domain-independent conceptual framework of vulnerability and (ii ) a well-defined process that specifies how the framework’s general concepts can be specialised to accommodate the specific case of the assessment. A common conceptual framework is needed to enable unambiguous communication about vulnerability and meaningful comparison between vulnerability assessments. Given the diversity of types of natural and social systems under study, this common framework must be very general indeed: the definition of vulnerability should only include those elements that are absolutely necessary for avoiding ambiguity and it must be independent from a specific domain of application. A well-defined process is then needed to organise the specialisation of the framework’s general concepts for the system of interest, resulting in a case-specific operational definition of vulnerability. This step requires detailed system understanding and the integration of expertise from different knowledge domains. Case-specific definitions of vulnerability cannot be prescribed, but the process of deriving them from the general concepts can be structured and facilitated. This chapter presents a recent attempt at developing and applying these two elements. First we present a general domain-independent formal framework of vulnerability proposed by Ionescu et al. (2005) as an example of the first element. As an example of the second element we then present the DIVA method: a method developed by Hinkel (2005) to organise the iterative integration of knowledge and thus develop a case-specific operational definition of vulnerability. Finally we show how the formal framework and the DIVA method have been applied in the EU-funded project DINAS-COAST (Dynamic and Interactive Assessment of National, Regional and Global Vulnerability of Coastal Zones to Climate Change and Sea-Level Rise) to develop the coastal vulnerability assessment tool DIVA (Dynamic and Interactive Vulnerability Assessment; DINAS-COAST Consortium, 2004). Note that the chapter does not present results produced by the application of DIVA; these can be found in Chapter [LORAINE TO COMPLETE] (Nicholls et al., 2006). 2
2
The Evolution of Methodologies for Assessing Coastal Vulnerability
Before climate change emerged as an academic focus, vulnerability as such was not an important concept in coastal research. Traditionally, research in coastal zones has been conducted mainly by geologists, ecologists and engineers, roughly as follows (Klein, 2002): • Geologists study coastal sedimentation patterns and the consequent dynamic processes of erosion and accretion over different spatial and temporal scales; • Ecologists study the occurrence, diversity and functioning of coastal flora and fauna from the species to the ecosystem level; • Engineers take a risk-based approach, assessing the probability of occurrence of storm surges and other extreme events that could jeopardise the integrity of the coast and the safety of coastal communities. The challenge of climate change has spurred the collaboration between these three groups of coastal scientists; vulnerability has become an integrating focus of this research collaboration. Since 1990 a number of major efforts have been made to develop guidelines and methodologies for assessing coastal vulnerability to climate change, which combined the expertise of the three disciplines, complemented with economics.1 In 1992 the former Coastal Zone Management Subgroup of the IPCC published the latest version of its Common Methodology for Assessing the Vulnerability of Coastal Areas to Sea-Level Rise (IPCC CZMS, 1992). It comprises seven consecutive analytical steps that allow for the identification of populations and physical and natural resources at risk, and of the costs and feasibility of possible responses to adverse impacts. Results can be presented for the seven vulnerability indicators listed in Table 1. The Common Methodology has been used as the basis of assessments in at least 46 countries; quantitative results were produced in 22 country case studies and eight subnational studies (for an overview see Nicholls, 1995). Hoozemans et al. (1993) applied the Common Methodology on a global scale. Studies that used the Common Methodology were meant to serve as preparatory assessments, identifying priority 1
Many involved in these efforts were unaware of the long history of vulnerability assessment in other disciplines, particularly the social sciences. In social-science research on poverty, food security and natural hazards, vulnerability is also interpreted in terms of potential harm and capacity to cope, but studies tend to focus in more depth on particular groups and communities within a society. In so doing, they take a quite different (i.e., bottom-up) approach to vulnerability assessment. This approach is typically place-based and cognisant of the rich variety of social, cultural, economic, institutional and other factors that define vulnerability. It does not rely on global or regional models to inform the analysis; instead the major source of information is the vulnerable community itself (Klein, 2002).
3
Indicator People affected People at risk Capital value at loss Land at loss Wetland at loss Adaptation costs People at risk
Description The people living in the hazard zone affected by sea-level rise The average annual number of people flooded by storm surge The market value of infrastructure which could be lost due to sea-level rise The area of land that would be lost due to sea-level rise The area of wetland that would be lost due to sea-level rise The costs of adapting to sea-level rise, with an overwhelming emphasis on protection The average annual number of people flooded by storm surge, assuming the costed adaptation to be in place
Table 1: The vulnerability indicators of the IPCC Common Methodology. regions and priority sectors and providing an initial screening of the feasibility and effect of coastal protection measures. They have been successful in raising awareness of the potential magnitude of climate change and its possible consequences in coastal zones. They have thus provided a motivation for implementing policies and measures to control greenhouse gas emissions. In addition, they have encouraged long-term thinking and they have triggered more detailed local coastal studies in areas identified as particularly vulnerable, the results of which have contributed to coastal planning and management. Nonetheless, a number of problems with the Common Methodology have been identified, which mainly concern its data intensity and its simplified approach to assessing biogeophysical and socio-economic system response (for a more detailed discussion see Klein and Nicholls, 1999). Alternative assessment methodologies have been proposed, but they have generally not been applied by anyone other than their developers. A semi-quantitative methodology proposed by Kay and Hay (1993) was applied in a number of South Pacific island countries, where it was felt that the Common Methodology put too much emphasis on market-based impacts. An index-based approach proposed by Gornitz et al. (1994) included the risk of hurricanes and was developed for use along the east coast of the United States. However, it did not consider socio-economic factors. The relative success of the Common Methodology led the IPCC to adopt its approach as a model for assessing the vulnerability of other, non-coastal systems to climate change. The top-down approach of the Common Methodology was intuitively attractive to the wider climate change community, whose work has been strongly model-orientated. In 1994 the IPCC published its Technical Guidelines for Assessing Climate Change Impacts and Adaptations (Carter et al., 1994), which provide system-independent guidance to countries that wish to assess their vulnerability to climate change. The Technical Guidelines are outlined in a similar fashion to the Common Methodology, but fewer analytical steps are implied and less prior knowledge is assumed. In addition, the Technical Guidelines are not prescriptive in 4
the choice of scenarios, tools and techniques to conduct the analysis. The United Nations Environment Programme (UNEP) Handbook on Methods for Climate Change Impact Assessments and Adaptation Strategies (Feenstra et al., 1998) offers a detailed elaboration of the IPCC Technical Guidelines for a range of socio-economic and physiographic systems, including coastal zones (Klein and Nicholls, 1998). The UNEP Handbook has been used in a number of developing countries under the UNEP Country Studies Programme and in the first phase of the Netherlands Climate Change Studies Assistance Programme. The United States Country Studies Program used similar guidance provided by Benioff et al. (1996). In the late 1990s the EU-funded project SURVAS (Synthesis and Upscaling of SeaLevel Rise Vulnerability Assessment Studies) aimed to synthesise and upscale all available coastal vulnerability studies and to develop standardised data sets for coastal impact indicators suitable for regional and global analysis (De la VegaLeinert et al., 2000a, 2000b; see also http://www.survas.mdx.ac.uk/). However, this effort was only partially successful: synthesis and upscaling was impeded by the fact that studies had used different methodologies, scenarios and assumptions. As a result, until the publication of DIVA (DINAS-COAST Consortium, 2004) the global assessments by Hoozemans et al. (1993) and its updates by Baarse (1995) and Nicholls (2002, 2004) remained the only sources of global information on coastal vulnerability to sea-level rise.
3
A Formal Framework of Vulnerability
The first element required to assess vulnerability is a conceptualisation of vulnerability. We want this a priori conceptualisation to be as general as possible so that it can be applied to a variety of natural and social systems and it ensures comparability with others approaches. The formal framework proposed by Ionescu et al. (2005) serves these purposes. Their definition of vulnerability differs from most definitions in the literature in that it is independent from specific knowledge domains (i.e., scientific disciplines) and from the system of interest (e.g., a biological or social system). Vulnerability is defined on the basis of domain-independent mathematical concepts. In this chapter we only give a brief overview of the framework; for a full account see Ionescu et al. (2005). The formal framework requires one to specify (i ) the entity of which the vulnerability is assessed, (ii ) the stimulus to which the entity would be vulnerable, and (iii) the preference criteria that are used to evaluate the outcome of the interaction between the entity and the stimulus (e.g., an adverse or undesirable outcome). In other words, it is the vulnerability of an entity to a specific stimulus with respect to certain preference criteria. Examples in coastal zones include the vulnerability of Bangladesh to sea-level rise with respect to the number of people affected by coastal flooding, the vulnerability of tourist resorts in Florida to an increased intensity of hurricanes with respect to economic losses, the vulnerability of the Great Barrier Reef to increased sea-surface temperatures with respect to the degradation of coral 5
ecosystems, and the vulnerability of a fishing community in Vietnam to the conversion of mangroves into fishponds with respect to the loss of traditional livelihoods. Any definition of vulnerability must thus contain the three primitive concepts of entity, stimulus and preference criteria in order to convey meaningful information, and in fact most approaches described in the literature do (Brooks et al., 2003). In the framework proposed by Ionescu et al. (2005), the entity of which the vulnerability is assessed is represented as a discrete dynamical system and the stimulus to which it is exposed is the system’s exogenous input. The system’s “reaction” to the exogenous input is given by: xk+1 = f (xk , ek ) (1) where f : X × E → X is called the transition function of the system X is the set of states of the system E is the set of exogenous inputs to the system k is the time step (we consider a discrete system). The system’s output is given by: y k = g(xk )
(2)
where g : X → Y is called the output function of the system Y is the set of outputs. These outputs can be thought of as indicators of the state and are in general considered measurable or observable quantities. The preference criteria are represented as a preorder ¹ on the set of outputs Y . A preorder is a reflexive and transitive relation and thus a very general mathematical model to represent preference criteria. The notation y k ¹ y 0k means that the system that produces output y k is considered to be “worse off” compared to the system that produces output y 0k . The concepts introduced here now allow us to define vulnerability: a system is vulnerable to an exogenous input if it ends up “worse off” than it was before, or more formally: Definition 1. A system (f, g) in state xk is vulnerable to an exogenous input ek with respect to preorder ¹ if and only if (iff) y k+1 ≺ y k . In addition, it is possible to compare the vulnerability of one entity under different circumstances (i.e., in different states) or to another entity receiving the same exogenous input.
6
Definition 2. A system (f, g) is more vulnerable in state xk than in state x0k to an exogenous input ek with respect to preorder ¹ iff i ) the system in state xk is vulnerable to exogenous input ek with respect to preorder ¹ ii ) y k+1 ¹ y 0k+1 .
Definition 3. A system (f, g) in state xk is more vulnerable to an exogenous input ek than a system (f 0 , g 0 ) in state x0k is to an exogenous input e0k with respect to preorder ¹ iff i ) it is vulnerable to ek with respect to ¹ ii ) y k+1 ¹ y 0k+1 .
Whilst the concepts introduced so far have allowed us to define vulnerability, a further primitive concept is needed to include the notion of adaptation. Adaptation requires that the vulnerable entity has actions at its disposal to respond to the exogenous inputs it receives. To represent these actions, the dynamical system’s transition function must be extended to include endogenous inputs: xk+1 = f (xk , ek , uk )
(3)
where uk is an element of U k = U (xk , ek ), the set of available endogenous inputs (or adaptation actions). Adaptation involves choosing an effective action that will prevent the system from being worse off in the next time step (i.e., choose an action uk ∈ U k such that not (y k+1 ≺ y k )). The size of the set of effective actions available to the system can be interpreted as the system’s adaptive capacity. Finally, we can define an adaptation strategy as a function that returns an adaptation action uk for every state xk of the system and for every exogenous input ek it receives: uk = φ(xk , ek )
(4)
where φ : X × E → U. A more elaborate description of the framework, along with examples, can be found in Ionescu et al. (2005).
7
4
The DIVA Method
The second element required to assess vulnerability is a well-defined process that organises how the formal framework’s general concepts can be specialised to accommodate a specific case. This process involves two tasks. First, the mathematical concepts must be interpreted, that is, they must be mapped to components of the “real-world” system of interest (i.e., the vulnerable entity, the stimuli and the preference criteria). Second, the mathematical concepts must be specialised to represent their “real-world” counterparts. The mathematical forms of the state transition function (Equation 1 or 3), the output function (Equation 2) and the adaptation strategies (Equation 4) have to be specified in order to apply the framework’s formal definitions. The product of this task is the operational definition. The challenge of this process lies in the interdisciplinary nature of the two tasks, especially the second one. Knowledge from both the natural and the social sciences must be identified and integrated into a complete mathematical description of the system of interest. There is no single possible outcome when integrating knowledge into an operational definition of vulnerability. Different groups of experts tackling the same problem will inevitably come up with different specialisations and therefore with different definitions. Moreover, the definition of vulnerability evolves within a group of experts over the course of the assessment. The interactions between the various parts of the system are usually not fully understood at the start of an assessment; instead, such understanding is a result of the assessment itself. How can an assessment methodology be designed to deal with the fact that the operational definition of vulnerability is almost certain to change as system knowledge develops over the course of the assessment? One way of dealing with vulnerability being a moving target is to design a methodology that allows for the development and refinement of operational definitions during the assessment. In other words, rather than to settle on the definition of vulnerability at the outset, an iterative process is agreed to develop and refine good definitions of vulnerability in response to the development of new, integrated knowledge. Integrating knowledge can be particularly challenging when the participants in the assessment represent different scientific disciplines, use incompatible terminology and lack the time or funding for frequent face-to-face meetings. These challenges create a need for methods that foster the communication, collaboration and mutual learning between participants and thus lead to a better interdisciplinary understanding of the issues at hand and to a more adequate definition of vulnerability. In DINAS-COAST the DIVA method was developed specifically to facilitate the integration of knowledge from distributed experts with different disciplinary backgrounds. The DIVA method was then applied to build the DIVA tool (see Section 5). However, the DIVA method is a generic method for building modular integrated models by distributed partners and could be applied to any problem with similar requirements. For a detailed technical description of the DIVA method see Hinkel (2005).
8
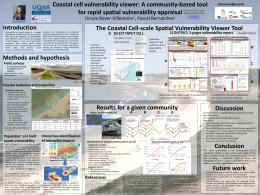
The DIVA method consists of a modelling framework and a semi-automated development process. The modelling framework addresses the integration of knowledge at the product level: it frames the product (i.e., the DIVA tool) by providing a general a priori conceptualisation of the system to be modelled based on the formal framework presented in Section 3. It does so by providing concepts for expressing static information about the system, as well as for representing the system’s dynamics. The static information of the system is represented by a relational-data model consisting of geographical features, properties and relations. The geographical features represent the real-world phenomena such as rivers or countries. Properties capture the quantitative information about the features. For example, a country might have the property “area” or a river the property “length”. Finally, relations describe how the features are structured. For example, a region might contain several countries. The dynamics of the system are represented in the form of difference equations, in accordance with the formal framework. The development process then addresses the integration of knowledge at the process level. It organises the iterative specialising of the framework’s general concepts to the needs of the specific problem addressed, thereby structuring the integration of knowledge from the various experts. Knowledge enters the process as four categories (see Figure 1): • The system’s ontology, which is a formal vocabulary for referring to properties of the modelled system; • The algorithms, which implement the system’s state transition function, output function and adaptation strategies; • The data, which express the initial state of the system and the inputs to which its vulnerability is being assessed (in the form of scenarios); • The use-cases, which specify how the user can interact with the model via a graphical user interface (GUI). The four categories of knowledge are interrelated; for example, new data may create the need to change existing algorithms or develop new ones with the consequent need to update the ontology. Once knowledge has entered the development process, most subsequent processes are automated. The development process can be iterated as many times as needed and whilst at any stage new knowledge can be incorporated, there is always a complete model available. The first step of each iteration of the development process is the elaboration of a common formal vocabulary or ontology. The specific features, properties and relations that constitute the modelled system must be specified. All properties of the features must be classified into four categories according to the part they play in the system’s dynamics: driver, state variable, diagnostic variable and parameter. For example, the country’s area would most likely be static (a parameter), whereas its population might be driving the model. The compilation of the ontology is a joint responsibility of the project team. 9
Figure 1: The DIVA development process. Boxes denote deliverables, ovals denote processes, shaded ovals denote automated processes.
10
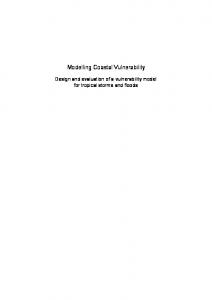
In the next step the ontology is automatically translated into Java source code, which is then used by the project partners to code the algorithms. The hard-coding in Java ensures that an algorithm only compiles if it is consistent with the ontology. Related algorithms are grouped into modules. For example, a social scientist could write a module called “CountryDynamics”, which simulates how the properties of the feature “country” evolve over time. Before a module is submitted for inclusion into the integrated model it is run and validated in stand-alone mode. The last step of each iteration of the development process consists of the analysis of the modules and their linkages, and the validation of the integrated model. The project website is automatically updated with every new submission of a module, offering documentation and the new model to download. An important document that is automatically generated is a graph visualising the data flow through the modules (Figure 2). With this graph the project team can analyse the interactions between the modules and decide whether any changes need to be made in the next iteration of the development process. The main advantage of the iterative approach is that the specification of subsystem interfaces is not required before one can begin to develop and code the algorithms. This allows the module developers to take advantage of the interdisciplinary learning process that takes place over the course of the assessment.
5
The Case of DINAS-COAST
This section illustrates the methodological issues presented above with the help of an example. It shows how the formal framework and the DIVA method have been applied for the assessment of vulnerability of the world’s coastal zone to sea-level rise within the project DINAS-COAST.
5.1
The Conceptualisation of Vulnerability
The vulnerable entity studied in DINAS-COAST is the world’s coastline, or more specifically segments of it. To reflect its large natural and socio-economic diversity, the coastline was decomposed into segments that are assumed to be homogeneous in terms of vulnerability to sea-level rise but which vary in length, with an average length of 70 km. This segmentation was performed on the basis of physical, administrative and socio-economic criteria, producing 12,148 coastline segments in total (McFadden et al., 2006). Data on coastal characteristics needed for the calculation of potential impacts, such as coastal topography, population and protection status, are attributed to the coastline segments (Vafeidis et al., 2006; see also Section 5.2). Characterising the vulnerable entity also includes identifying its potential adaptation actions and strategies. As will be discussed in more detail in Section 5.2, four different adaptation strategies are considered. The project team’s choice for these four strategies was motivated by a desire to provide users with the possibility to 11
t=0
Database
gdp per capita growth population growth
wetland areas wetland parameters tidal range
t=1
t=2
storm surge heights river morphology
ASMITA parameters lagoon areas number of inlets
Internal Drivers
coastal areas storm surge heights gdp per capita
latitude
population density gdp per capita
t=6
relative sea-level rise
relative sea-level rise
River Effect
wetland values adaptation cost nourishment cost sea-dike heights gdp per capita
Wetland Change
wetland areas
t=5
relative sea-level rise
population density socio-economic indicators
t=4
wetland areas
population density
departing tourists population growth gdp per capita growth temperature latitude longitude
Flooding
relative sea-level rise
Wetland Valuation
t=7
Indirect Erosion
flood areas flood heights
t=8
Total Erosion
beach nourishment benefit total sand loss total land loss
Tourism
arriving tourists
t=10
segment lengths tidal range wave climate
indirect sand loss
wetland values
t=9
t=11
coastal areas
Relative Sea-Level Rise
relative sea-level rise
t=3
uplift sea-level rise
total land loss
Costing and Adaptation
sea-dike heights
wetland nourishment
sea-dike heights
beach nourishment
tidal nourishment
UNESCO World Heritage Sites
Figure 2: Module linkages in the DIVA model. Ovals represent the modules, boxes represent data, the black arrows represent the flow of data during one time step, the red arrows represent the data fed into the next time step.
12
explore differences and trade-offs between strategies, as well as with the flexibility to define their own coastal protection standards. However, the coarse geographical scale of the analysis limits the usefulness of these results for coastal management. The stimuli in DINAS-COAST that drive the assessment of vulnerability are scenarios of sea level, temperature, precipitation, coastal population and gross domestic product per capita. These scenarios are based on the four storylines of the IPCC Special Report on Emissions Scenarios (SRES; Naki´cenovi´c and Swart, 2000), which have been the standard source of scenarios for climate impact and vulnerability assessment for the past five years. More recently there has been increased interest in using scenarios of stabilising atmospheric greenhouse gas concentrations, but they were not available in time for use in DINAS-COAST. The preference criteria relate to the output variables of the assessment. These largely correspond with the indicators used by the IPCC Common Methodology, listed in Table 1. This choice of output variables reflects both the desire to be able to compare between previous and current assessments and the fact that coastal research has focused strongly on these types of impact over the past decade. As a result of the latter factor, the assessment of impacts in the current version of the DIVA tool is considerably more sophisticated than the assessments carried out by Hoozemans et al. (1993), Baarse (1995) and Nicholls (2002, 2004). New output variables include effects on tourism arrivals and world heritage sites, as well as more detailed assessments of the costs of adaptation and the loss of wetlands, including their valuation.
5.2
The Operational Definition: The DIVA Tool
The conceptualisation of vulnerability above was developed into an operational definition of vulnerability by applying the DIVA method (Section 4). The product of this step is the DIVA tool, which consist of a global coastal database, a model, a set of scenarios and a GUI. The tool enables its users to simulate the effects of climate and socio-economic change and of adaptation on natural and human coastal systems on national, regional and global scales. The vulnerable entity is represented by a computer model that implements and recursively applies the three functions of the formal framework: the state transition function f (Equation 3), the output function g (Equation 2) and the adaptation strategy φ (Equation 4): The complete model is a function h that, given an initial state x0 , takes a sequence of inputs (e1 , e2 , . . . , eK ) representing the evolution of the environment from time 1 to K and produces a sequence of outputs (y 1 , y 2 , . . . , y K ) representing the evolution of the coastal system: (y 1 , y 2 , . . . , y K ) = h((e1 , e2 , . . . , eK ), x0 , φ) where
13
(5)
h : X × EK × Φ → Y K X is the set of states of the system E is the set of exogenous inputs Φ is the set of adaptation strategies Y is the set of outputs of the system. The transition function f and the output function g are unique, whereas the adaptation strategy φ can be selected from a set of possible strategies. As mentioned earlier, an adaptation strategy is a function that returns an adaptation action for each state of the system and for each input it receives (see Equation 4). The adaptation actions contained in the set of endogenous inputs U are (i ) do nothing, (ii ) build dikes, (iii ) move away, (iv ) nourish the beach, (v ) nourish the tidal basins and (vi ) nourish the wetlands. Some combinations of these actions are possible as well. For each time step (corresponding with model input) the DIVA model selects an adaptation action according to the following four adaptation strategies: • No adaptation: the model only computes potential impacts; • Full protection: raise dikes or nourish beaches as much as is necessary to preserve the status quo (i.e., x0 ); • Optimal protection: optimisation based on the comparison of the monetary costs and benefits of adaptation actions and potential impacts; • User-defined protection: the user defines a return period against which to protect. The functions f , g and φ are distributed across various modules. Each module represents a specific coastal subsystem and encapsulates the knowledge of one or more experts. Table 2 lists all the modules of the current version of the DIVA model (1.0) and Figure 2 shows the flow of data through the modules. The first modules to be invoked compute geodynamic effects of sea-level rise on coastal systems, including direct coastal erosion, erosion within tidal basins, changes in wetlands and the increase of the backwater effect in rivers. This is followed by an assessment of socio-economic impacts, either directly due to sea-level rise or indirectly via the geodynamic effects. The last module is the costing and adaptation module, which implements adaptation actions according to the user-selected strategy. These actions influence the calculations of the geodynamic effects and socio-economic impacts of the next time step. The stimuli are represented by sea-level rise and socio-economic scenarios. Both sets of scenarios were developed to be mutually consistent on the basis of the four IPCC SRES storylines (Naki´cenovi´c and Swart, 2000). The climate scenarios were produced with the climate model of intermediate complexity CLIMBER-2 of the Potsdam Institute for Climate Impact Research (Petoukhov et al., 2000; Ganopolski et al., 2001), whilst the socio-economic scenarios were produced by Hamburg University. The climate and socio-economic scenarios have been regionalised so as 14
Module Name Internal Drivers Relative Sea-Level Rise
River Effect
Author(s) Richard Tol Robert Nicholls, Loraine McFadden, Jochen Hinkel Rob Maaten
Wetland Change
Loraine McFadden, Jochen Hinkel
Flooding
Robert Nicholls, Jochen Hinkel
Wetland Valuation
Luke Brander, Onno Kuik, Jan Vermaat
Indirect Erosion
Luc Bijsterbosch, Zheng Bing Wang, Gerben Boot
Total Erosion
Robert Nicholls
Tourism
Richard Tol
Costing and Adaptation
Richard Tol, Gerben Boot, Poul Grashoff, Jacqueline Hamilton, Jochen Hinkel, Loraine McFadden, Robert Nicholls Richard Tol
World Heritage Sites
Description Produces socio-economic scenarios. Creates relative sea-level rise scenarios by adding vertical land movement to the climate-induced sealevel scenarios. Calculates the distance from the river mouth over which variations in sea level are noticeable. Calculates area change due to sealevel rise for six types of wetlands, taking into account the effect of flood defences. Calculates flooding due to sea-level rise and storm surges, taking into account the effect of flood defences. Calculates the value of different wetland types as a function of GDP, population density and wetland area. Calculates the loss of land, the loss of sand and the demand for nourishment due to indirect erosion in tidal basins. This is a reduced version of the Delft Hydraulics ASMITA model (Stive et al., 1998). Calculates direct erosion on the open coast based on the Bruun rule. Adds up direct erosion and indirect erosion for the open coast, including the effects of nourishment where applied. Calculates number of tourists per country. Calculates socio-economic impacts and either user-defined or optimal adaptation.
Calculates whether a UNESCO world heritage site is threatened by sea-level rise.
Table 2: The modules of the DIVA model. 15
Issue Erosion Flooding Saltwater intrusion Wetlands Costs
Indicator Land lost, sand lost in tidal basins Dike height, people at risk, people actually flooded Area influenced by seawater intrusion into rivers Area of six different types of wetlands, monetary value of wetlands Adaptation cost, cost of nourishment, cost of building dikes, cost of saltwater intrusion, cost of migration, residual damage
Table 3: Selected output of the DIVA model. to allow for more realistic assessments. The climate scenarios have been made available for low, medium and high climate sensitivities, which allows users to assess the range of possible impacts and their sensitivity to the climate scenarios. Although scenarios of temperature and precipitation have been developed, DIVA 1.0 makes limited use of them. This largely reflects the uncertainty surrounding the contribution of these climate variables to coastal vulnerability. The preference criteria on the model’s output have only partially been implemented. The DIVA model does not produce a scalar indicator of vulnerability. The model’s output (Table 3) has many components and no preorder is given on the set of outputs Y . However, since the output is quantitative, a preorder (i.e., a total order) is given naturally on each component of the output. The monetary components are directly comparable and are used to calculate the “optimal protection” adaptation strategy. The non-monetary components have not been made comparable through normalisation. Rather, it is left to the user to explore and compare the outputs that are produced by choosing different adaptation strategies and scenarios. This is facilitated by the GUI, which allows for the visual comparison of the outputs for different regions, time steps, scenarios and adaptation strategies in form of graphs, tables and maps.
6
Conclusions and Outlook
This chapter has argued that the methodological advancement of vulnerability assessment would benefit from the development of two elements: (i ) a domain-independent conceptual framework of vulnerability to enable unambiguous communication about vulnerability and meaningful comparison between vulnerability assessments and (ii ) a process to organise the specialisation of the framework’s general concepts into operational, system-specific definitions so as to facilitate the integration of knowledge from different experts and disciplines. The formal framework proposed by Ionescu et al. (2005) is an example of the first element. The general conceptualisation can be applied to any system whose components can be mapped to the three primitive mathematical concepts of entity, 16
stimulus and preference criteria. This is particularly useful when knowledge about natural and social systems needs to be integrated, as is the case when assessing coastal vulnerability. To take the same general starting points for different assessments ensures comparability. In addition, a formal framework is a prerequisite for computational approaches such as the one taken by DINAS-COAST. The DIVA method is an example of the second element, a process that specifies how general concepts can be specialised into an operational definition to accommodate a specific case. It is an innovative method for developing an integrated model by geographically distributed partners, providing scientists with different backgrounds with a methodological procedure to harmonise their conceptualisations of the system of interest and with an intuitive interface to express and integrate their knowledge about it. The process of model development is well defined and automatically documented. As a result, the status quo is always available on the Internet, providing a basis for efficient communication and collaboration between project partners. The generic nature of both the formal framework and the DIVA method makes them easily extensible and transferable to address new challenges, including noncoastal ones. Improvements on the current version of the DIVA model could include developing a module for coral reefs and atolls, considering consequences of climate change other than sea-level rise (including extreme events), focusing more strongly on river-coast interactions, refining the adaptation module and increasing the spatial resolution of the model, thus increasing DIVA’s usefulness to coastal management. In addition, it is conceivable to develop regional versions of the DIVA tool, such as a DIVA-Europe or a DIVA-South Asia.
Acknowledgements This chapter is based on research that has been funded by the Research DirectorateGeneral of the European Commission through its projects DINAS-COAST (contract number EVK2-CT-2000-00084) and NeWater (contract number 511179-GOCE), the Deutsche Forschungsgemeinschaft (grant KL 611/14) and the START Visiting Scientist Program. The authors thank Cezar Ionescu, K.S. Kavi Kumar, Rupert Klein, Paul Flondor, Tom Downing and Poul Grashoff for stimulating discussions and valuable insights.
References Adger, W.N., 2006: Vulnerability. Global Environmental Change, in press. Baarse, G., 1995: Development of an Operational Tool for Global Vulnerability Assessment (GVA): Update of the Number of People at Risk Due to Sea Level Rise and Increased Flooding Probability. CZM Centre Publication 3, Ministry of Transport, Public Works and Water Management, The Hague, The Netherlands, 17 pp.
17
Benioff, R., S. Guill and J. Lee (eds.), 1996: Vulnerability and Adaptation Assessments: An International Handbook. Version 1.1. United States Country Studies Management Team, Kluwer Academic Publishers, Dordrecht, The Netherlands, xx+191 pp. + apps. Brooks, N., 2003: Vulnerability, Risk and Adaptation: A Conceptual Framework. Working Paper 38, Tyndall Centre for Climate Change Research, University of East Anglia, Norwich, UK, 16 pp. Carter, T.R., M.L. Parry, S. Nishioka and H. Harasawa (eds.), 1994: Technical Guidelines for Assessing Climate Change Impacts and Adaptations. Report of Working Group II of the Intergovernmental Panel on Climate Change, University College London, UK and Centre for Global Environmental Research, Tsukuba, Japan, x+59 pp. De la Vega-Leinert, A.C., R.J. Nicholls and R.S.J. Tol (eds.), 2000a: Proceedings of the SURVAS Expert Workshop on European Vulnerability and Adaptation to Accelerated Sea-Level Rise. Hamburg, Germany, 19-21 June 2000, Flood Hazard Research Centre, Middlesex University, Enfield, UK, viii+152 pp. De la Vega-Leinert, A.C., R.J. Nicholls, A. Nasser Hassan and M. El-Raey (eds.), 2000b: Proceedings of the SURVAS Expert Workshop on African Vulnerability and Adaptation to Accelerated Sea-Level Rise. Cairo, Egypt, 5-8 November 2000, Flood Hazard Research Centre, Middlesex University, Enfield, UK, vi+104 pp. DINAS-COAST Consortium, 2004: DIVA 1.0. Potsdam Institute for Climate Impact Research, Potsdam, Germany, CD-ROM. F¨ ussel, H.-M. and R.J.T. Klein, 2006: Climate change vulnerability assessments: an evolution of conceptual thinking. Climatic Change, in press. Ganopolski, A., V. Petoukhov, S. Rahmstorf, V. Brovkin, M. Claussen, A. Eliseev and C. Kubatzki, 2001: CLIMBER-2: a climate system model of intermediate complexity. Part II: model sensitivity. Climate Dynamics, 17, 735-751. Gornitz, V.M., R.C. Daniels, T.W. White and K.R. Birdwell, 1994: The development of a coastal risk assessment database: vulnerability to sea-level rise in the U.S. Southeast. Journal of Coastal Research, special issue 12, 327-338. Hinkel, J., 2005: DIVA: an iterative method for building modular integrated models. Advances in Geosciences, 4, 45-50. Hoozemans, F.M.J., M. Marchand and H.A. Pennekamp, 1993: Sea Level Rise: A Global Vulnerability Assessment: Vulnerability Assessments for Population, Coastal Wetlands and Rice Production on a Global Scale. Second revised edition. Delft Hydraulics and Rijkswaterstaat, Delft and The Hague, The Netherlands, xxxii+184 pp. Ionescu, C., R.J.T. Klein, K.S. Kavi Kumar, J. Hinkel and R. Klein, 2005: Towards a Formal Framework of Vulnerability to Climate Change. NeWater Working Paper 2 and FAVAIA Working Paper 1, Potsdam Institute for Climate Impact Research, Potsdam, Germany, ii+20 pp. 18
IPCC CZMS, 1992: A common methodology for assessing vulnerability to sea-level rise. Second revision. In: Global Climate Change and the Rising Challenge of the Sea, Report of the Coastal Zone Management Subgroup, Response Strategies Working Group of the Intergovernmental Panel on Climate Change, Ministry of Transport, Public Works and Water Management, The Hague, The Netherlands, Appendix C, 27 pp. Kay, R.C. and J.E. Hay, 1993: A decision support approach to coastal vulnerability and resilience assessment: a tool for integrated coastal zone management. In: Vulnerability Assessment to Sea-Level Rise and Coastal Zone Management, R.F. McLean and N. Mimura (eds.), Proceedings of the IPCC/WCC’93 Eastern Hemisphere Workshop, Tsukuba, Japan, 3-6 August 1993, Department of Environment, Sport and Territories, Canberra, Australia, pp. 213-225. Klein, R.J.T., 2002: Coastal Vulnerability, Resilience and Adaptation to Climate Change: An Interdisciplinary Perspective. PhD thesis, Christian-Albrechts-Universit¨at zu Kiel, Germany, ix+133 pp. Klein, R.J.T. and R.J. Nicholls, 1998: Coastal zones. In: Handbook on Methods for Climate Change Impact Assessment and Adaptation Strategies, J.F. Feenstra, I. Burton, J.B. Smith and R.S.J. Tol (eds.), Version 2.0, United Nations Environment Programme and Institute for Environmental Studies, Vrije Universiteit, Nairobi, Kenya and Amsterdam, The Netherlands, pp. 7.1-7.35. Klein, R.J.T. and R.J. Nicholls, 1999: Assessment of coastal vulnerability to climate change. Ambio, 28(2), 182-187. McCarthy, J.J., O.F. Canziani, N.A. Leary, D.J. Dokken and K.S. White (eds.), 2001: Climate Change 2001: Impacts, Adaptation and Vulnerability. Contribution of Working Group II to the Third Assessment Report of the Intergovernmental Panel on Climate Change, Cambridge University Press, Cambridge, UK, x+1032 pp. McFadden, L., R.J. Nicholls, A.T. Vafeidis and R.S.J. Tol, 2006: A methodology for modelling coastal space for global assessment. Journal of Coastal Research, in press. Naki´cenovi´c, N. and R. Swart (eds.), 2000: Emissions Scenarios. Special Report of Working Group III of the Intergovernmental Panel on Climate Change, Cambridge University Press, Cambridge, UK, x+599 pp. Nicholls, R.J., 1995: Synthesis of vulnerability analysis studies. In: Proceedings of the World Coast Conference 1993, P. Beukenkamp, P. G¨ unther, R.J.T. Klein, R. Misdorp, D. Sadacharan and L.P.M. de Vrees (eds.), Noordwijk, The Netherlands, 1-5 November 1993, Coastal Zone Management Centre Publication 4, National Institute for Coastal and Marine Management, The Hague, The Netherlands, pp. 181-216. Nicholls, R.J., 2002: Analysis of global impacts of sea-level rise: a case study of flooding. Physics and Chemistry of the Earth, Parts A/B/C, 27(32-34), 14551466. Nicholls, R.J., 2004: Coastal flooding and wetland loss in the 21st century: changes 19
under the SRES climate and socio-economic scenarios. Global Environmental Change: Human and Policy Dimensions, 14(1), 69-86. Nicholls, R.J., R.J.T. Klein and R.S.J. Tol, 2006: Managing coastal vulnerability and climate change: a national to global perspective. In: Managing Coastal Vulnerability: An Integrated Approach, L. McFadden, R.J. Nicholls and E.C. Penning-Rowsell (eds.), Elsevier Science, Amsterdam, The Netherlands, this volume. O’Brien, K., S. Eriksen, A. Schjolden and L. Nygaard, 2004: What’s In a Word? Conflicting Interpretations of Vulnerability in Climate Change Research. Working Paper 2004:04, Center for International Climate and Environmental Research Oslo, University of Oslo, Norway, iii+16 pp. Petoukhov, V., A. Ganopolski, V. Brovkin, M. Claussen, A. Eliseev, C. Kubatzki and S. Rahmstorf, 2000: CLIMBER-2: a climate system model of intermediate complexity. Part I: model description and performance for present climate. Climate Dynamics, 16, 1-17. Stive, M.J.F., M. Capobianco, Z.B. Wang, P. Ruol and M.C. Buijsman, 1998: Morphodynamics of a tidal lagoon and the adjacent coast. In: Physics of Estuaries and Coastal Seas, J. Dronkers and M. Scheffers (eds.), Balkema, Rotterdam, The Netherlands, pp. 397-407. Vafeidis, A.T., R.J. Nicholls, L. McFadden, R.S.J. Tol., J. Hinkel, T. Spencer, P.S. Grashoff, G. Boot, 2006: A new global coastal database for impact and vulnerability analysis to sea-level rise. Journal of Coastal Research, in review.
20