VOLGEO-05394; No of Pages 25 Journal of Volcanology and Geothermal Research xxx (2014) xxx–xxx
Contents lists available at ScienceDirect
Journal of Volcanology and Geothermal Research journal homepage: www.elsevier.com/locate/jvolgeores
Integrating multidisciplinary science, modelling and impact data into evolving, syn-event volcanic hazard mapping and communication: A case study from the 2012 Tongariro eruption crisis, New Zealand Graham S. Leonard a,⁎, Carol Stewart a,b, Thomas M. Wilson c, Jonathan N. Procter b, Bradley J. Scott a, Harry J. Keys d, Gill E. Jolly a, Johnny B. Wardman c, Shane J. Cronin b, Sara K. McBride a a
GNS Science, PO Box 30 368, Lower Hutt 5040, New Zealand Volcanic Risk Solutions, Institute of Agriculture and Environment, Massey University, Private Bag 11 222, Palmerston North, New Zealand c Department of Geological Sciences, University of Canterbury, Private Bag 4800, Christchurch 8140, New Zealand d Department of Conservation, Private Bag, Turangi 3334, New Zealand b
a r t i c l e
i n f o
Article history: Received 25 March 2014 Accepted 15 August 2014 Available online xxxx Keywords: Volcanic hazards Volcanic impacts Emergency management Communication Hazard maps Collaboration Te Maari eruption Tongariro Volcano Disaster resilience
a b s t r a c t New Zealand's Tongariro National Park volcanoes produce hazardous eruptions every few years to decades. On 6 August 2012 the Te Maari vent of Tongariro Volcano erupted, producing a series of explosions and a fine ash of minor volume which was dispersed rapidly to the east. This manuscript presents a summary of the eruption impacts and the way these supported science communication during the crisis, particularly in terms of hazard map development. The most significant proximal impact was damage from pyroclastic surges and ballistics to the popular and economically-important Tongariro Alpine Crossing track. The only hazard to affect the medial impact zone was a few mms of ashfall with minor impacts. Field testing indicated that the Te Maari ash had extremely low resistivity when wetted, implying a very high potential to cause disruption to nationally-important power transmission networks via the mechanism of insulator flashover. This was not observed, presumably due to insufficient ash accumulation on insulators. Virtually no impacts from distal ashfall were reported. Post-event analysis of PM10 data demonstrates the additional value of regional air quality monitoring networks in quantifying population exposure to airborne respirable ash. While the eruption was minor, it generated a high level of public interest and a demand for information on volcanic hazards and impacts from emergency managers, the public, critical infrastructure managers, health officials, and the agriculture sector. Meeting this demand fully taxed available resources. We present here aspects of the New Zealand experience which may have wider applicability in moving towards improved integration of hazard impact information, mapping, and communication. These include wide use of a wiki technical clearinghouse and email listservs, a focus on multi-agency consistent messages, and a recently developed environment of collaboration and alignment of both research funding and technical science advice. Hazard maps were integral to science communication during the crisis, but there is limited international best practice information available on hazard maps as communication devices, as most volcanic hazard mapping literature is concerned with defining hazard zones. We propose that hazard maps are only as good as the communications framework and inter-agency relationships in which they are embedded, and we document in detail the crisis hazard map development process. We distinguish crisis hazard maps from background hazard maps and ashfall prediction maps, illustrating the complementary nature of these three distinct communication mechanisms. We highlight issues that arose and implications for the development of future maps. © 2014 Elsevier B.V. All rights reserved.
1. Introduction Natural hazard impact assessment and communication mechanisms are important inter-related factors in improving community resilience or adaptive capacity for Disaster Risk Reduction (DRR) or Disaster Risk Management (DRM) (Paton et al., 2001a,b). Disaster risk reduction and management is core to the New Zealand Civil Defence and ⁎ Corresponding author. Tel.: +64 4 570 4799, +64 21 306 078 (Mobile). E-mail address:
[email protected] (G.S. Leonard).
Emergency Management Act (CDEM Act, 2002) and is part of the Hyogo Framework for Action 2005–2015's second priority of “Identify, assess and monitor disaster risks and enhance early warning” (United Nations, 2005), which explicitly includes the mapping of natural hazards. Here we use the 2012 Te Maari eruptions as a case study of the use of impact data to support communication mechanisms (with a focus on hazard maps) during a volcanic crisis. Effective risk management relies on communication between scientists, emergency managers and the public based on clear, consistent and reliable information (Barclay et al., 2008; Haynes et al., 2008a,b;
http://dx.doi.org/10.1016/j.jvolgeores.2014.08.018 0377-0273/© 2014 Elsevier B.V. All rights reserved.
Please cite this article as: Leonard, G.S., et al., Integrating multidisciplinary science, modelling and impact data into evolving, syn-event volcanic hazard mapping and communication..., J. Volcanol. Geotherm. Res. (2014), http://dx.doi.org/10.1016/j.jvolgeores.2014.08.018
2
G.S. Leonard et al. / Journal of Volcanology and Geothermal Research xxx (2014) xxx–xxx
McGuire et al., 2009). Adequate risk perception is an important step towards the public and emergency managers choosing to take appropriate risk management actions. Perception varies depending on individual exposure to impacts (Johnston et al., 1999) along with the quality and nature of information received. Developing and maintaining trust and a common understanding of hazard and risk are both important as a basis for appropriate risk mitigation decisions (Paton et al., 2008), and are also challenging (De la Cruz-Reyna and Tilling, 2008). If confusion, misunderstandings or lack of trust occur the public will seek alternative, often informal, information instead (Haynes et al., 2008b; Paton et al., 2008). During a crisis there are now rapidly expanding pathways for the public and relevant agency staff to request hazard information, and for emergency managers and scientists to disseminate information. These pathways follow now-ubiquitous internet access and social media use in homes and over mobile devices (Mersham, 2010; Mersham and Theunissen, 2011). The speed of that communication is virtually instantaneous, and with that speed comes an increasing expectation for information to be current, or at least frequently updated, and for requests to be quickly answered. With the expanding variety of communication channels, message consistency has become increasingly important and increasingly challenging. At the time of the 2012 Te Maari eruptions, the volcanic risk management context in New Zealand had been dominated by a sustained (nearly 20 year) drive to increase volcanic eruption preparedness in New Zealand following the 1995–96 Ruapehu eruptions (Johnston et al., 2000). Substantial advances had been made in volcanic surveillance coverage and capability with the introduction of the GeoNet project (Section 2.1). Knowledge gaps were being addressed through central and regional government investment in research programmes investigating eruptive histories for New Zealand volcanoes; and in better defining and understanding volcanic impacts on critical infrastructure and key economic sectors, such as primary industries (Section 4.4; Wilson et al., 2012). Improvements occurred in both emergency management arrangements and delivery of science information to inform end-user decision making. These involved science integration with emergency management planning and operations (Paton et al., 1998) and, particularly in years before and after a large breakout lahar from Ruapehu's Crater Lake, better integration between responding agencies (Keys and Green, 2008). Hence, once the small scale of the Te Maari eruptions became apparent, beyond the on-going life safety issues at proximal distances, it was still an ideal opportunity for government, communities, emergency managers and scientists to work together operationally to test response arrangements. The event allowed the positioning of resources, and identified the level of additional planning and support necessary to manage future larger or more sustained eruptions.
hazard mapping. This remains a disparity in both the literature and in practice during volcanic crises. MIAVITA (2012) discuss evacuation mapping under another section, without linkage to the extensive hazard mapping section. Given that published hazard maps are one of the first and most widely accessed information resources for warnings and emergency response, the linkage to end-users and their varying needs should be paramount. Three types of hazard map — background, crisis, and ashfall prediction hazard maps — have previously been used within Tongariro National Park (TNP, which includes Tongariro, Ngauruhoe and Ruapehu volcanoes, Fig. 1), providing a basis for their application across northern Tongariro Volcano (hereafter ‘Tongariro’, which includes the Te Maari
1.1. Volcanic hazard maps Hazard and risk maps are widely used for natural hazard planning and communication (e.g. flooding, Handmer and Milne, 1981; Osti et al., 2008; landslides, Pachauri and Pant, 1992; seismic/earthquake, Frankel, 1995; seismic triggering of landslides, Jibson et al., 2000). The comparatively limited volcano hazard mapping literature has been mostly focussed on the method used for defining hazard zones (e.g. Orsi et al., 2004; Saucedo, et al., 2005; Alberico et al., 2008; Macías et al., 2008; Alatorre-Ibargüengoitia et al., 2012; MIAVITA, 2012) despite the importance of maps for communication and the difficulties in designing clear maps for that purpose (Haynes et al., 2007; Leonard et al., 2008; Nave et al., 2010). For example MIAVITA (2012; the European Commission ‘MItigate and Assess risk from Volcanic Impact on Terrain and human Activities’ project) propose a standardised method for mapping each volcanic hazard in detail. However, there rarely is a discussion of the role of hazard maps in communication and emergency response. Evacuation zones are often mapped in a volcanic crisis, but there is little pre-event planning of the linkage to volcanic
Fig. 1. (a) Location map of the Te Maari vent within the central North Island and the distribution of ash (from Pardo et al., this volume) from the August 2012 eruption; (b) proximal impacts from the eruption (ballistics from Breard et al., this volume; surges from Lube et al., this volume; debris flow from Procter et al., this volume) and local critical infrastructure. Note secondary lahars are shown in Fig. 11 of Jolly et al. (2014a). Infrastructure and places mentioned in text are labelled. SH = State Highway. Base shaded elevation model, hydrological and cultural features are from Land Information New Zealand.
Please cite this article as: Leonard, G.S., et al., Integrating multidisciplinary science, modelling and impact data into evolving, syn-event volcanic hazard mapping and communication..., J. Volcanol. Geotherm. Res. (2014), http://dx.doi.org/10.1016/j.jvolgeores.2014.08.018
G.S. Leonard et al. / Journal of Volcanology and Geothermal Research xxx (2014) xxx–xxx
vent) in 2012. The latest iterations of the Ruapehu background hazard maps were produced from 2003 onwards (GNS Science (compiler), 2004, 2005, 2008), and include hazard zones and instructional text. Ruapehu hazard maps are based only on the single Crater Lake vent as active — it is the only vent from which lava flows or pyroclastic deposits have been erupted from since the mid-Holocene. A background hazard map for Tongariro was developed from 2005 based on multiple ‘active’ vents (GNS Science (compiler), 2007a; see Section 5.1). Background hazard maps are widely posted throughout TNP, at local businesses and within communities to provide information on the noticeable precursors and locations of volcanic hazard, and of the best life-safety actions to take, in the event of sudden onset of unrest or an eruption. They intend to cover the mapped extent of hazards, what those hazards are, and what action to take and when. The maps form a series and all have a consistent layout template. They are produced by GNS Science in conjunction with DOC and with input from university scientists and other emergency managers. These background hazard maps were tested in small Ruapehu eruptions in 2006 and 2007 (Kilgour et al., 2010) and generally they were understood well. A key outcome was recognition in 2007 that there was a need for a distinct, event-specific crisis hazard map to give messages specific to shortterm heightened risks particular to the crisis, with instructions to stay away from the highest hazard zones (GNS Science (compiler), 2007b). Finally, ashfall prediction maps were in use during the 1995–96 eruption sequence at Ruapehu, which included the last significant New Zealand ashfalls prior to 2012. They are produced for all New Zealand volcanoes daily and available to use for communication in the event of an eruption or eruption forecast. 1.2. Past-event, deterministic or probabilistic? Three main categories of hazard zone are generally used to draw hazard and risk maps: (1) Past event zones envelop the spatial distribution of one or many previous hazard events, usually determined geologically (forensically) or by historic records. (2) Deterministic zones take a potential future scenario, and model what would happen for that given vent location, event size, eruption parameters and topography. (3) Probabilistic zones are produced by aggregating a very large number of scenarios, each generated by sampling a reasonable range of each models' input parameters (e.g., vent location, event sizes, eruption parameters and topography); each iteration is effectively one deterministic scenario. Collectively, these probabilistically-generated scenarios effectively span the full expected suite of outcomes that may occur in a future eruption. The stacked scenarios can then be used to calculate probability of a particular hazard impacting a given point; for example, if 10% of the probabilistically-generated models produce lava flow in an area, that area could be interpreted to have a 10% probability of lava flow inundation in a future eruption. The resulting zone may be coloured or shaded by the varying likelihood of the hazard affecting parts of the zone; alternatively, a specific probability of being affected may be selected (e.g., 5% chance of being impacted by lava flows) and a zone contouring the area affected at that or higher probability. The latter approach is used in the calculations described in Jolly et al. (2014a). In practice, output maps that claim to be probabilistic are often limited to a few representative values for vent location, event size, and/or eruption parameters because of the vast number of scenarios that occur when multiplying the combination of these variables. For example, Alberico et al. (2008) take into account a wide probabilistic distribution of vent locations but use only two representative event scales at each location.
3
1.3. Definitions Definitions of hazard, risk and communication can vary widely. In this paper we define a ‘volcanic hazard’ as a volcanic process with the potential to affect humans or their assets, including the probability of its occurrence (Fournier d'Albe, 1979; UNISDR, 2009). We define ‘risk’ as a function of the probability of a hazardous process and its consequences (based on Fournier d'Albe, 1979). This is consistent with the risk management approach of Jolly et al. (2014a). We use the term ‘communications’ to include (1) a documented role within emergency management teams (within ‘incident management systems’), (2) ‘public awareness’ (UNISDR, 2009) and (3) ‘risk communication’ (summaries in Bier, 2001; Fischhoff, 1995). 2. Volcano monitoring and emergency management in New Zealand During a volcanic crisis there are a wide range of New Zealand agencies that need to communicate clearly, consistently and promptly with each other. We provide a brief overview of agencies discussed here; the detailed roles of these agencies are explained in Section 2.1 of Jolly et al. (2014a). New Zealand operates under a two-tier government structure: central government (ministries and departments) and local government (local authorities — regional councils and territorial authorities). The Ministry of Civil Defence & Emergency Management (MCDEM) coordinates responses to most emergencies at a national level, while CDEM Groups have the same role at a regional level. CDEM Groups include constituent local authorities and partner agencies (such as emergency services, government departments, and lifeline utilities). Lead responsibility for hazards and risk management in TNP lies with the Department of Conservation (DOC). Most volcano science research in New Zealand is conducted by staff at universities and at GNS Science, the government-owned natural hazard research institute that monitors geological hazards through the GeoNet project (henceforth ‘GeoNet’). 2.1. Communication of volcanic warnings GNS Science provides Volcanic Alert Bulletins to MCDEM, CDEM Groups, national lifelines, other responding agencies and the media, as the primary means of communication of warnings and eruption information. Bulletins are transmitted via the MCDEM National Warning System to CDEM Group members, with direct messages to these members as a redundancy measure. As well as this statutory advice role, GNS Science and GeoNet have a public profile as an authoritative source for hazard and risk information, particularly following the 2010–12 Canterbury earthquake sequence. The public sees the same information via the GeoNet website and social media postings. All audiences receive bulletins at the same time, but key emergency management agencies receive telephone calls from GNS Science ahead of bulletin generation. Bulletins usually contain two core categories of information: (1) a description of the situation at a specific volcano, often including a summary of monitoring data, implications and sometimes a forecast of potential future scenarios that may unfold; and (2) a Volcanic Alert Level from a table that gives a description of indicative phenomena and volcano status for each level. The New Zealand Volcanic Alert Level table is defined in the “Guide to the National CDEM Plan” (MCDEM, 2009, Section 19.4.2). Bulletins may also include ashfall predictions (if issued) or new releases of hazard maps or both. Management of volcanic ash risk in New Zealand's aviation sector follows the New Zealand Civil Aviation Authority (CAA) regulations (Lechner, 2014) and international protocols (International Civil Aircraft Organisation; ICAO). The NZ regulations restrict airspace in relation to the Volcanic Alert Level, and rely on the operators (e.g. airlines) providing a safe operating plan to CAA. The dissemination of volcanic ash advisories and maps (Section 5.3) for aviation is undertaken by the local Volcanic Ash Advisory Centre (VAAC), in New Zealand's case this
Please cite this article as: Leonard, G.S., et al., Integrating multidisciplinary science, modelling and impact data into evolving, syn-event volcanic hazard mapping and communication..., J. Volcanol. Geotherm. Res. (2014), http://dx.doi.org/10.1016/j.jvolgeores.2014.08.018
4
G.S. Leonard et al. / Journal of Volcanology and Geothermal Research xxx (2014) xxx–xxx
is the Wellington VAAC at the New Zealand MetService (the national weather forecasting agency, henceforth ‘MetService’), with advice from GNS Science and GeoNet (Scott and Travers, 2009). 2.2. National volcano science coordination Four regional volcanic advisory groups have been formed by regional CDEM groups in cooperation with relevant scientists from a variety of institutions. Establishment of the advisory groups is consistent with recommendations for better coordination and planning (e.g. Paton et al., 1998) following the last major TNP eruption episode in 1995–96. The group covering the TNP is termed the Central Plateau Volcanic Advisory Group (Jolly et al., 2014a). MCDEM has also set up a National Volcanic Science Advisory Panel (NVSAP) of university and government research institute scientists to provide advice during a crisis. During a crisis the NVSAP is convened by GNS Science. Members have agreed to the principles, objectives and methodology outlined in the terms of reference for the panel. Coming to such an agreement is consistent with recommendations from the IAVCEI Subcommittee for Crisis Protocols (1999). The 2012 eruptions were the first eruption response since the inception of NVSAP and the first test of Central Plateau Advisory Group planning activities in an eruption. Much of the New Zealand domestic volcanic hazard research is funded through, or aligned to, the collaborative Natural Hazards Research Platform (Jolly et al., 2014a). Many of the scientists within NVSAP and the Advisory Group are also part of the Platform, providing a further mechanism for aligning research before and during crises. Platform-funded scientists conducted a large proportion of the impact research presented in Section 3.2. 2.3. Human and animal health Despite the lack of volcanic ashfall, concerns about potential health impacts from the 2012 eruptions created significant public, media and emergency management information demands. During the 1995– 1996 eruptions of Mt Ruapehu, ashfall over much of the central and eastern parts of the North Island led to urgent information requests from government agencies, public health officials, community leaders, farming agencies and fertiliser industry advisors (Paton et al., 1998). To meet this need, a rapidly assembled panel of scientific advisors was convened for human health advice (Weinstein and Patel, 1997). A similar panel, comprising animal health experts and soil and environmental scientists, was convened to provide agricultural advice (e.g. Cronin et al., 1997a, 1998). Subsequently, some of the lessons learned from the eruption (e.g., Weinstein and Patel, 1997; Hickling et al., 1999), were published for the health sector as policy reports for the Ministry of Agriculture (Neild et al., 1998) and the veterinary community (Gregory and Neall, 1996; Cronin et al., 1997b). 3. Progression and impacts of the 2012 Tongariro eruption sequence 3.1. Sequence of events Tongariro, sited within the UNESCO World Heritage Area of TNP, New Zealand, erupted briefly in 2012 after about 80 years of inactivity (Scott et al., this volume) and following volcanic earthquakes in preceding weeks (Hurst et al., this volume). At 23:52 (local time) on 6 August the Te Maari vent (Fig. 1) produced a series of explosions and a minor volume of tephra (~5 × 10⁵ m3, Pardo et al., this volume). The eruption initially produced surges directed to the east then west in extensive contact with the ground for 1.5 to 2 km, followed by a third verticallydirected blast to a height of at least 6 km (Crouch et al., this volume), which dispersed ash in an easterly direction to distances of at least 200 km (Lube et al., this volume; Pardo et al., this volume; Fig. 1a). The erupted clasts were mostly derived from previously erupted volcanic rock, some altered by an active geothermal system (Pardo et al., this volume). Jolly et al. (2014a) provide a detailed sequence of events for
the eruption (with further specifics in Crouch et al., this volume; Fournier and Jolly, this volume; Jolly et al., 2014-b,c), and of the science and management response in their Appendix 1. The 6 August eruption was witnessed by local residents living along State Highway 46 on the northern side of the volcano (Lube et al., this volume; Fig. 1b). Residents alerted local emergency managers and most soon self-evacuated as per a community plan (Jolly et al., 2014a). New Zealanders awoke to their first mainland ashfall in 16 years, and there was widespread interest in the distribution and potential impacts of the ash. In the days following the 6 August eruption there was demand for impact and hazard information from emergency managers, the public, critical infrastructure managers, health officials, and the agriculture sector. We cover the impacts first in order to give some narrative for the eruption; to set the context of impact scale (which was relatively small) highlighting in contrast the significant communication effort that was needed. Te Maari produced a second much smaller eruption on 21 November 2012, which did not produce significant ashfall beyond the park boundary. Unless otherwise stated this manuscript primarily considers the larger 6 August eruption (henceforth ‘the Te Maari eruption’ or simply ‘the eruption’); where the smaller 21 November eruption is referred to it is explicitly named. 3.2. Eruption impacts and data collection The impacts of the Te Maari eruption were relatively minor because of the small scale of this eruption and its occurrence at a time of day when no-one was within 4 km of the vent. Impacts are documented here including both direct physical impacts and flow-on social impacts. They occurred on different spatial scales as follows: (1) Proximal impacts were constrained to the near-vent region (b5 km; Fig. 1b) within TNP and were related to pyroclastic surge, ballistic, debris avalanche, lahar and blast hazards. (2) Medial impacts due to ashfall were minor and occurred beyond the proximal impact zone but still relatively close to the volcano, at distances of approximately 5–15 km (Fig. 1b). (3) Distal impacts due to dispersion of gases and ash were slight, with disruption from ash restricted to the aviation sector, but elicited substantial media and public attention. These occurred beyond the medial zone, at distances N~15 km (Fig. 1a). 3.2.1. Proximal impacts Proximal impacts of the Te Maari eruption include ballistic impacts (Fitzgerald et al., this volume; Breard et al., this volume) eruption surge impacts (Lube et al., this volume; Efford et al., this volume), Debris Avalanche impacts (Proctor et al., this issue) and lahar and ashfall impacts (Jolly et al., 2014a) and are summarised in Table 1, separated into impacts on the Tongariro Alpine Crossing (TAC) track and the wider TNP. The proximal impacts and ongoing hazard generated significant media interest and constituted a significant component of scientific response beyond the first few days and weeks after the eruption, as it became safer to work in this area for limited periods. The most significant impact of the eruption was the damage and subsequent closure of the TAC track. This popular walking track is trekked by up to 80,000 people annually, growing at 10% p.a., and directly supports N 30 businesses (Jolly et al., 2014a). The TAC track was damaged by pyroclastic surge and ballistics during the eruption (Fig. 1b) which would have led to mass casualties if it had occurred during the day in warm fine weather. Further details, including risk calculation, considerations of ‘acceptable risk’ and risk management at these proximal distances are discussed by Jolly et al. (2014a). 3.2.2. Medial impacts The medial area (ashfall area on Fig. 1b; Pardo et al., this volume) is sparsely populated, with scattered households along State Highway 46 and at Lake Rotoaira. Nationally-important infrastructure traverses the
Please cite this article as: Leonard, G.S., et al., Integrating multidisciplinary science, modelling and impact data into evolving, syn-event volcanic hazard mapping and communication..., J. Volcanol. Geotherm. Res. (2014), http://dx.doi.org/10.1016/j.jvolgeores.2014.08.018
G.S. Leonard et al. / Journal of Volcanology and Geothermal Research xxx (2014) xxx–xxx
5
Table 1 Summary of proximal impacts of the 2012 Te Maari eruption. Hazard
Tongariro Alpine Crossing
Wider Tongariro National Park
References
Pyroclastic density current (surge) Ballistics
3.7 km of track inundated, destroying or searing vegetation and depositing a thin (b0.3 m) deposit of ash and lapilli. 1.5 km of track impacted by ballistics. Hut severely damaged by direct ballistic impacts.
Some inundation. Vegetation damage. Some inundation. Vegetation and soil damage.
Debris avalanche
No effect.
Lahar
200 m of track obliterated, 300 m seriously damaged, 500 m minor damage. Area inundated. Vegetation and soil damage, fertilisation effects.
Some inundation. Vegetation and soil damage. Some inundation. Vegetation and soil damage. Some inundation. Vegetation and soil damage, avifauna and introduced deer injured (no bodies confirmed). Smelt.
Lube et al. (this volume), Efford et al. (this volume). Breard et al. (this volume), Fitzgerald et al., (this volume), Jolly et al. (this volume). Procter et al. (this volume).
Ashfall
Gas
Smelt.
area, in particular State Highways and sections of the national highvoltage electricity transmission network. Tongariro–Rangipo Prison is also located in the area, with a camp located ~ 11 km northeast of the Te Maari vent that houses ~50 prisoners and associated staff (locations on Fig. 1b). A significant proportion of the scientific response within the first few days of the eruption, especially from universities, was directed at documenting the ashfall within this medial distance. This is because the critical infrastructure corridor sits in this area, but it was also an area of convenient access — the proximal area was initially unsafe and the distal area is covered in dense forest for some tens of kilometres. The only hazard to affect the medial impact zone was a few mms of ashfall (Pardo et al., this volume). Because of the limited literature, thin ashfalls remain a source of uncertainty for emergency management planning and loss assessment models (Wilson et al., 2012). Thin ashfall impacts are thus documented here as an example of low hazard intensity, to help define no-effects thresholds in fragility relationships between hazard and impact. Ashfall impacts on electricity generation, transmission and distribution, roading networks, aviation, a local water supply and wastewater treatment system, buildings and facilities, and agriculture are documented in Table 2. As expected from such a small eruption producing a small volume of ash, impacts were both minor and short-term. For some sectors, mitigation actions taken may have acted to reduce impacts (Table 2). In other cases, impacts may have been mitigated by resilient design features. The infrastructure located nearest to the vent is the water supply system for Rangipo Prison; its raw water source is the Mangahouhounui Stream which drains the eastern side of Tongariro (Fig. 1b). This system has a number of resilient design features (Table 3), which contributed to the lack of impacts experienced. The rainy weather conditions following the ashfall may have also played a part in minimising impacts by washing away the ash. This is particularly likely to be the case for the accumulation of ash on pylon and substation insulators (see Table 2), where weather conditions are known to be a major influence on the probability of insulator flashover. We explore this phenomenon in more detail in Section 3.2.4 as this particular ash had the potential to affect the national electrical grid during this eruption. 3.2.3. Distal ash and gas impacts Fine ash was dispersed within hours to the east of the vent. It covered an area of ~ 1600 km2 in under an hour and travelled at least 100 km to reach the east coast of the North Island (Pardo et al., this volume; Turner et al., this volume; Fig. 1a). Mapping of the distal ashfall deposit area was based on presence/absence reports from local residents. Very thin ashfalls (b1 mm) were recorded and the only impacts recorded were to the aviation sector (Table 2). Two aviation impacts from distal ash arose: firstly an Air New Zealand (major regional commercial aircraft operator in New Zealand, henceforth ‘Air NZ’) turboprop aircraft received minor ashfall in Napier (Fig. 1a). It was cleaned effectively, but there was not a clear protocol as to whether it was appropriate to take off with the minor ash deposit (b0.5 mm) on
Jolly et al. (this volume), Procter et al. (this volume). Jolly et al. (this volume).
the runway. This was rapidly resolved with a decision made by operations that the very small ash volume was unlikely to substantially remobilise during take-off or to reduce traction so it would be safe to take off. Secondly, the on-going degassing of Te Maari raised some concerns with operators about safe operating procedures if aircraft encountered a volcanic gas cloud in flight, in particular managing encounters with an H2S or a SO2 plume, had these been detectable. Operation procedures have been revised within Air NZ and the management of volcanic gas plume encounters discussed with international partners at ICAO (Bob Fletcher, Head of Operations Support, Air NZ Ltd. pers. comm. 2014). ‘Sulphur smells’ were also widely reported over the following weeks. On 8 August, there were widespread reports of sulphur smells in the lower North Island and as far south as the northern South Island (Marlborough Express, 2012). Further reports of sulphur smells in the lower North Island occurred on 15 August (Horizons, 2012). After the eruption, the volcano entered a degassing phase and gases were dispersed by prevailing winds. The discussion of and concern about the smell was a minor but widespread social impact, but not an actual health impact. A monitoring flight carried out to survey volcanic gas emissions by GNS Science on 9 August reported emissions of 3900 tonnes per day of CO2, 2100 tonnes per day of SO2, and 364 tonnes per day of H2S (Volcanic Alert Bulletin TON-2012/18; GNS Science, 2012a,b). Hydrogen sulphide (H2S) odour perception is highly variable within the human population, ranging from 0.008 to 0.2 ppm (Beauchamp et al., 1984). The upper olfactory threshold is a factor of 100 lower than the minimum levels (~20 ppm) thought to initiate adverse health effects (Legator, 2001). H2S in air is not routinely monitored by regional councils in New Zealand thus no data are available on levels in population centres. Due to the very high sensitivity of human olfactory detection of H2S intermittent reports of a sulphur smell a long way downwind of the volcano were to be expected for months after the eruption. 3.2.4. Resistivity analysis Insulator flashover is the most common disruption to electrical power systems following ashfall, particularly for relatively thin accumulations of b 10 mm. A review of ash-induced insulator flashovers on power systems by Wardman et al. (2012) suggests that a failure threshold may exist of b 10 mm of ashfall, possibly as low as 3 mm; they also describe a method for determining the resistivity of volcanic ash. The primary controls on the likelihood of flashover are the coverage (in mass per unit area) of the insulator by ash and the electrical conductivity of the ash (usually described using the inverse unit of resistivity, units Ω·m). A number of factors influence ash resistivity, with the most important being moisture content, surface composition of the ash, and compaction of the deposit. Dry volcanic ash is non-conducting whereas wet ash may be highly conductive (low resistivity). Three freshly-fallen samples (NP-K2, TM002, and TM003) from the eruption were collected in the medial area (Fig. 1b; see Cronin et al., this volume, for a map of ash sampling sites). These samples were
Please cite this article as: Leonard, G.S., et al., Integrating multidisciplinary science, modelling and impact data into evolving, syn-event volcanic hazard mapping and communication..., J. Volcanol. Geotherm. Res. (2014), http://dx.doi.org/10.1016/j.jvolgeores.2014.08.018
Sector
Component or location
Ashfall received
Electricity generation
Rangipo Power Station
Catchment received between 0 and 10 mm of ashfall.
Electricity transmission (highvoltage)
Aviation
Water and wastewater treatment systems
Management response
Initial response was a precautionary shutdown of power station pending further information. Likely as a consequence of lessons learned from the 1995– 96 Ruapehu eruption sequence where ash-laden water caused severe and costly damage to turbines at the plant (Johnston et al., 2000). Visual inspections were made on morning of 7 August. Rangipo Power Station substation Substation insulators accumulated 0.5– None — ash was washed off by rainfall on 7–8 1 mm of ashfall. August. Pylon insulators accumulated up to Helicopter (with particle separator filters) Bunnythorpe–Tokaanu and Bunnythorpe– inspection flight along ash affected lines. No Wairakei 220 kV lines (lower North Island to 2 mm of ashfall. cleaning was deemed necessary on any central plateau) components as wind and rain removed most ash. Wairakei–Whirinaki 220 kV lines (Taupo to Pylon insulators accumulated b1 mm of Helicopter (with particle separator filters) Hawkes Bay) ashfall. inspection flight along ash affected lines. No cleaning was deemed necessary on any components as wind and rain removed most ash. Rangipo Power Station 33 kV distribution Pylon insulators accumulated to 2–3 mm Restoration of disrupted circuit. No other lines of ashfall. management response taken. SH 1 and SH46 Up to 2.5 mm. Electronic signboards displayed warning message about ashfall from 00:30 on 7 August. Contractor dispatched to assess situation. Precautionary road closure until 08:00 on 7 August. Over a 3–4 km stretch of SH46 ash was mechanically swept to the side of the road — it was not picked up and disposed of due to small volume. Road signs and reflectors were also cleaned with water blaster. Cost was ~ $500–1000/km for sweeping and cleaning. Napier Airport b0.1 mm ashfall. Air NZ turboprop plane was on the ground and received traces of ashfall. Aircraft was cleaned. However there was not a clear procedure on what to do for ash on the runway and taxi way (noting it was a small regional airport). Aircraft were cleaned and departed several hours late. North Island airspace Weak ash plume dispersed east of Wellington Volcanic Ash Advisory Centre issued Tongariro. warnings (SIGMET and Volcanic Ash Advisory) and increased operational tempo. The on-going gas emissions from Te Maari caused concerns about airspace management of volcanic gas plumes, requiring development of additional crew procedures. Stream intake was automatically shut down due to Tongariro/Rangipo Prison water supply Raw water source (Mangahouhounui turbidity threshold (20 NTU) being exceeded. Plant system Stream) contaminated by high levels of remained closed for one week while raw water was suspended ash from deposition in tested for contaminants. Stored water was used. catchment. Depth unknown. 2–3 mm.
None required
Buildings and facilities
Tongariro/Rangipo Prison wastewater treatment system Tongariro/Rangipo Prison
~3–4 mm ashfall at West Camp.
Agriculture
Pastoral farmland west of Rangipo on SH 46
2–5 mm.
Prison yards were swept with brooms then hosed down once full water supply was restored. Monitored by farmers, who feed some additional supplementary feed to exposed livestock. Ministry for Primary Industries and various industry groups actively monitored the event and disseminated risk management information.
Impacts recorded Generation shut down for ~16.5 h.
No loss of service or voltage fluctuations recorded. N1–2 mm of dry looking ash observed on top weathershed of vertical-string insulators. No loss of service or voltage fluctuations recorded. No apparent sign of flashover or leakage current. No loss of service or voltage fluctuations recorded. No apparent sign of flashover or leakage current.
Possible flashover at Rangipo. Minor fault which was restored rapidly. Road closure of SH1 for ~8 h. Traffic diversions and delays, minor visibility and traction problems. Road markings and sign coverage in areas with N1 mm of ash.
Delay in flight departure due to cleaning and uncertain procedure due to ash on runway and taxi way.
Some delays were caused to commercial air traffic due to ash and gas plume.
Labour costs for the plant operator were approximately doubled for the month of August. Despite water conservation measures being enforced, the prison began to experience water shortages towards the end of the week and additional water was brought on site by tankers. None recorded. Ash deposits tended to become cemented if not cleaned up promptly. Minor ash coverage of pastures. One farmed deer died.
G.S. Leonard et al. / Journal of Volcanology and Geothermal Research xxx (2014) xxx–xxx
Electricity distribution (lowvoltage) Road network
6
Please cite this article as: Leonard, G.S., et al., Integrating multidisciplinary science, modelling and impact data into evolving, syn-event volcanic hazard mapping and communication..., J. Volcanol. Geotherm. Res. (2014), http://dx.doi.org/10.1016/j.jvolgeores.2014.08.018
Table 2 Impacts of 6 August 2012 Te Maari ashfall, and management response, categorised by infrastructure sector.
G.S. Leonard et al. / Journal of Volcanology and Geothermal Research xxx (2014) xxx–xxx Table 3 Design featuresa contributing to resilience of Tongariro/Rangipo Prison water supply system to volcanic ashfall. Design feature
Comment
Gravity feed of raw water from intake Pump impellers are highly vulnerable to to plant. accelerated wear and tear from ash-laden intake water; systems that utilise gravity feed rather than electrical pumping are less vulnerable to this mode of damage. Automated shutdown of treatment This shutdown system limits the exposure plant at threshold of 20 NTUb. of treatment plant filtration system to ash-laden water. Ability to maintain production while Two sets of filtration equipment (pressure sand filters) operating in closing down filters alternately for maintenance. parallel. Water storage capacity of 6–7 days This allowed precautionary shutdown to supply. continue for several more days while testing of raw water source composition was carried out. Availability of alternative potable This option extended the time the plant water supplies (water tankers). could remain closed and utilise stored water. a Information provided by G. Stewart, Manager of Tongariro/Rangipo Prison water treatment plant. b Nephelometric turbidity units, a measure of suspended solids in water.
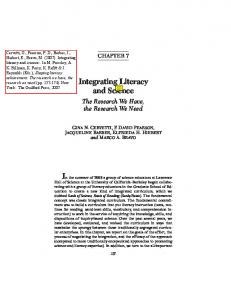
subjected to resistivity determinations following the procedure developed by Wardman et al. (2012). Resistivity measurements for these three samples, including compacted and uncompacted, ash, are shown in Fig. 2, with comparative data included for volcanic ash samples from other eruptions. The dry Tongariro ash samples were highly resistive, similar to other ashes, but when wetted, have the lowest-resistivity of any ash the authors have analysed to date (Fig. 2). These samples were also found to have high levels of readily-soluble salts (dominated by Ca2+ and SO2− 4 ) when leachate analyses were performed (below).
3.2.5. Leachate analysis Hazards due to leachable elements present on the surface of fresh ash were assessed using internationally-ratified methods (Stewart et al., 2013). Results of this work are presented in full in Cronin et al. (this volume). Problems encountered during the work included: the limited amounts of ash available for analysis; multiple demands for ash from different analysts; the health sector's requirement that
7
Table 4 Timeline for characterisation of leachable element properties of Te Maari ashfall from 6 August 2012. Date (2012)
Event
Monday 6 August Tuesday 7 August Wednesday 8 August
Eruption from Upper Te Maari vent, 23:50.
Friday 10 August
Field teams arrive in area and begin sampling at ~07:00. Samples arrive at Massey University laboratory at ~19:00. Extractions of ash to determine levels of leachable elements. Data for levels of available F available by ~19:00 and press statement issued for agricultural sector. Extracts sent to commercial laboratory for full characterisation of soluble components. Data received from laboratory at ~14:00. Briefing report given to Ministry of Health by 17:00.
accredited laboratories be used for analyses; and that no single laboratory had all the analytical tools needed to fully characterise the ash. Furthermore, there were unclear mechanisms for funding the work and this, coupled with the rapid timeframes required for decision making, led to increased laboratory costs for work performed under urgency. Since there was a lack of inter-agency preparation and planning, there were no pre-arranged mechanisms for coordinating, interpreting and disseminating results. Despite all of these problems, work was carried out with a very rapid turnaround time, due at least in part to the highly networked research community and the NHRP requirements for collaboration (Table 4). It remains to be seen whether an on-going crisis or an increase in the magnitude of eruptions would have stretched this adhoc system to breaking point. 4. Science communication during the 2012 crisis We describe the main science communication mechanisms used during the 2012 eruptions, and discuss current shortcomings and future improvements. We also summarise the material (which included impact information and hazard maps) communicated amongst scientists, and between scientists and emergency managers; health agencies; lifelines; DOC; aviation; media and the public, all of whom had distinct information needs. 4.1. Discussion and communication amongst scientists National Volcano Science Advisory Panel (Section 2.2) members and monitoring staff at GNS Science (hereafter ‘scientists’) were involved in
Fig. 2. Resistivity of moistened ash samples from the 6 August 2012 Tongariro eruptions (TM002, TM003 and NP-K2) compared to moistened ash samples from other eruptions (TM & NP, Te Maari 2012; GRIM, Grímsvötn 2011; EYJA, Eyjafjallajökull 2010; SHIL, xx year; RDBT, Redoubt 2009; CHTN, Chaitén, 2008; MRPI, Merapi 2006; RUAP, Ruapehu 1996).
Please cite this article as: Leonard, G.S., et al., Integrating multidisciplinary science, modelling and impact data into evolving, syn-event volcanic hazard mapping and communication..., J. Volcanol. Geotherm. Res. (2014), http://dx.doi.org/10.1016/j.jvolgeores.2014.08.018
8
G.S. Leonard et al. / Journal of Volcanology and Geothermal Research xxx (2014) xxx–xxx
a wide range of data collection, discussion and external communication. Scientists were included within regular (initially daily) volcanic science meetings convened by GNS Science, starting from detection of the preeruption unrest activity. This was effective at bringing a wide range of science expertise together and promoting collegial discussion amongst all scientists, but was time consuming. A password protected wiki (website that allows collaborative sharing and editing of information) was implemented as a virtual ‘technical clearing house’ on 7 August to allow all scientists to share and discuss scientific data. An agreement text (Appendix A) was added indicating the bounds within which data and access were governed in order to minimise accidental release of incomplete information without scientific discussion and also to safeguard intellectual property in relation to subsequent scientific publications. The structure evolved somewhat organically along scientific and monitoring data types. Generally feedback was very positive, and a wide range of members used and populated the wiki, which was in itself an indication of strong support for the wiki concept. The wiki was regularly referred to during discussion at the science meeting, with members referring to each other's data and comments on-screen as they talked. During the 2012 crisis it was deemed important not to modify the wiki structure much from day to day. This was to limit confusion, maximise the ability to find data in the same place for users, limit a possible loss of feeling of group ownership, and minimise any potential of users then losing interest in using the tool. A new improved template wiki structure (Table 5) is now in place that can be rolled out rapidly for
Table 5 The rationalised wiki structure for a virtual technical clearinghouse and consistent messaging hub that evolved from the 2012 eruptions. Technical clearinghouse and consistent message wiki structure Public consistent messages Science consistent message Daily updates Agencies' messages CDEM (and others) Defence Department of Conservation Fire service Health Infrastructure Police Agriculture Ash preparedness Future scenarios complete Hazard maps complete Human health Images & diagrams Lifelines support Science discussion Ash Ash collection Ashfall maps Ash impact new data Ash samples & analysis Ballistics Field work plans Flows Debris flows and lahars Lava Pyroclastic flows & surges Future scenarios discussion Geochemistry Geophysics [Geodesy, seismology, etc. to be added during eruption] Hazard map development Model of system Past eruptions & geology Presentations & images Public observations Remote sensing & meteorology
the next eruption. An email ‘listserv’ (a managed email distribution list) was set up for scientists to announce meetings and invite participants, and also to follow up actions and questions related to meetings. A separate listserv was set up for the coordination, handling and discussion of ash samples collected in the field and variously analysed around the country. 4.2. Consistent messaging and communication with emergency managers Jolly et al. (2014a) present a timeline of emergency management during the initial phase of the eruption response in both August and November 2012. There was substantial telephone and face-to-face communication amongst DOC, the Police, the Taupo District Council (TDC) Emergency Management Office, the regional CDEM Group, MCDEM Regional Emergency Management Advisors (REMAs), and GNS Science staff. Staff from various agencies attended coordination meetings, and media briefings were also organised as a part of these meetings. Distant emergency managers were briefed by GNS Science staff via video and audio conferences as needed, or as requested, by agencies. As the crisis evolved, the discussion and ratification of hazard maps between scientists and emergency managers (see Section 5.2) was facilitated via the above channels and also through substantial email traffic. A consistent messaging sub-section of the wiki (Section 4.2) was opened up to all emergency management, health, agriculture and critical infrastructure agencies. Access was password-protected. Contributions were restricted to messages approved for public distribution with a clear attribution to the agency responsible, along with updated messages from GNS Science. Benefits of this approach were (1) that all agencies and scientists could view these messages and discuss/resolve any inconsistencies; (2) agency staff were less likely to regard themselves as being ‘in the dark’ and (3) that it minimised the chances of outdated or inaccurate messages being accidentally promulgated. 4.3. Communication with human health and agricultural agencies During and following the Te Maari eruption sequence, there was strong public, media, and institutional interest in the hazardous characteristics of the ash for both human health and agriculture. The same agencies that were active in 1995–1996 were newly alerted and seeking information, although often with little, selective, or no, institutional memory (Section 2.3). Communication channels were rapidly established with the Ministry of Health's Emergency Management team via phone call and email. This relationship had not been maintained in recent years (Section 2.3). Analysis of the leachable element content of the volcanic ash commenced on 8 August (Section 3.2.5) and the initial message to the health sector was that the impact area was small and the ash layer was relatively thin. Emergency managers arranged for fire appliances to hose down the few houses with ash on their roofs and clean out and refill rainwater tanks, effectively mitigating risks to drinking-water supplies from leachable elements such as fluorine (F). Results of the leachate analyses were communicated to health officials on 10 August. While the ash contained moderate levels of water-soluble F, the hazard to human health was limited by the small volume of ash produced (Cronin et al., this volume). Characterising the ashfall for its potential to cause respiratory hazards was not carried out for the Te Maari eruption due to the limited distribution of the ash and lack of population centres affected, but would be necessary with a larger volume of ash. In general, the eruption prompted renewed liaison with the health sector, and long term sustained ash testing arrangements and consistent messaging plans across Ministry of Health, MCDEM and scientists is now underway. Based on pre-existing and regularly-maintained relationships developed through impact research, scientists from Canterbury and Massey universities made immediate contact with Ministry of Primary Industries (MPI) early on 7 August to provide an update of scientific
Please cite this article as: Leonard, G.S., et al., Integrating multidisciplinary science, modelling and impact data into evolving, syn-event volcanic hazard mapping and communication..., J. Volcanol. Geotherm. Res. (2014), http://dx.doi.org/10.1016/j.jvolgeores.2014.08.018
G.S. Leonard et al. / Journal of Volcanology and Geothermal Research xxx (2014) xxx–xxx
activities. MPI supports and protects the agriculture, forestry, fisheries and food-safety sectors in New Zealand. Within several hours those scientists were participating in teleconferences with a range of primary production industry groups, including both pastoral and horticultural sectors. Specifically, there was great interest in levels of available fluorine (F) because of reported livestock deaths from fluorosis as a consequence of the 1995–1996 eruptions of Mt Ruapehu (Cronin et al., 2003). As it was late winter there was limited vulnerability for the horticultural sector. All sectors were interested in (1) where ash had been dispersed to, (2) when hazard characterisation of the ash would be completed, (3) what was the likelihood of future activity, particularly further ashfalls, and (4) what preparedness measures could be undertaken for farmers and for supporting businesses. Large private organisations, such as Fonterra (New Zealand's major dairy cooperative), had established risk management procedures which they activated. They maintained a close watch on the situation, were interested in critical infrastructure performance during ashfalls, and participated actively in information sharing. Groups and organisations representing farmers were considerably more interested in direct farm impacts. These organisations were referred to a volcanic hazard information pamphlet, available on the MPI website (MPI, 2014), which covered likely impacts and possible preparedness and response options for pastoral, horticultural, and silviculture farmers. The pamphlet was widely distributed through their networks and in media, highlighting the value of pre-prepared information resources. 4.4. Communication with critical infrastructure agencies Following the eruption, scientists forwarded a suite of volcanic ash resources to the National Engineering Lifelines1 Committee (NELC) (which coordinates regional lifeline groups at a national level) early on 7 August. These included impact, preparedness and response advice for power, water, waste-water, ground transport and airports (refer to Wilson et al., 2014; resources in Appendix B). These resources were then disseminated to central North Island engineering lifeline groups. Effective communication relied strongly on pre-existing relationships between volcanic impact assessment scientists and national and regional lifelines groups. This was beneficial both for facilitating the rapid distribution of ash preparedness information and for allowing scientists to assess impacts of the eruption on infrastructure (Section 3.2) so that resources can be updated. The most significant engagement was with the national electricity transmission company Transpower Ltd. to investigate any impacts to high-voltage transmission lines. Transpower hosted researchers for a line and substation inspection, and various resources were shared, including photos from a helicopter inspection flight (Section 3.2.2). In terms of communications with the aviation sector (Section 2.2), aviation agencies had recently dealt with a major ash crisis when an ash plume from the June 2011Cordon Caulle eruption travelled from Chile around the globe and affected Australasian airspace for several days. They then briefly dealt with the ash advisory in relation to the Te Maari eruption effectively with no difficulties (Peter Lechner, Chief Meteorological Officer, CAA. pers. comm. 2014). 4.5. Communication with media and the public Communications from GNS Science are coordinated by the duty volcanologist and a dedicated volcanology media liaison officer, but the extra workload often means the role is shared by several staff.
1 In New Zealand the term engineering lifelines refers to critical infrastructure, such as power and water supplies.
9
Communication with media during the 2012 eruptions followed this system, and consumed a large proportion of several staff members' time for the initial days following the eruption, sometimes leaving them absent from science and monitoring discussion meetings. Communication from emergency managers to the media was handled following their own protocols; this included a substantial science component delivered jointly with scientists. Over the first day, briefings of the media were convened at specific times fronted by the main agencies involved including GNS Science and iwi (Maori tribal) representatives. Police led initial media releases and provided website information releases and then DOC took over. DOC enabled media access to the eruption site, escorting them on helicopters over the first two days, and later during the recovery period in association with reopening the tracks. Communication to the local public (largely iwi) was also conducted through meetings (hui) with DOC, GNS Science, university scientists and emergency management agencies. Other than these meetings most communication from scientists to the public was via the media, the GNS Science website, and the GeoNet project website. In the week following the Te Maari eruption, hundreds of individual media enquiries to scientists were received. In the event of a larger eruption, information demands would be expected to be even larger, and have the potential to overwhelm the capacity of scientists to respond. This high volume media response is consistent with other large natural hazard events in recent history within New Zealand. In the Canterbury Earthquake Sequence, in particular the 22 February 2011 earthquake, more than a thousand domestic and international individual media outlets requested information from the earthquake response centre, seeking response and science information regarding the MW 6.3 earthquake (Poole, 2012). GNS Science and GeoNet have since created a scalable, structured ‘Crisis Communication’ team which is role-based (akin to ‘incident management or coordination systems’ — a scalable command and control structure widely used in emergency management in New Zealand and in many other countries) to assist with large events in the future, and this has been activated twice in 2013 during earthquake events near Wellington — feedback from relevant stakeholders has been positive. 5. Hazard maps Maps are an important and widely used tool for hazard communication. Volcanic hazard maps for the volcanoes in TNP have been developed over the last decade and cover three distinct situations: (1) Background — for awareness during periods of no eruption with background volcanic unrest levels, (2) Crisis — for life safety advice during specific eruption crises, and (3) Ashfall — predicting the potential volcanic ashfall area during a crisis. Here we focus on the evolution and interrelationship of these types of maps, especially their basis (including impacts data presented in Section 3.2) and their use as a communication resource in the 2012 eruptions. 5.1. Background hazard map For the Tongariro background hazard map (GNS Science (compiler), 2007a; Fig. 3), the 2012 Te Maari eruption site is one of ten ‘active’ vents that are mapped as a background hazard. Recent research in progress by the authors suggests that all of these vents are post-glacial, and have probably been active in the last 15,000 years. At least three of the vents (Including Te Maari) have been historically active (Scott and Potter, this volume). Dual hazard zone colours were used to indicate the historical vs pre-historic vents. The map is permanently posted at walking track entrances. It highlights the walking tracks and huts (cabins) in the map area, because these are the main places people will be. A plan view map was chosen
Please cite this article as: Leonard, G.S., et al., Integrating multidisciplinary science, modelling and impact data into evolving, syn-event volcanic hazard mapping and communication..., J. Volcanol. Geotherm. Res. (2014), http://dx.doi.org/10.1016/j.jvolgeores.2014.08.018
10
G.S. Leonard et al. / Journal of Volcanology and Geothermal Research xxx (2014) xxx–xxx
Fig. 3. Background hazard map published in 2007 for Tongariro (GNS Science (compiler), 2007a).
based on a social science survey conducted at one of the entrances to the TAC track by Coomer and Leonard (2005). The hypothesis was that perspective air-photo-based maps are easier to read based on previous international work (see Section 5.2.4) and the fact that nearby ski areas regularly use such maps. However, it was found that the hiking public could understand and preferred the map-view in the Tongariro case. One hazard zone is shown, a ‘summit hazard zone’ which includes gas and flying rocks. These were based on the experiences of previous TNP eruption impacts and suitably encompassed the 2012 vent location and ballistic and surge impact areas (Fig. 1b). Pyroclastic density currents and lava flows are not highlighted in a zone, but rather it is stated on the map (Fig. 3) that many valleys are at risk and that people should stay out of valleys in an eruption. A simple explanation was given that pyroclastic flows, lahars and lava flows generally follow valleys and that these should be avoided in any eruption. This is because of the highly event-specific parameters needed to model flows for any one vent and eruption type and scale. Modelling of a wide range of scenarios
from a wide range of potential vents would produce a zone over much of the volcano (and beyond) equating fairly well to the simplistic warning written on the map. The action message is to stay on ridges and move away from the eruption vent. Finally it is stated that any place on the map is at risk from ashfall but, rather than being lethal, it will obscure vision and make breathing difficult (Fig. 3). 5.2. Crisis hazard map Crisis hazard maps are event specific, evolve rapidly, and do not render background hazard maps incorrect; rather they are a specific separate communication tool ideally aimed at all audiences (Section 4), often with a limited lifespan that must be compatible with long-term background hazard maps. Once a crisis has subsided hazard management reverts to use of the background hazard map. A crisis proximal hazard map (GNS Science (compiler), 2012) for northern Tongariro was first suggested on 21 July 2012 (Table 6) based on the experience of similar crisis maps being useful following the October 2007 eruption
Please cite this article as: Leonard, G.S., et al., Integrating multidisciplinary science, modelling and impact data into evolving, syn-event volcanic hazard mapping and communication..., J. Volcanol. Geotherm. Res. (2014), http://dx.doi.org/10.1016/j.jvolgeores.2014.08.018
G.S. Leonard et al. / Journal of Volcanology and Geothermal Research xxx (2014) xxx–xxx
11
Table 6 Timeline for the evolution of the crisis hazard map in 2012. 13 Jul 20 Jul 21 July 23 and 31 Jul 30 Jul
31 Jul
3 Aug 6 Aug
7 Aug
8 Aug
9 Aug
10 Aug 11 Aug
13 Aug 15 Aug 16 Aug
17 Aug 20 Aug 21–24 Aug 25 Aug 27 Aug
– First volcanic earthquake swarm under northern Tongariro. – First Volcanic Alert Level raising to 1, Aviation Colour Code to yellow. – First suggestion that a crisis map may be needed. Work begins on possible map content and graphics. – Two further Volcanic Alert Bulletins released covering changes in chemistry, and earthquake groups. – Agreement at response meeting that a crisis hazard map would be developed. – First set of flow models completed by Massey University. – Draft map concepts developed covering a range of summit hazard zone configurations, base maps and perspective vs. plan view. Discussed at public meeting. – Feedback from Iwi via DOC leads to ‘phenomena’ replacing ‘hazard’ in title. – All expected feedback returned. – Feedback collated and draft map version 0.1 produced for discussion at monitoring meetings. – Eruption just before midnight. – Substantial media interest. Ash impacts press releases, contact to critical infrastructure. – Development of wiki and email listserv. – Draft map from 6 Aug circulated to emergency managers and DOC. – Area of interest widened by making the map scale smaller, in response to several requests. – Agreement that flow zone suitably covers scenarios run to date. – Discussion of suitable circulation list and ratification process for draft map. – Agreement for circulation to and ratification by regional and district emergency managers, DOC, MCDEM, Earthquake Commission (EQC). – Final circulation of draft. – Clarification to group of basis for hazard zones. – Ash and agriculture media release. – Responding agencies and local Iwi advised of final draft. – Agreement to joint media release across ratifying agencies. – Discussion that media release on 12 August (Sunday) is likely to receive better coverage, however, a preference for immediate release is agreed. – Combined press release is drafted and agreed across agencies. – Release of public version 1.0 of map accompanying a ‘Volcanic Alert Bulletin’. – Print and web media coverage of Saturday map release primarily occurs on Monday, as predicted. – Discussion with slope stability experts regarding credibility of flank collapse scenario, and need to include this in hazard zones. – Request from DOC to reconsider the vent area modelled for possible future eruptions. Can the area be reduced to the 6 August vent alone? Can the colours be simplified? – Discussed at science meeting, and agreed to further discuss at Monday's full monitoring meeting (20th). – Agreement amongst scientists that it is credible to narrow the zone to the August 6 vent, and to simplify colouration of zones. – Revision of text on map and of action messages. – Release of map to local Iwi at community meeting. – Monday noon release of version 2.0 map to public as multiagency release titled Volcanic Alert Bulletin approximately two weeks after version 1.0 release.
at Ruapehu volcano (Section 1.1). The purpose was to provide concise representation of the hazards related to the crisis, their spatial extent, potential impacts (from both previous studies and the current eruption impact data), potential onset/warnings and correct response actions. Prior to the eruption, Titan 2D flow hazard models and discussion of a crisis hazard map were underway in response to precursory earthquakes from the 24 July, focussing on the historically-active Te Maari vent. Development of a Tongariro crisis hazard map started on 30 July following a third earthquake swarm within 19 days, and detection of volcanic gas. The crisis hazard map developed along a rapid timeline despite the complex discussion and ratification process (Table 6).
Fig. 4. Crisis hazard map initial concept version 0.1 in (a) plan and (b) perspective view. The accompanying text below the map on these versions was similar to that shown in Fig. 5a.
Several initial concept maps were developed drawing zones and messages from the background hazard map (2005). These were numbered 0.1 to 0.3 and dated from 1 to 9 August. Version 0.1 was prepared in both a plan and perspective view (Fig. 4). While the perspective view was mostly preferred by emergency managers at that stage, the time involved in Geographic Information System (GIS) rendering with each iteration was prohibitive within the time constraints of the rapidly evolving event. Nine crisis map versions (Table 7) were drafted. Between versions 0.2 and 0.3 the template was changed to no longer resemble the background hazard maps, to avoid confusion of the two maps which had very distinct purposes and applicability. Version 0.3 was the first full draft that was entirely specific to the crisis that included scientific discussion of all aspects, it was the first version widely circulated beyond
Please cite this article as: Leonard, G.S., et al., Integrating multidisciplinary science, modelling and impact data into evolving, syn-event volcanic hazard mapping and communication..., J. Volcanol. Geotherm. Res. (2014), http://dx.doi.org/10.1016/j.jvolgeores.2014.08.018
12
G.S. Leonard et al. / Journal of Volcanology and Geothermal Research xxx (2014) xxx–xxx
Table 7 Changes between the three most significant crisis hazard map versions. Version
Versions leading to this Circulation Title Episode status Area of interest Inset map Base map
Hazardous vents
Flow hazard zone
Summit (vent) hazard zone Text on map Action information Other
0.3 (9th August circulated)
1.0 (11 August to public)
2.0 (27 August to public)
0.1–0.2 Scientists & emergency managers (for discussion). Northern Tongariro Eruption Phenomena (first version that isn't titled ‘hazards’). Volcanic earthquakes and gas in northern Tongariro area. Perspective, centred closely on northern Tongariro (perspective view abandoned). Background hazard map for context (moved off map face). Shaded relief with elevation and rivers coloured. Roads in black. (air photo from perspective map abandoned) Five known northern Tongariro Holocene vents (four from background hazard map plus addition of North Crater). East sector added to this version. Yellow, orange where overlapping with summit zone.
0.4 Public.
1.1–1.3 Public (revision).
Northern Tongariro Eruption Phenomena.
Te Maari Eruption Phenomena.
Eruption from a vent lineation August 6th.
Eruption from a vent lineation August 6th.
3 km (was variable 2–3 km in background map). Red, orange where overlapping with flow zone. Zone descriptions, flow hazards, draft statement. What to do, volcanic hazards explained. 6 logos, inset background map, legend, version and disclaimer
Perspective, wider view taking in the full hazard Perspective, wider view taking in the full hazard zones and the full TAC track. zones and the full TAC track. Background hazard map for context. Background hazard map for context. Shaded relief with rivers coloured. Roads in black.
Shaded relief with rivers coloured. Roads in black.
Five known northern Tongariro Holocene vents (four from background hazard map plus addition of North Crater). Extent extended north and east as models were completed. Yellow, red where overlapping with summit zone. 3 km. Orange, red where overlapping with flow zone.
August 6th vents only.
Addition of reference to other vents and background hazard map. Minor corrections. As before.
Council boundaries labelled. Stream at risk of lahars highlighted. Other vents no longer red. Minor edits. Legend updated to reflect zone colour changes.
the monitoring team for discussion. The one-decimal-place maps were used before and between the release of two ‘final’ map versions (versions 1.0 and 2.0, Fig. 5, Table 7). A large amount of effort and communication occurred amongst scientists and emergency managers in the development of the crisis hazard map; from versions 0.3 to 2.0 at least 147 emails were sent by 23 different people across 9 different agencies and groups over a 24 day period. The maps were also presented at two community meetings during that time, aimed at informing and engaging local residents and Iwi before being publicly released. The 2012 crisis hazard map (Fig. 5) included a hybrid of past-event (including the 2012 eruption impact data presented in Section 3.2), deterministic and probabilistic approaches (Section 1.2). For the summit hazard zone the extent of surge and ballistic hazards was qualitatively judged by experts extrapolating from the experience of historic eruptions and the geological data for the range of TNP volcanoes. For flows there was an attempt to be probabilistic, but the flow zone was in fact made from several deterministic models because run numbers were limited by time. In addition, a specific vent was needed to be known to model runs, so that only the highest probability vent was modelled (the general area of the historic Te Maari vent). As it happened this was the main vent area in August and again in November 2012. 5.2.1. Defining vents Hazard zones are linked to the vent or vent area that is likely to erupt; this can be uncertain and in 2012 deciding on potential source vents generated some debate that we now explore here. For the background hazard map (Fig. 3) the vents were chosen based on the time since their last eruption, but they are not particularly well tied into any geophysical understanding of the location of current magma bodies or pathways below and through the volcano. In choosing hazardous vent locations for the crisis hazard map (Fig. 5) a range of data were
Extent as before yellow, only shown beyond summit zone.
3 km. Red.
considered for northern Tongariro including: the eruption that had just occurred; known past vents and the estimated timing of past eruptions; locations of volcanic earthquakes in 2012; and location of volcanic gas emissions in 2012. The vents used in the background hazard map that were relatively close to and surrounding the volcanic earthquakes, and near the historic Te Maari vent, were used as source vents in the crisis hazard map. These chosen vents are within the same order of magnitude distance apart as the spatial spread of the earthquakes. North Crater, to the west of the main vent alignment, was also added because it is Holocene, its most recent eruption is uncertain and it is only 2–3 km from the Te Maari historic vent. Red Crater was the southern-most vent included because it is considered to have had a historic eruption (Scott and Potter, this volume). North Crater and Red Crater were included (Fig. 5a, b) mostly from a precautionary approach; there was a large uncertainty around any connection they may have had to the July 2012 volcanic earthquakes (Section 3.1). In the version 1.0 release of the map (Fig. 5b) these two craters were chosen by the scientists to be included until any future data might suggest that they could be excluded, as a precaution. Hazard zones based around this wide set of vents led DOC managers and Iwi to perceive that anyone anywhere within the Tongariro–Ngauruhoe volcanic complex was exposed so that tracks as far as 11 km away from the active vent were kept closed. This was in contrast to highways that were reopened outside the park despite being only 4 km from the vent. There was pressure to resolve this contradiction (caused as a flow-on effect of the range of possible vents selected) and to focus on the most probable areas of hazard so that other parts of the track network could be opened. This meant that DOC requested that these be reconsidered with some urgency. The reconsideration was left totally to the scientists' expert opinions, but the urgency to reconcile perceived ‘safe areas’ and reasonable track risk management was initially at odds with the precautionary approach preferred by the scientists. The
Please cite this article as: Leonard, G.S., et al., Integrating multidisciplinary science, modelling and impact data into evolving, syn-event volcanic hazard mapping and communication..., J. Volcanol. Geotherm. Res. (2014), http://dx.doi.org/10.1016/j.jvolgeores.2014.08.018
G.S. Leonard et al. / Journal of Volcanology and Geothermal Research xxx (2014) xxx–xxx
hazardous vents were revised down to only the eruption vent lineation that erupted on 6 August in map version 2.0 (Fig. 5c).
5.2.2. Summit hazard zone The summit hazard zone (radius of 3 km around possible future vents) was the larger of the two options (2 and 3 km radius) used in previous background hazard maps in TNP (e.g. Fig. 3). The 3 km radius was agreed to represent the majority of the range of past pyroclastic flows and ballistic impacts from small Tongariro eruptions, and has also been used elsewhere in NZ based on observed activity. There was a minor divergence between the risk-calculation-based approach to ballistic range for the TAC track (based on likelihood of injury calculated from density of ballistics mapped from the eruption; Jolly et al., 2014a) and the version 2.0 (Fig. 5c) crisis hazard map. As data on ballistic ranges were obtained (Fig. 1b; summary in Section 3.2.1) and expert-elicited risk (calculated as part of the GeoNet
13
monitoring meetings) declined, the risks in the zone between 2 and 3 km were judged to have become quite small. This eventually led to distinct track use map zones (Fig. 2 in Jolly et al., 2014a) compared to the hazard map. Pre-planning and mapping of agreed event size ballistic ranges, or an agreed return period for probabilistic ranges which correspond to that used for risk management may alleviate the discrepancy that developed between the DOC risk management zone and the crisis hazard map ballistic zone in future crises.
5.2.3. Flow hazard zone Hazard analysis prior to the Te Maari eruption, in preparation of the first crisis hazard map draft (Fig. 5a), required the identification of event-specific mass flow inundation areas and an indication of drainage channels likely to be inundated at the onset of an eruption or during on-going activity. The computer simulation toolkit Titan2D (see Appendix C) was applied to simulate a two-phase flow across a
Fig. 5. Key Crisis hazard map versions. (a) Version 0.3 was the first full draft, circulated to emergency managers on August 9th following the eruption on the 7th. (b) Version 1.0 was the first ratified version that was then publicly released on the 11th of August, and (c) version 2.0 was an update released on the 27th of August (see GNS Science (compiler), 2012).
Please cite this article as: Leonard, G.S., et al., Integrating multidisciplinary science, modelling and impact data into evolving, syn-event volcanic hazard mapping and communication..., J. Volcanol. Geotherm. Res. (2014), http://dx.doi.org/10.1016/j.jvolgeores.2014.08.018
14
G.S. Leonard et al. / Journal of Volcanology and Geothermal Research xxx (2014) xxx–xxx
Fig. 5 (continued).
natural terrain model of the Te Maari area on the northern section of Tongariro. Runs were aggregated and simplified to create the flow hazard zone, and it was noted that this encompassed the actual eruption flow area (Section 3.2.1; Fig. 1b). To account for the limited number of simulations that could be run for flow hazard (both pyroclastic flow and lahars), and the lack of data available to define the ballistic range, the following disclaimer was added to the map face (Fig. 5): “Hazard zones are not definitive. This map is an interpretation based on historical and geological records, and computer modelling. Volcanic activity may be unpredictable and may exceed zones.” The edges of the hazard zones are also gradational in terms of transparency over a few hundred metres aiming to emphasise the gradual reduction in hazard away from the vent (Fig. 5). The statement “Many valleys on this map may be at risk from hot, burning, fast moving pyroclastic flows, mud flows and lava flows — stay out of all valleys in any eruption” is also added to the map face to cover the possibility that channelized flows may follow
un-modelled paths and run out in those channels well beyond the summit hazard zone. Lava flows were neither present nor expected (after the precursory seismicity waned) in the 2012 eruption events (given their scale, style and duration) and therefore the crisis hazard maps did not need to present zones for this hazard. For the purposes of future evolving crisis hazard maps that would eventually need to allow for lava, it would be worth having pre-planned and tested access and experience to correctly run lava flow models. This is being explored in New Zealand at present for the purposes of hazard mapping to calculate risk in Auckland. 5.2.4. Map base and perspective The choice of map base and perspective affects how easily people can read the map. For both the background and crisis maps a shaded-relief elevation model was widely agreed by scientists, emergency managers and local residents as the most readable without detracting from the
Please cite this article as: Leonard, G.S., et al., Integrating multidisciplinary science, modelling and impact data into evolving, syn-event volcanic hazard mapping and communication..., J. Volcanol. Geotherm. Res. (2014), http://dx.doi.org/10.1016/j.jvolgeores.2014.08.018
G.S. Leonard et al. / Journal of Volcanology and Geothermal Research xxx (2014) xxx–xxx
15
Fig. 5 (continued).
legibility of hazard zones. Air or satellite photos were considered attractive but distracting by emergency managers and local residents. However, in a different place away from a park, where there were a lot of cultural features (especially roads and buildings) an aerial photo may prove much more useful for self-location. Emergency managers immediately following the Te Maari eruption expressed that the draft crisis map perspective view (Fig. 4b) was easier to read than plan view (Fig. 4a), and that locals who had been shown agreed. Unfortunately, the short time available prohibited the use of perspective for this map. 5.2.5. Process for discussion and ratification Feedback and ratification amongst scientists and emergency managers was conducted via email coordinated by one designated scientist, with suggestions and discussion categorised into a change log document based on the headings in the first column of Table 7. Emergency managers' input was focussed on the action messages included on the map, which was their specific jurisdiction, and the presentation of
scientific data in terms of clarity to a public audience. Suggestions were logged as attributed to specific people within agencies, and where more than one person suggested a change, that was noted. The suggestions were discussed at science meetings (Section 4.1) and between these meetings with relevant subject area experts via email. Suggestions were categorised by colour as ‘actions to be taken’ based on majority of relevant experts in cases of disagreement, or simple changes with no conflicting views; possible changes that probably need more discussion; or ‘will not be actioned’ based on the same criteria as the actions to be taken. 5.3. Ashfall prediction and aviation ash advisory maps Ashfall prediction maps (for ash falling on the ground) are regularly automatically pre-prepared for three different sized theoretical eruptions from all active New Zealand volcanoes. The most appropriate scenario model can be used rapidly within Volcanic Alert Bulletins in a real
Please cite this article as: Leonard, G.S., et al., Integrating multidisciplinary science, modelling and impact data into evolving, syn-event volcanic hazard mapping and communication..., J. Volcanol. Geotherm. Res. (2014), http://dx.doi.org/10.1016/j.jvolgeores.2014.08.018
16
G.S. Leonard et al. / Journal of Volcanology and Geothermal Research xxx (2014) xxx–xxx
eruption event or in a period of unrest. The maps show model results computed using the Ashfall programme (Hurst, 1994) and are based on wind models automatically supplied by MetService. Following the
2012 eruptions, prediction maps (e.g. Fig. 6a) were released daily for 10 days. These were not a significant communication tool during the crisis, because the ashfall producing eruption (August) was a single event that produced little medial ash and virtually no distal ash (Sections 3.2.2 and 3.2.3). The prediction maps would have been a significant communication mechanism (Section 4) had there been a more substantial ashfall, or forecasts of a high chance of further ashproducing eruptions. The Ashfall model (Hurst, 1994) was used in 2012 and it is still the preferred model. It runs quickly and when run for past eruption scenarios generally correlates well with eruption deposits for which isopach maps have been drawn, at a range of eruption scales (Hurst and Smith, 2010). Volcanic observatories internationally are now exploring three dimensional ashfall models that are much more computer processor intensive (e.g. Bonadonna et al., 2012). It is now a NHRP research goal to benchmark leading 3D models against Ashfall, and considering which one (or ones) should be used in the future. Ashfall prediction maps (e.g. Fig. 6a) contain a legend related to predicted ashfall thickness, wind velocity at a range of elevations, a coastal outline, and significant cities and towns. More precise geographic features are not included to avoid clutter and to minimise over-reliance on the precision of the map, given uncertainties in the modelling. The ashfall thickness is shown as a graduated greyscale, rather than distinct isopachs of given ashfall thickness, to minimise over-reliance on the exact thickness at a specific location and allow for photocopying without loss of information. The airborne dispersal of the volcanic ash plume and its expected trajectories in the form of maps are modelled and released by the Wellington VAAC (Fig. 6b; Section 2.2). If ashfall prediction maps had been widely needed, there could also have been confusion with the Wellington VAAC-released ash forecast maps for aviation (as has been seen in Alaska, T. Neal pers. comm., 2014), which are also available on the internet. Ash at elevation may be travelling in a different direction to predicted ashfall on the ground, due to different wind directions at different elevations. 6. Discussion and recommendations
Fig. 6. (a) Ashfall prediction map released with Volcanic Alert Bulletin TON2012-17 (GNS Science, 2012b) on August 13th. The most likely eruption that might occur was small, and there was little wind that day, so the prediction was localised and centred on Tongariro. (b) Volcanic Ash Advisory map for aviation released by Wellington VAAC 7 August, 2012.
The 2012 Te Maari eruptions of Tongariro were small (bVEI 3) discrete events with minor impacts (Section 3) but they generated a huge demand for information, which was taxing on limited communication resources (Section 4). The communication amongst agencies, media and the public, the science response, and overall emergency management response were relatively well managed, but this finding should be considered with caution given the relatively small event size and duration. The eruptions have also highlighted the challenge of warning and communication around smaller, difficult to forecast eruptions in readily-accessible areas. The collection of impact data during the crisis was intimately related to the scientific messages given, and also to the content of hazard maps produced (Section 5). Explaining the nature of hazards in proximal areas (including the crisis hazard zones mapped), and the lack of hazard from distal ash, relied heavily on gathering and analysing field data rapidly. Substantial pre-event planning and coordination for eruption response (including impact data collection and hazard mapping) amongst emergency managers, scientists, and critical infrastructure agencies led to high levels of trust, cooperation and consistent messages. These were supported by a collaborative science funding platform and an agreed science advice panel structure, both spanning a common pool of staff across a range of relevant institutions. Scientific collaboration was enhanced by the use of a technical clearinghouse wiki and email listservs. The events have highlighted the complex and rapid needs across communication media and agencies, which is growing, especially with widespread access to fast mobile internet. Communication and messaging from scientists relied heavily on resources that had been preprepared: websites, posters and brochures (Appendix B).
Please cite this article as: Leonard, G.S., et al., Integrating multidisciplinary science, modelling and impact data into evolving, syn-event volcanic hazard mapping and communication..., J. Volcanol. Geotherm. Res. (2014), http://dx.doi.org/10.1016/j.jvolgeores.2014.08.018
G.S. Leonard et al. / Journal of Volcanology and Geothermal Research xxx (2014) xxx–xxx
Establishing a relationship with the health sector was a positive outcome, and in hindsight a gap that could have been foreseen; scientists were imagining they would need to conduct health-related analyses and messaging in isolation, whereas the Ministry of Health and regional heath agencies have the mandate to provide public messages and capacity to help with analyses. Communication to the media and general public received widely positive feedback; little published criticism of scientific messages could be found after extensive searching of media archives. The eruption has highlighted the value of pre-existing relationships, of having information resources ready to go, and the substantial time and resource required for communications. Communication is two way in many cases, highlighted by agricultural, health and infrastructure interactions. Scientists provided these sectors with preparedness advice, but also need to learn the specific impacts of this eruption from them so that resources and messages can be improved. 6.1. Incorporation of impact data Impacts from the 6 August eruption, the larger of the two (Section 3.1), were still relatively minor because of the overall small scale of the eruption and because it occurred when no-one was within 4 km of the vent. The most significant proximal impact was damage from pyroclastic surges and ballistics to the popular and economicallyimportant TAC track, in TNP. Proximal impact data fed directly into hazard maps, including the vent that was active, the surge, and the ballistic range. Quantitative risk assessments followed from initial hazard mapping, and highlighted that acceptable risk should probably drive the thresholds for hazard zonation on the maps. Risk levels proceeded to control what impact assessment could be conducted in proximal areas. Many previous studies have focused only on very large eruptions or on impacts associated with substantial ashfalls of N10 mm (see Wilson et al., 2012), and there is little documentation of impacts of thin ashfalls (a few mm or less). Yet thin ashfalls are the volcanic hazard most likely to be experienced by exposed critical infrastructure due to the large areas that can be covered. For example, the 1995–1996 eruptions of Mt Ruapehu were small (VEI 3), but nonetheless covered a large proportion of the North Island with thin ashfall (2–3 mm or less) at different times during the eruption sequence (Johnston et al., 2000). This medial ashfall (Fig. 1b) acted to test response systems that would be needed in a larger eruption, and planning has continued since the eruptions. If this eruption had been larger or longer-lived, mapping of the medial and distal ash would have received substantially more attention from all parties. The few mms of ashfall at medial distances were too thin to cause significant impact, and any impacts were further limited by: preventative actions taken by infrastructure managers; resilient design features of some systems; and the weather conditions following the eruption. Field testing indicated that the Te Maari ash had extremely low resistivity when wetted (Section 3.2.4), implying a very high potential to cause disruption to nationallyimportant power transmission networks via the mechanism of insulator flashover. This was not observed, presumably due to insufficient ash accumulation on insulators. Leachate chemistry analysis was conducted on both eruption deposits and the 21 November event produced higher available fluorine (Cronin et al., this volume). However, the results did not need a substantial communication effort due to the small remote area affected. At the distal scale, fine ash was rapidly dispersed to the east of the vent (Fig. 1a). Only aviation disruption impacts from distal ashfall were reported. In contrast, media and public interest was also heavily focussed on distal areas. Environmental monitoring PM10 data included here (Appendix D) demonstrates the value of a regional air quality monitoring network in quantifying population exposure to airborne respirable ash. Also with respect to distal ash, reconciliation of maps of fallen ash with ashfall predictions (and also potential confusion with aviation
17
ash forecast maps; Fig. 6b) would benefit from careful consideration and future planning. The leachate analysis experiences (Section 3.2.5) show that, even if ratified methods are available for ash hazard characterisation, there are major technical, organisational and communication challenges in embedding these methods within a decision-making framework during an eruption crisis. Nationally-agreed multi-agency procedures are currently being developed for the collection and analysis of ash samples and the interpretation and communication of results. 6.2. Development and use of hazard maps The 2005 background hazard map (Fig. 3), the 2012 crisis hazard map (Fig. 5), and the ashfall prediction maps (Fig. 6a) are a set of maps intended to serve all audiences. Crisis maps need to be drawn up rapidly, placing constraints on their development and production, and when necessary need to reflect changing hazard situations. They are especially needed to provide information to emergency managers, critical infrastructure managers, the media and interested members of the general public. These maps were created with the goal of providing concise representation of the hazards, their spatial extent, impacts, and description of potential warnings and of the correct response actions. Both public releases of the crisis hazard map were within Volcanic Alert Bulletins, which go to New Zealand's major print, web, television and radio media outlets. Quantitative evaluation of the uptake and usefulness of hazard maps is difficult. But generally uptake by the media, DOC risk mapping, all of the involved emergency management agencies, and use by and positive feedback from local communities at hui all suggest that they met the goals. Following the Saturday 11 August release of version 1.0, on 13 August the two major online media outlets (stuff.co.nz and nzherald.co.nz) both ran feature stories, along with supporting stories in several of their print editions throughout the country. There was coverage on the two major television news channels TV One and TV3 and the national public radio station ‘Radio New Zealand National’. In contrast, there was virtually no media coverage of the revised version 2.0 crisis hazard map on the 27 August, presumably because of the two weeks elapsed and that the relatively minor changes rendered the new map less news-worthy than the initial publication. Hazard maps are an essential piece of warning messaging for volcanic hazards. The Partnership for Public Warning (PPW, 2003) concludes that an effective warning system should be: (1) focused on people at risk; (2) able to be understood by all in the same way; (3) be capable of reaching people irrespective of what they are doing; (4) be easy to access and use; (5) not create added risk; (6) be reliable; (7) provide appropriate lead time so people can have a chance to protect themselves and (8) generate authenticated messages. Table 8 presents recommendations for the development of future hazard maps, which aim to be consistent with the above criteria for effective warnings, based on the details presented in Section 5 and the discussion here. Three issues emerged from media reproduction of the crisis hazard map: (1) Clipping — maps were presented without the accompanying legend and impact/action information, effectively rendering them less useful to the public; (2) Redrawing — stuff.co.nz redrew the version 1.0 hazard zones (which was propagated to at least one of their regional print newspapers) using different colours and using a sharp outline rather than a graduated fill (Fig. 7). While they correctly labelled the zones, all accompanying information was lost and the maps were therefore of less use to the public. The sharp lines removed the inference that hazard gradually decreased with distance; (3) Reproduction of old version — at least one news report of the 21 November eruption reproduced the version 1.0 map.
Please cite this article as: Leonard, G.S., et al., Integrating multidisciplinary science, modelling and impact data into evolving, syn-event volcanic hazard mapping and communication..., J. Volcanol. Geotherm. Res. (2014), http://dx.doi.org/10.1016/j.jvolgeores.2014.08.018
18
G.S. Leonard et al. / Journal of Volcanology and Geothermal Research xxx (2014) xxx–xxx
Table 8 Recommendations for developing volcanic hazard maps during volcanic crises. ✓ Distinguish clearly between “background hazard”, “crisis hazard”, and “ashfall prediction” map types. ✓ Add version date and period of validity for each map clearly (e.g., during a crisis some of the specific hazards may vary in size or type, although the background hazard map may not change). ✓ Consider triggers for revised versions, the revision process and timeframes. ✓ Refer to the other map types on each one, explaining the differences. ✓ Decide on the map audience and purpose. A single map of each type for all audiences is simplest, however, for example separate maps for specific hazards may be warranted for clarity. ✓ Ashfall prediction maps should include a specific disclaimer that they are not applicable to aviation and visa versa, and note the time period to which they apply. The following recommendations primarily apply to background and crisis hazard maps, but many elements are worth considering for ashfall maps too. ✓ Include scientists and emergency managers in hazard map development. ✓ Get agreement on process, timeframes and agency roles and establish a mechanism for conflict resolution. ✓ Consider the geophysical, geochemical, historical and geological basis for possible vent location(s). ✓ Define hazard types to be shown on map (e.g. ballistics, pyroclastic flows, lava flows, lahars, ashfall) ✓ Decide philosophy for creating each zone — past event, deterministic, probabilistic? hybrid? ✓ Consider discussing and agreeing acceptable risk and using this to define the extent for each zone. ✓ Include careful consideration of appropriate modelling/simulation tools to be used. ✓ Consider using graduated zone boundaries to illustrate the actual spatial variation of some hazard types, but sharp boundaries may be appropriate for others (e.g., valley confined flows). ✓ Consider base map elements (e.g. shaded relief vs air photo, roads, tracks, rivers) to aid the user recognition of the landscape. ✓ Consider perspective vs plan views — maps draped on shaded relief models may help recognition of complex terrain. ✓ Include a jargon-free protective-action-focussed legend, with short simple explanation of hazard zones and the hazards themselves, and including what to take action, when. ✓ Conduct social research to inform the above 4 aspects, and check the message clarity. ✓ Consider what disclaimers are needed. ✓ Clearly mark drafts and any distribution limitations. However, work under the assumption that all maps, drafts and discussions may enter the public domain. ✓ Link to where further information and the latest map version can be obtained. ✓ List clearly the agencies that have prepared the map with logos. ✓ Pay attention to how map will be released, mechanisms for managing feedback and public and media enquiries. ✓ Prepare accompanying release metadata — a media release (Volcanic Alert Bulletin in NZ) explaining the background, source, authorship, context and use of the map. ✓ As well as print and static image/PDF, provide the hazard map data in a good usable digital format to minimise changes when others reproduce it, e.g. by the media and in map ‘mashups’.
The wider public now also reproduces and propagates map information. Crisis mapping, in the form of shared online platforms are increasing the availability of data geospatially, and crisis mapping was widespread following the February 2011 earthquake in Christchurch (Sutton, 2012). Citizen scientists and volunteers are achieving highly useful roles in providing real time data and intelligence in hazard areas using these shared platforms (McDougall, 2012). Had this event been larger or had it affected a wider population, a crisis map or ‘map mashup’ (Liu and Palen, 2010), where multiple official map datasets are overlaid with citizen reported data, would likely have been generated by one or more online (often volunteer) groups. We recommend in Table 8 providing the hazard map data in a good usable format with clear metadata to minimise misrepresentation and maximise its usefulness, and hopefully also reducing issues with propagation of altered or
incomplete map data by the media mentioned above. Currently, there is no published policy guidance regarding how to work with these groups. More investigation is required in this topic area. Several complex issues have been highlighted in terms of what needs to be covered on a map: (1) Background hazard maps are used across the many potentiallyactive vents during non-eruptive periods, but these may not match crisis hazard maps and scenarios with very elevated probability compared to the background; (2) Scientists need for conservatism while constraining hazards may not be aligned with risk management priorities in time-sensitive situations; (3) Hazards tend to grade away spatially and should ideally be shown in a gradual probabilistically-defined way, while maintaining simplicity; (4) Messages on the map covering several severe hazards and actions, need to be a balance between (1) simplicity to achieve high awareness and not clutter the map, and (2) enough detail to be meaningful; and (5) The visual representation of elements (1) through (4) on a single piece of paper that can be quickly and correctly comprehended. The need to focus management actions on the main area of risk (i.e., the probable vent locations in relation to tolerable risk, rather than all conceivable vent locations) was the driver for DOC requesting a reconsideration of version 1.0 (see Section 5.2.1; Fig. 5b). Version 2.0 (Fig. 5c) was an important revision in terms of aligning hazard assessment and risk management. Later, the ‘flow hazard zone’ was also removed from the DOC risk management map to represent a further reduction in the flow hazard risk. The differences between the DOC risk management maps (and the related use of park tracks) and the crisis hazard map were not explained publicly, but the distinction is important and needs documentation and alignment in the future. The explicit inclusion of risk in mapping criteria changes priorities significantly compared to a map that simply aims to present the hazard. In reality, some consideration of risk usually goes into making a hazard map, even if it is not explicit, as decisions are made as to what hazards are ‘significant’ and thus worth mapping, to what distance. Given the lack of publication in mainstream media of the version 2.0 crisis hazard map, it can be inferred that the general public in New Zealand were largely uninformed of the changes that had been made. Also in relation to acceptable risk, the contrast of the 3 km zone used in 2012 to some larger international ballistic range values highlights a need to carefully consider what scenarios and return period should actually be modelled for ballistics. For example, Alatorre-Ibargüengoitia et al. (2012) use three explosion scenarios and model maximum range for ballistics. They define high, medium and low hazard zones based on decreasing probability of occurrence, corresponding respectively to the smallest to largest kinetic energy scenarios modelled. The zones reach 5, 8 and 12 km. As well as ballistics, flow hazards need careful quantification through modelling (e.g. Appendix D). For rapid crisis hazard map zone development the critical factors are (1) having access to and experience in running flow models, (2) having those models tested against the past and expected future parameters of a volcano and (3) having access to the computing resources needed to run enough scenarios in a short (day to days) timeframe. In the 2012 eruptions (1) was well established, however (2) required many assumptions and the existing relationships under (3) meant that weeks rather than days were ideally needed. This timeframe for modelling was significantly lessened by having run
Fig. 7. Presentation of crisis hazard map in the media. (a) TV3 web version of television story from August 13th. Note the clipping of the map and loss of explanatory information. (b) Stuff. co.nz web story on August 13th, note the re-drafting of the zones leading to definite edges rather than gradational, and also the clipping of explanatory information.
Please cite this article as: Leonard, G.S., et al., Integrating multidisciplinary science, modelling and impact data into evolving, syn-event volcanic hazard mapping and communication..., J. Volcanol. Geotherm. Res. (2014), http://dx.doi.org/10.1016/j.jvolgeores.2014.08.018
G.S. Leonard et al. / Journal of Volcanology and Geothermal Research xxx (2014) xxx–xxx
19
Fig. 7. Presentation of crisis hazard map in the media. (a) TV3 web version of television story from August 13th. Note the clipping of the map and loss of explanatory information. (b) Stuff. Please cite this article as: Leonard, G.S., et al., Integrating multidisciplinary science, modelling and impact data into evolving, syn-event volcanic co.nz web story on August 13th, note the re-drafting of the zones leading to definite edges rather than gradational, and also the clipping of explanatory information.
hazard mapping and communication..., J. Volcanol. Geotherm. Res. (2014), http://dx.doi.org/10.1016/j.jvolgeores.2014.08.018
20
G.S. Leonard et al. / Journal of Volcanology and Geothermal Research xxx (2014) xxx–xxx
several models already by the time the first eruption occurred, spurred by the precursory volcanic earthquakes (Section 5.2.3). The layout and presentation of New Zealand ashfall predictions (Fig. 6a) in general was studied following the eruption (Baird, 2014); it was clear from discussion with emergency managers during the Te Maari eruption that there was some uncertainty around the implications of the ashfall prediction, links to ash impact mitigation resources, how the prediction relates to volcanic ash advisories for aircraft (Fig. 6b; see Section 5.3), whether it maps ash that has fallen, and what time of the day it applies to (e.g. when the map is released, vs a specific later time, vs once all of the ash has fallen over an undetermined length of time). Documentation and ratification of the process for different map types is hoped to further speed up production of future crisis maps, and a systematic review of hazard modelling procedures, approaches to probabilistic vs. deterministic methods, and acceptable risk for hazard mapping would be worthwhile. Ideally a large number of scenarios, with well-controlled input data would be run to define a probabilistic dataset for each zone type. The probability used for the final mapped zone could be drawn from acceptable risk to life or property at locations on the map (e.g. risk to tourists on the TAC track) — this would betteralign the hazard map with risk management decisions which are already acceptable-risk based (i.e. acceptable risk levels are chosen then hazard zone extents are modelled and drawn to include the area that exceeds this chosen level; see Jolly et al., 2014a). Any probabilistic maps should be tested against known hazard events (e.g. Cappello et al., 2011). This event and past research also show that is worth conducting social science ahead of time to determine the most suitable map layout to the audience. Perspective view (e.g. Fig. 4b) has been shown to increase map readability and public self-location accuracy (Haynes et al., 2007; Nave et al., 2010), especially in combination with a photographic base. However, for the Tongariro background hazard map (Fig. 3) similar research (Coomer and Leonard, 2005) found that TAC track walkers could read and locate themselves on a plan-view topographic base more easily. This may be because they are primarily hikers and therefore used to reading maps. They would have looked at the hike via a map, including map-based sign boards at the track start. These observations highlight the role of social science to guide the presentation of mapped information. However, results from one place or map cannot necessarily be applied to another. Because of the extra work involved in perspective rendering of maps, a tested fast workflow would need to be established ahead of a future crisis for perspective crisis maps to be able to be produced rapidly.
7. Conclusions While small, the 2012 Te Maari eruptions were high-profile and created complex information demands and communication needs. Impacts outside the national park boundary were minor but are documented here to help define damage and mitigation thresholds for future eruptions. Impact information, including that impacts were minor, was an important component of the science communication. A collaborative and collegial scientific environment was actively encouraged, and facilitated agreement on consistent messaging and communicating hazard information (including hazard maps) to the public. The crisis has shown the value of pre-existing relationships, of having information resources ready to go, and the substantial time and resource required for communications. This event highlights the importance and complementary roles of three map types for communicating volcanic hazard information: background hazard, crisis hazard and ashfall prediction maps. In developing hazard maps there are a range of key points to consider in terms of message, presentation and basis for each map type. Effective hazard maps require planning, collaboration, robust science and an audience focus.
Acknowledgements This work was supported by Ministry of Business, Innovation and Employment (MBIE) core science funding to GNS Science, Massey University and the University of Canterbury via the NHRP; by EQC funding to the GeoNet project; and by DOC funding towards social research within TNP. Natalia Deligne, Mark Constable, Jo Horrocks and Richard Smith provided valuable editing of specific sections, and reviews by Dougal Townsend and Maureen Coomer enhanced the manuscript. Jim Cole and Jan Lindsay are thanked for their thoughtful and thorough journal peer reviews including very useful suggestions for reorganisation. We also thank the following individuals who provided information on ashfall impacts: Gordon Stewart, Spotless Facility Services (NZ) Ltd. (contractors to the Department of Corrections); Brendan Olsen and team, Transpower NZ Ltd.; Andy Hema, Genesis; Aaron Waiti, Downer; Bevan Percival, Opus (NZ) Ltd.; Peter Lechner, NZ Civil Aviation Authority; Bob Fletcher, Air NZ; and Bryce Redgwell, Fonterra. Appendix A. Technical clearinghouse wiki access and use agreement A.1. “Collaboration and information sharing protocol” By logging in to the sub-pages of this wiki all users agree to collaborative efforts, and to share plans and data in good faith to achieve the best possible scientific and emergency management response. If multiple groups discover that they are planning to do overlapping work they will discuss this directly with one another and come to a mutuallyagreed solution. Please refer to the NZ Volcanic Advisory Panel page for more details on concepts and principles for coordinated science advice and research response. Information published here (away from the consistent messaging page) is not necessarily vetted prior to publication. Any data, information, analyses or results shared on the wiki are posted with the understanding that others won't use them without directly discussing and agreeing this with the people who've generated the data. Information on the consistent messages sub-page should only be material that people are comfortable being reported to the public and media, it should be written for the public and media. Data, and references to data, on the consistent messages page should be checked with the people who generated the data before it gets added to the consistent messaging page. All other information uploaded to the wiki on all other sub-pages: (1) (2) (3) (4)
Is provided principally to inform a suitably qualified professional; Will attribute its origin to the best extent possible; Is based on best endeavours during the science response; Has not been rigorously peer-reviewed in the normal (i.e. anonymous) manner; (5) May be superseded by further investigation; (6) Shall be independently verified before being used for any legally binding purpose
A.2. Editing and adding information Please edit specific sub-pages directly (at the left) When you're on a page you can create a new sub-page by clicking on ‘New page’ above. A.3. Access to the wiki Access is via username and password to all science researchers and GeoNet responders, please email [wiki managers email addresses] to add anyone relevant.
Please cite this article as: Leonard, G.S., et al., Integrating multidisciplinary science, modelling and impact data into evolving, syn-event volcanic hazard mapping and communication..., J. Volcanol. Geotherm. Res. (2014), http://dx.doi.org/10.1016/j.jvolgeores.2014.08.018
G.S. Leonard et al. / Journal of Volcanology and Geothermal Research xxx (2014) xxx–xxx
Contributors currently include MCDEM, University of Canterbury, Massey University, University of Otago, Victoria University, NIWA, MetService, and GNS Science but others are welcome.
21
(5) The Department of Conservation maintains a detailed volcanic hazard page for TNP (DOC, 2014) which includes risk maps derived from calculations discussed in Jolly et al. (2014a) and links to all of the other hazard maps discussed in Section 5.
Appendix B. Supporting mitigation information A range of mitigation information was also available and promulgated during the Te Maari event, to complement hazard maps. This took the form of printed material, new static and dynamic signage, and web pages (see also Jolly et al., 2014a), with all printed material also available via the web.
While the agencies maintaining each of these websites do their best to maintain cross-links to the other sites, this is an on-going challenge compounded by trying to maintain consistency within the content of each website, discussed above in Section 4.2.
B.3. IAVCEI-linked websites B.1. Critical infrastructure posters The Auckland Engineering Lifelines Group is made up of critical infrastructure agencies operating in and around Auckland, New Zealand's largest city. Auckland sits on top of an active basalt volcanic field, and with this in mind the AELG hosts a Volcanic Impacts Study Group (VISG) focussing on critical infrastructure risk and mitigation for the whole country. From 2006 to 2010 the VISG commissioned five posters to provide concise authoritative advice for individual infrastructure sectors as follows: (1) Power system operators (including power generation facilities until 2013); (2) Roading managers; (3) Airport managers; (4) Wastewater managers; (5) Water supply managers. Prior to the Te Maari eruption, these posters were heavily promoted to critical infrastructure agencies through regional lifelines groups. On 7 August, the posters were again sent out to all national members of these groups through the national-level New Zealand Lifelines Committee. VISG received wide positive feedback from critical infrastructure, and following the eruptions the original poster series was updated with five new posters commissioned and released in September 2013 (Wilson et al., 2014): (1) (2) (3) (4)
Advice on urban cleanup operations; Advice for facility managers: buildings; Advice for facility managers: computers and electronics; Advice for facility managers: generators and HVAC (heating ventilation and cooling) systems; (5) Advice for power plant operators. B.2. Domestic websites Several New Zealand websites hosted volcanic hazard mitigation resources during and following the eruptions: (1) GNS Science hosts information on the eruptive history of New Zealand volcanoes (GNS Science, 2014) and the GeoNet website hosts monitoring and forecast information (GeoNet, 2014) including bulletins, alert levels, aviation colour codes, ashfall forecasts and webcam data. Both websites include external links to other domestic websites, as well as international web resources listed under Section B.3 below. (2) Emergency management at central (MCDEM, 2014), and local government levels (three regional and at least three city/district councils) each have their own websites and produced volcanic impacts and mitigation information pages. (3) The Ministry of Health produced a human health impacts and instructions page (MoH, 2014) which was publicised on the main website front page during the eruptions. (4) The Ministry for Primary Industries (MPI) covers agricultural risk management and already had a brief web page with a detailed brochure on volcanic impacts (MPI, 2012).
Two websites provide substantial resources documenting the potential impacts of volcanic ash and also effective mitigation strategies, under the auspices of the International Association of Volcanology and Chemistry of the Earth's Interior (IAVCEI) commissions. The International Volcanic Health Hazard Network (IVHHN) maintains a website with detailed information on understanding human health impacts from volcanic hazards, especially ash and gas (IVHHN, 2014a). The Volcanic Ashfall Impacts Working group, part of the Cities and Volcanoes Commission (CaV) of IAVCEI, maintains and updates a web resource focussing on ashfall impacts to other sectors beyond health, especially infrastructure, buildings and agriculture (USGS, 2014). This site aims to present peer reviewed evidence on the range of impacts and mitigation strategies, as summarised in Wilson et al. (2012). These were referred to on GNS Science and GeoNet websites during the 2012 eruptions and were also linked to in specific Volcanic Alert Bulletins that year. Following the eruptions, wider emergency management and government websites listed above have made plans to link to these resources. The host IAVCEI Commissions, and the maintenance and updating of both of these web-resources all involve New Zealand NVSAP scientists (e.g. review in Wilson et al., 2012).
B.4. Brochures The IVHHN and CaV, along with the US Geological Survey and GNS Science have produced two booklets, “The health hazards of volcanic ash: A guide for the public” (IVHHN, 2014b) and “Guidelines on preparedness before, during and after ashfall” (IVHHN, 2014c). These have been widely distributed as print copies in New Zealand especially via Short Courses (below) prior to the 2012 eruptions, are on both the IVHHN and CaV websites in PDF format, and are also directly linked to on GNS Science and GeoNet websites. As of 2014 they are available in 11 languages. DOC produced three versions of a fact sheet that were given to concessionaires and handed out to most visitors for several weeks to months after reopening sections of the TAC (Williams and Keys, 2013).
B.5. Short courses Annual ‘Managing a volcanic crisis’ short courses for staff from responding agencies, lifelines organisations etc. have been run since the 1995–96 eruptions of Ruapehu volcano, by GNS Science with input and presentations by a wide and varying list of experts. These provide education to staff and also build relationships, which were beneficial for free and open communication related to the Te Maari eruption. The schedule has evolved over time, and over the last few years has typically covered: volcanic processes and hazards, New Zealand's volcanoes and monitoring, international and domestic eruption and management case studies, an exercise, a field trip to a New Zealand volcano, national and local emergency management frameworks, volcanic advisory group structures, communicating uncertainty and warnings, and group discussions.
Please cite this article as: Leonard, G.S., et al., Integrating multidisciplinary science, modelling and impact data into evolving, syn-event volcanic hazard mapping and communication..., J. Volcanol. Geotherm. Res. (2014), http://dx.doi.org/10.1016/j.jvolgeores.2014.08.018
22
G.S. Leonard et al. / Journal of Volcanology and Geothermal Research xxx (2014) xxx–xxx
Appendix C. TITAN 2D modelling procedures The fundamental numerical basis of the toolkit is a depth averaged Coulomb continuum model (Patra et al., 2005; Pitman and Le, 2005) that it is solved across a 3D or natural terrain using a parallel adaptive grid. Titan2D has been tested against and compared well to a wide range of mass flows through hind-casting (Bursik et al., 2005; Sheridan et al., 2005; Charbonnier and Gertisser, 2009) and has been used as a forecasting tool for mass flow events (Procter et al., 2010a; Sheridan et al., 2010). Titan2D has been applied as a tool to predict Mt. Ruapehu, Crater Lake sourced lahars prior to the March 2007 lake breakout event (Procter et al., 2012). While this provided information for the emergency management decision making process, the Te Maari eruption was the first time Titan2D was applied as a tool for direct hazard mapping in an emergency response, prior to the event. The application of computer flow simulation tools for hazard mapping is generally undertaken on an ad-hoc basis with no formal methods or strategies guiding the process such as those provided by Crandell et al. (1984). This is generally in response to the fact that there are a variety of flow simulation tools that vary in their numerical basis and that require differing inputs and computational strategies to produce outputs. Probabilistic techniques that require the inputs of the flow simulation tool (e.g. Bayarri et al., 2009; Sheridan et al., 2010) require large amounts of computational time and further analysis and were not the most expedient method in this emergency situation. Titan2D is computationally efficient and can be scaled to operate on a desktop computer to rapidly produce an output. Input parameters required for the toolkit are basal and internal friction, digital elevation model of the terrain, ratio of water to rock and starting pile location and initial velocity. Many of these parameters can easily be determined through historical activity of similar events (e.g. Sheridan et al., 2005; Procter et al., 2012). However, little historical or geological information exists in regards to activity at the Upper and Lower Te Maari Craters which presents some challenges. As the model was to be simulated across the present day terrain a (LINZ) contour derived digital elevation model (DEM) of the current cone was generated at 20 m resolution (with an average Z accuracy of ±50%). Rheological inputs for the simulations are based on the numerical model of the code and in the case of Titan2D the only parameters required are friction values. In a real world
setting these values are not well documented and are usually optimised through experimenting with values and combinations to match the inundation areas and flow characteristics of past flows (e.g. Sheridan et al., 2005; Procter et al., 2010b). For Te Maari, considering that flows interpreted from accounts of historical eruptions were poorly constrained, the style of volcanism to form the Upper and Lower craters is considered to be from hydrothermal to phreato-magmatic eruptions (Topping, 1974) with associated water rich surges. These associated flows are generally interpreted to require low basal frictions (12–15°) and internal fiction values of 20–30° with water to sediment ratios of 1:4. In regard to Te Maari, values of 12° (basal) and 30° (internal) were initially applied. The starting volume was determined from the current volume of the older excavated Lower Te Maari Crater or c. 0.0016 km3. The location of the starting volume was a complete unknown and considering the lead in time to undertake the modelling further geodetic, seismic and probabilistic analysis was not possible. Four starting locations were chosen based on a rapid volcano-geomorphic analysis identifying three possible vent opening locations; two near the Lower Te Maari crater and the Upper Te Maari Crater, and one area susceptible to collapse of a ridge forming the source amphitheatre of the Mangahouhounui Stream draining to the East. The simulations undertaken (see three examples in Fig. C.1) were completed in a period of 3–5 days with simulations being validated through the SUNY at Buffalo, vHub portal with other Titan2D users running and testing the scenarios to ensure the robustness of the model. Output data were analysed and presented in ArcGIS to provide inundation maps with respect to the maximum flow height at each simulated (DEM) grid cell. The data were not interpolated or thinned in any way. The results of the simulations displayed inundation areas confined to drainages of the Northern slopes of the volcano. Considering the poor resolution of the 20 m DEM and the low relief or poor development of the channels on the relatively young terrain, the simulation tool performed well in identifying the drainage pathways with flow thicknesses of N 0.5 m being constrained (within 200 m of the channel). The runout length of the simulated flows reached distances of 2–7 km from source with the majority reaching State Highway 46 and the community that lives along this road. Simulation outputs, particularly the maximum runout distances, were then applied to develop a mass flow hazard zone that encompasses an area potentially affected by any volcanic mass flows.
Fig. C.1. Three of the Titan 2D flow models run for lahars and pyroclastic flows, that were aggregated and interpreted to form the yellow ‘flow hazard zone’. (For interpretation of the references to colour in this figure legend, the reader is referred to the web version of this article.)
Please cite this article as: Leonard, G.S., et al., Integrating multidisciplinary science, modelling and impact data into evolving, syn-event volcanic hazard mapping and communication..., J. Volcanol. Geotherm. Res. (2014), http://dx.doi.org/10.1016/j.jvolgeores.2014.08.018
G.S. Leonard et al. / Journal of Volcanology and Geothermal Research xxx (2014) xxx–xxx
Appendix D. Air quality and distal ash Hawke's Bay Regional Council (HBRC) maintains three air quality monitoring stations in the neighbouring cities of Napier and Hastings and the industrial area of Awatoto. All three sites are located outside the ashfall depositional area (Pardo et al., this volume; Fig. 1a). The cities of Napier and Hastings are similar in size and have a combined population of ~ 125,000. Hourly mean levels of PM10 are shown for the three sites in Fig. D.1. A marked increase in hourly mean PM10 concentrations during the evening of 6 August is apparent for Napier and Hastings, and is considered most likely due to the use of domestic wood burners and to the cool and calm conditions at the time. The slow decrease of these peaks during the following morning is considered by HBRC to be unusual, with levels normally tailing off around daybreak, and that the elevated levels observed during the morning of 7 August indicate a separate source of fine particulate matter (Dr K. Kozyniak, HBRC, personal
23
communication 2014). There is a distinct peak in hourly mean PM10 concentrations at Awatoto during the morning of 7 August. Awatoto is not located in a residential area and is not expected to be influenced by wood burner emissions. The 24-hour average PM10 concentration at all three sites remained below the New Zealand regulatory standard of 50 μg/m3. PM10 data was also obtained for the town of Turangi, population ~3500, located 18 km NE of Te Maari vent (Fig. 1b). A distinct peak in hourly mean PM10 was recorded at the Waikato Regional Council (WRC) Turangi monitoring station (Dr J. Caldwell, pers. comm. 2014) on the morning of 7 August (Fig. A.1). This peak occurred earlier than those recorded in Hawke's Bay, consistent with a closer location to the vent. The 24-hour average PM10 concentration for Turangi on 7 August was the highest recorded for the month of August (26 μg/m3 compared to an average of 13.6 ± 4 μg/m3 for the month) but was well below the New Zealand regulatory standard.
Fig. D.1. Hourly average PM10 concentrations at Napier, Awatoto and Hastings (Hawke's Bay) and Turangi (Waikato) during 1–8 August 2012. The horizontal scale indicates hours elapsed after midnight. Data is courtesy of Hawke's Bay Regional Council and Waikato Regional Council.
References Act, C.D.E.M., 2002. Civil Defence Emergency Management Act. http://www.legislation. govt.nz/act/public/2002/0033/latest/DLM149789.html?search=ts_act%40bill% 40regulation%40deemedreg_civil+defence_resel_25_a&p=1 (accessed 4 March 2014). Alatorre-Ibargüengoitia, M.A., Delgado-Granados, H., Dingwell, D.B., 2012. Hazard map for volcanic ballistic impacts at Popocatépetl volcano (Mexico). Bull. Volcanol. 74, 2155–2169. Alberico, I., Lirer, L., Petrosino, P., Scandone, R., 2008. Volcanic hazard and risk assessment from pyroclastic flows at Ischia island (southern Italy). J. Volcanol. Geotherm. Res. 171, 118–136. Baird, N.L., 2014. What's in a Map? Communicating Natural Hazard Forecasts. Unpublished M.Sc. thesis, University of Canterbury, Christchurch. http://ir.canterbury.ac. nz/handle/10092/9258 [accessed July 2014]. Barclay, J., Haynes, K., Mitchell, T., Solana, C., Teeuw, R., Darnell, A., Crosweller, J.S., Cole, P., Pyle, D., Lowe, C., Fearnley, C., Kelman, I., 2008. Framing volcanic risk communication within disaster risk reduction: finding ways for the social and physical sciences to work together. Geological Society, London, Special Publications. 305, pp. 163–177.
Bayarri, M.J., Berger, J.O., Calder, E.S., Dalbey, K., Lunagomez, S., Patra, A.K., Pitman, E.B., Spiller, E.T., Wolpert, R.L., 2009. Using statistical and computer models to quantify volcanic hazards. Technometrics 51, 402–413. Beauchamp, R.O., Bus, J.S., Popp, J.A., Boreiko, C.J., Andjelkovich, D.A., 1984. A critical review of the literature on hydrogen sulfide toxicity. Crit. Rev. Toxicol. 13, 25–97. Bier, V.M., 2001. On the state of the art: risk communication to the public. Reliab. Eng. Syst. Saf. 71, 139–150. Bonadonna, C., Folch, A., Loughlin, S., Puempel, H., 2012. Future developments in modelling and monitoring of volcanic ash clouds: outcomes from the first IAVCEI-WMO workshop on Ash Dispersal Forecast and Civil Aviation. Bull. Volcanol. 74, 1–10. Breard, E.C.P., Lube, G., Cronin, S.J., Fitzgerald, R., Kennedy, B., Scheu, B., Montanaro, C., White, J.D.L., Tost, M., Procter, J.N., Moebis, A., 2014. Using the spatial distribution and 1 lithology of ballistic blocks to interpret eruption sequence and dynamics: August 6 2012 Upper Te Maari eruption, New Zealand. J. Volcanol. Geotherm. Res. (this volume). Bursik, M., Patra, A., Pitman, E.B., Nichita, C., Macías, J.L., Saucedo, R., Girina, O., 2005. Advances in studies of dense volcanic granular flows. Rep. Prog. Phys. 68, 271–301. Cappello, A., Vicari, A., Del Negro, C., 2011. Retrospective validation of a lava flow hazard map for Mount Etna volcano. Ann. Geophys. 54, 634–640.
Please cite this article as: Leonard, G.S., et al., Integrating multidisciplinary science, modelling and impact data into evolving, syn-event volcanic hazard mapping and communication..., J. Volcanol. Geotherm. Res. (2014), http://dx.doi.org/10.1016/j.jvolgeores.2014.08.018
24
G.S. Leonard et al. / Journal of Volcanology and Geothermal Research xxx (2014) xxx–xxx
Charbonnier, S.J., Gertisser, R., 2009. Numerical simulations of block-and-ash flows using the Titan2D flow model: examples from the 2006 eruption of Merapi Volcano, Java, Indonesia. Bull. Volcanol. 71, 953–959. Coomer, M.A., Leonard, G.S., 2005. Tongariro crossing hazard awareness survey: public perceptions of the volcanic hazard danger. Lower Hutt: Institute of Geological & Nuclear Sciences Science Report 2005/37, (26 pp.). Crandell, D.R., Booth, B., Kasumadinata, K., Shimozuru, D., Walker, G.P.L., Westercamp, D., 1984. Source-book for volcanic-hazards zonation. UNESCO Nat. Hazards 4 (97 pp.). Cronin, S.J., Hedley, M.J., Smith, G., Neall, V.E., 1997a. Impact of Ruapehu ash fall on soil and pasture nutrient status. 1. October 1995 eruptions. N. Z. J. Agric. Res. 40, 383–395. Cronin, S.J., Hedley, M.J., Smith, R.G., Palmer, A.S., Neall, V.E., 1997b. The implications of a volcanic eruption for mineral nutrition of sheep and cattle. Proceedings of the Society of Sheep and Beef Cattle Veterinarians of the New Zealand Veterinary Association, Annual Seminar, New Zealand Veterinary Association. 175, pp. 15–24. Cronin, S.J., Hedley, M.J., Neall, V.E., Smith, R.G., 1998. Agronomic impact of tephra fallout from 1995 and 1996 Ruapehu volcano eruptions, New Zealand. Environ. Geol. 34, 21–30. Cronin, S.J., Neall, V.E., Lecointre, J.A., Hedley, M.J., Loganathan, P., 2003. Environmental hazards of fluoride in volcanic ash: a case study from Ruapehu volcano, New Zealand. J. Volcanol. Geotherm. Res. 121, 271–291. Cronin, S.J., Stewart, C., Zernack, A.V., Brenna, M., Procter, J.N., Pardo, N., Christenson, B., Wilson, T., Stewart, R.B., Irwin, M., 2014. Volcanic ash leachate compositions and assessment of health and agricultural hazards from 2012 hydrothermal eruptions, Tongariro, New Zealand. J. Volcanol. Geotherm. Res. (this volume). Crouch, J.F., Pardo, N., Miller, C.A., 2014. Dual polarisation C-band weather radar imagery of the 6 August 2012 Te Maari Eruption, Mount Tongariro, New Zealand. J. Volcanol. Geotherm. Res. (this volume). De la Cruz-Reyna, S., Tilling, R.I., 2008. Scientific and public responses to the ongoing volcanic crisis at Popocatépetl Volcano, Mexico: importance of an effective hazardswarning system. J. Volcanol. Geotherm. Res. 170, 121–134. Department of Conservation (DOC), 2014. Volcanic risk in Tongariro National Park. http://www.doc.govt.nz/parks-and-recreation/national-parks/tongariro/plan-andprepare/volcanic-risk-in-tongariro-national-park/ (accessed July 2014). Efford, J.T., Bylsma, R.J., Clarkson, B.D., Pittari, A., Mauriohooho, K., Moon, V.G., 2014. Vegetation dieback as a proxy for temperature within a wet pyroclastic density current: a novel experiment and observations from the 6th of August 2012 Tongariro eruption. J. Volcanol. Geotherm. Res. (this volume). Fitzgerald, R., Tsunematsu, K., Kennedy, B., Breard, E.C., Lube, G., Wilson, T., Jolly, A.D., Pawson, J., Rosenberg, M.D., Cronin, S.J., 2014. The application of a calibrated 3D ballistic trajectory model to ballistic hazard assessments at Upper Te Maari, Tongariro. J. Volcanol. Geotherm. Res. (this volume). Fischhoff, B., 1995. Risk perception and communication unplugged: twenty years of process. Risk Anal. 15, 137–145. Fournier, N., Jolly, A.D., 2014. Detecting complex eruption sequence and directionality from high-rate geodetic observations: The August 6, 2012 Te Maari eruption, Tongariro, New Zealand. J. Volcanol. Geotherm. Res. (this volume). Fournier d'Albe, E.M., 1979. Objectives of volcano monitoring and prediction. J. Geol. Soc. Lond. 136, 321–326. Frankel, A., 1995. Mapping seismic hazard in the central and eastern United States. Seismol. Res. Lett. 66, 8–21. GeoNet, 2014. Volcanoes. http://www.geonet.org.nz/volcano/ (accessed July, 2014). GNS Science, 2012a. Volcanic Alert Bulletin TON-2012/18. http://info.geonet.org.nz/ pages/viewpage.action?pageId=2195932 (Accessed July 2014). GNS Science, 2012b. Volcanic Alert Bulletin TON-2012/17. http://info.geonet.org.nz/ pages/viewpage.action?pageId=2195927 (Accessed July 2014). GNS Science, 2014. New Zealand Volcanoes. http://gns.cri.nz/Home/Learning/ScienceTopics/Volcanoes/New-Zealand-Volcanoes (accessed July 2014). GNS Science (compiler), 2004. Volcanic Hazards at Whakapapa. http://info.geonet.org.nz/ download/attachments/8585571/Whakapapa_poster_A4.pdf (accessed July 2014). GNS Science (compiler), 2005. Volcanic Hazards at Turoa. http://info.geonet.org.nz/ download/attachments/8585571/Turoa_poster_A4.pdf (accessed July 2014). GNS Science (compiler), 2007a. Volcanic Hazards at Tongariro. http://info.geonet.org.nz/ download/attachments/8585571/Tongariro_Poster_A4.pdf (accessed July 2014). GNS Science (compiler), 2007b. Summit Hazards at Mt Ruapehu. Unpublished Map Held at GNS Science, Lower Hutt. GNS Science (compiler), 2008. Volcanic Hazards at Ruapehu. http://info.geonet.org.nz/ download/attachments/8585571/Ruapehu_Hazards_poster_A3.pdf (accessed July 2014). GNS Science (compiler), 2012. Te Maari Erupion Phenomena. http://info.geonet.org.nz/ download/attachments/8585571/Northern_Tongariro_eruption_phenomena.pdf (Accessed July 2014). Gregory, N.G., Neall, V.E., 1996. Volcanic hazards for livestock. Outlook Agric. 25, 123–129. Handmer, J., Milne, J., 1981. Flood maps as public information. Proceedings of the Floodplain Management Conference, Australian Water Resources Council, Canberra, Australia, pp. 1–26. Haynes, K., Barclay, J., Pidgeon, N., 2007. Volcanic hazard communication using maps: an evaluation of their effectiveness. Bull. Volcanol. 70, 123–138. Haynes, K., Barclay, J., Pidgeon, N., 2008a. The issue of trust and its influence on risk communication during a volcanic crisis. Bull. Volcanol. 70, 605–621. Haynes, K., Barclay, J., Pidgeon, N., 2008b. Whose reality counts? Factors affecting the perception of volcanic risk. J. Volcanol. Geotherm. Res. 172, 259–272. Hickling, J., Clements, M., Weinstein, P., Woodward, A., 1999. Acute health effects of the Mt. Ruapehu (New Zealand) volcanic eruption of June 1996. Int. J. Environ. Health Res. 9, 97–107. Horizons, 2012. Sulphur smell returns to region. http://www.horizons.govt.nz/about-us/ who-what-where/news/sulphur-smell-returns-to-region/ (accessed 4 March 2014).
Hurst, A.W., 1994. ASHFALL — a computer program for estimating volcanic ash fallout: report and users guide. Science Report 94/23. Institute of Geological & Nuclear Sciences(22 pp.). Hurst, A.W., Smith, W.D., 2010. Volcanic ashfall in New Zealand : probabilistic hazard modelling for multiple sources. N. Z. J. Geol. Geophys. 53, 1–14. Hurst, A.W., Jolly, A.D., Sherburn, S., 2014. Precursory characteristics of the seismicity before the 6 August 2012 eruption of Tongariro volcano, North Island, New Zealand. J. Volcanol. Geotherm. Res. (this volume). IAVCEI Subcommittee for Crisis Protocols, 1999. Professional conduct of scientists during volcanic crises. Bull. Volcanol. 60, 323–334. International Volcanic Health Hazard Network (IVHHNa), 2014. The International Volcanic Health Hazard Network. http://www.ivhhn.org/ (accessed July 2014). International Volcanic Health Hazard Network (IVHHNb), 2014. The Health Hazards of Volcanic Ash: A Guide for the Public. IVHHN, ((15 pp.). http://www.ivhhn.org/ images/pamphlets/health_guidelines_english_print_imposed.pdf [accessed 4 March 2014]). International Volcanic Health Hazard Network (IVHHNc), 2014. Guidelines for Preparedness Before, During and After an Ashfall. IVHHN, ((15 pp.) http://www.ivhhn.org/ images/pamphlets/preparedness_guidelines_english_print_imposed.pdf [accessed 4 March 2014]). Jibson, R.W., Harp, E.L., Michael, J.A., 2000. A method for producing digital probabilistic seismic landslide hazard maps. Eng. Geol. 58, 271–289. Johnston, D.M., Bebbington, M.S., Lai, C.-D., Houghton, B.F., Paton, D., 1999. Volcanic hazard perceptions: comparative shifts in knowledge and risk. Disaster Prev. Manag. 8, 118–126. Johnston, D.M., Houghton, B.F., Neall, V.E., Ronan, K.R., Paton, D., 2000. Impacts of the 1945 and 1995–1996 Ruapehu eruptions, NZ: an example of increasing societal vulnerability. GSA Bull. 112, 720–726. Jolly, G.E., Keys, H., Procter, J.N., Deligne, N.I., 2014a. Overview of the co-ordinated risk-based approach to science and management response and recovery for the 2012 eruptions of Tongariro volcano, New Zealand. J. Volcanol. Geotherm. Res. (this volume). Jolly, A.D., Jousset, P., Lyons, J.J., Carniel, R., Fournier, N., Fry, B., Miller, C., 2014b. Seismoacoustic evidence for an avalanche driven phreatic eruption through a beheaded hydrothermal system: An example from the 2012 Tongariro eruption. J. Volcanol. Geotherm. Res. (this volume). Jolly, A.D., Lokmer, I., Kennedy, B., Keys, H.J.R., Proctor, J., Lyons, J.J., Jolly, G.E., 2014c. Active seismic sources as a proxy for seismic surface processes: An example from the 2012 Tongariro volcanic eruptions, New Zealand. J. Volcanol. Geotherm. Res. (this volume). Keys, H.J.R., Green, P.M., 2008. Ruapehu lahar New Zealand 18 March 2007: lessons for hazard assessment and risk mitigation 1995–2007. J. Disaster Res. 3, 284–296. Kilgour, G.N., Manville, V.R., Della-Pasqua, F.N., Graettingera, A., Hodgson, K.A., Jolly, G.E., 2010. The 25 September 2007 eruption of Mount Ruapehu, New Zealand: directed ballistics, surtseyan jets, and ice-slurry lahars. J. Volcanol. Geotherm. Res. 191, 1–14. Lechner, P., 2014. Living with volcanic ash episodes in civil aviation. Civil Aviation Authority of New Zealand Tech. Note. (https://www.caa.govt.nz/Meteorology/Living_with_ Volcanic_Ash.pdf [accessed July 2014]). Legator, M.S., 2001. Health effects from chronic low-level exposure to hydrogen sulfide. Arch. Environ. Health 56, 123–131. Leonard, G.S., Johnston, D.M., Paton, D., Christianson, A., Becker, J., Keys, H., 2008. Developing effective warning systems: ongoing research at Ruapehu volcano, New Zealand. J. Volcanol. Geotherm. Res. 172, 199–215. Liu, S.B., Palen, L., 2010. The new cartographers: crisis map mashups and the emergence of neogeographic practice. Cartogr. Geogr. Inf. Sci. 37, 69–90. Lube, G., Breard, E.C.P., Cronin, S.J., Procter, J.N., Brenna, M., Moebis, A., Pardo, N., Stewart, R.B., Jolly, A.D., Fournier, N., 2014. Dynamics of surges generated by hydrothermal blasts during the 6 August 2012 Te Maari eruption, Mt. Tongariro, New Zealand. J. Volcanol. Geotherm. Res. (this volume). Macías, J., Capra, L., Arce, J., Espíndola, J., García-Palomo, A., Sheridan, M., 2008. Hazard map of El Chichón volcano, Chiapas, México: constraints posed by eruptive history and computer simulations. J. Volcanol. Geotherm. Res. 175, 444–458. Marlborough Express, 2012. Tongariro eruption sulphur smell in Blenheim08.08.2012 http://www.stuff.co.nz/marlborough-express/news/7438976/Tongariro-eruptionSulphur-smell-in-Blenheim (accessed March 2014). McDougall, K., 2012. An assessment of the contribution of volunteered geographic information during recent natural disasters. Spatially Enabling Government, Industry and Citizens: Research and Development Perspectives. GSDI Association Press, Needham, pp. 201–214. McGuire, W., Solana, M., Kilburn, C., Sanderson, D., 2009. Improving communication during volcanic crises on small, vulnerable islands. J. Volcanol. Geotherm. Res. 183, 63–75. Mersham, G., 2010. Social media and public information management: the September 2009 tsunami threat. Media Int. Aust. 137, 130–143. Mersham, G., Theunissen, P., 2011. “New Zealand's darkest day”. The representation of national grief in the media: the case of the Christchurch earthquake. Interdiscip. J. Study Arts Humanit. South. Afr. 18, 386–403. MIAVITA, 2012. Handbook for Volcanic Risk Management: Prevention, Crisis Management, Resilience. MIAVITA, Orleans ((198 pp.). http://www.globalvolcanomodel. org/miavita/miavita-handbook.pdf [accessed March 2014]). Ministry for Primary Industries (MPI), 2012. Volcanic eruption: impacts and hazard mitigation for New Zealand's primary production industries. Adverse Events (Series). MPI, Wellington (8 pp.). Ministry of Civil Defence and Emergency Management (MCDEM), 2009. The Guide to the National Civil Defence Emergency Management Plan 2006, Revised 2009. MCDEM, Wellington ((266 pp.). http://www.civildefence.govt.nz/memwebsite.nsf/wpg_URL/
Please cite this article as: Leonard, G.S., et al., Integrating multidisciplinary science, modelling and impact data into evolving, syn-event volcanic hazard mapping and communication..., J. Volcanol. Geotherm. Res. (2014), http://dx.doi.org/10.1016/j.jvolgeores.2014.08.018
G.S. Leonard et al. / Journal of Volcanology and Geothermal Research xxx (2014) xxx–xxx For-the-CDEM-Sector-Publications-The-Guide?OpenDocument [accessed March 2014]). Ministry of Civil Defence and Emergency Management (MCDEM), 2014. Civildefence.org. nz. http://www.civildefence.govt.nz/ (accessed July 2014). Ministry of Health (MoH), 2014. Keeping safe from volcanic ash. http://www.health.govt. nz/your-health/healthy-living/emergency-management/protecting-your-healthnatural-disaster/keeping-safe-volcanic-ash (accessed July 2014). Nave, R., Isaia, R., Vilardo, G., Barclay, J., 2010. Re-assessing volcanic hazard maps for improving volcanic risk communication: application to Stromboli Island, Italy. J. Maps 6, 260–269. Neild, J., O'Flaherty, P., Hedley, P., Underwood, R., Johnston, D.M., Christenson, B.W., Brown, P., 1998. Impact of a volcanic eruption on agriculture and forestry in New Zealand. MAF Policy Technical Paper 99/2. MAF, Wellington (101 pp.). Orsi, G., Di Vito, M.A., Isaia, R., 2004. Volcanic hazard assessment at the restless Campi Flegrei caldera. Bull. Volcanol. 66, 514–530. Osti, R., Tanaka, S., Tokioka, T., 2008. Flood hazard mapping in developing countries: problems and prospects. Disaster Prev. Manag. 17, 104–113. Pachauri, A.K., Pant, M., 1992. Landslide hazard mapping based on geological attributes. Eng. Geol. 32, 81–100. Pardo, N., Cronin, S.J., Németh, K., Brenna, M., Schipper, C.I., Breard, E., White, J.D.L., Procter, J., Stewart, B., Agustín-Flores, J., Zernack, A., Kereszturi, G., Lube, G., Auer, A., Neall, V., Wallace, C., 2014. Perils in distinguishing phreatic from phreatomagmatic ash; insights into the eruption mechanisms of the 6 August 2012 Mt. Tongariro eruption, New Zealand. J. Volcanol. Geotherm. Res. (this volume). Partnership for Public Warning (PPW), 2003. Improving the Effectiveness of the Homeland Security Advisory System, Partnership for Public Warning Report by the Workshop on Effective Hazard Warnings, Emmitsburg2002 http://www.tetontectonics. org/Warning/PPW%20HomelandSecurityReport2002.pdf (accessed March 2014). Paton, D., Johnston, D., Houghton, B.F., 1998. Organisational response to a volcanic eruption. Disaster Prev. Manag. 7, 5–13. Paton, D., Millar, M., Johnston, D.M., 2001a. Community resilience to volcanic hazard consequences. Nat. Hazards 24, 157–169. Paton, D., Johnston, D., Smith, L., Millar, M., 2001b. Responding to hazard effects: promoting resilience and adjustment adoption. Aust. J. Emerg. Manag. 16, 47–52. Paton, D., Smith, L., Daly, M.C., Johnston, D.M., 2008. Risk perception and volcanic hazard mitigation: individual and social perspectives. J. Volcanol. Geotherm. Res. 172, 179–188. Patra, A.K., Bauer, A.C., Nichita, C.C., EPitman, E.B., Sheridan, M., Bursik, M., Rupp, B., Webber, A., Stinton, A.J., Namikawa, L.M., Renschler, C.S., 2005. Parallel adaptive numerical simulation of dry avalanches over natural terrain. J. Volcanol. Geotherm. Res. 1–21. Pitman, E.B., Le, L., 2005. A two-fluid model for avalanche and debris flows. Phil. Trans. R. Soc. A 363 (1832), 1573–1601. Poole, M., 2012. Public information management in Christchurch following the February 2011 earthquake: lessons learned. Aust. J. Emerg. Manag. 27, 7–14. Procter, J.N., Cronin, S.J., Fuller, I.C., Sheridan, M., Neall, V.E., Keys, H., 2010a. Lahar hazard assessment using Titan2D for an alluvial fan with rapidly changing geomorphology: Whangaehu River, Mt. Ruapehu. Geomorphology 116, 162–174. Procter, J.N., Cronin, S.J., Platz, T., Patra, A., Dalbey, K., Sheridan, M., Neall, V., 2010b. Mapping block-and-ash flow hazards based on Titan 2D simulations: a case study from Mt. Taranaki, NZ. Nat. Hazards 53, 483–501. Procter, J.N., Cronin, S.J., Sheridan, M.F., 2012. Evaluation of Titan2D modelling forecasts for the 2007 Crater Lake break-out lahar, Mt. Ruapehu, New Zealand. Geomorphology 136, 95–105. Procter, J.N., Cronin, S.J., Zernack, A.V., Lube, G., Stewart, R.B., Nemeth, K., Keys, H., 2014. Debris flow evolution and activation of an explosive hydrothermal system; Te Maari, Tongariro, New Zealand. J. Volcanol. Geotherm. Res. (this volume).
25
Saucedo, R., Macías, J.L., Sheridan, M.F., Bursik, M.I., Komorowski, J.C., 2005. Modeling of pyroclastic flows of Colima Volcano, Mexico: implications for hazard assessment. J. Volcanol. Geotherm. Res. 139, 103–115. Scott, B.J., Potter, S.H., 2014. Aspects of historical eruptive activity and volcanic unrest at Mt. Tongariro, New Zealand: 1846–2013. J. Volcanol. Geotherm. Res. (this volume). Scott, B.J., Travers, J., 2009. Volcano monitoring in NZ and links to SW Pacific via the Wellington VAAC. Nat. Hazards 51, 263–273. Sheridan, M.F., Stinton, A.J., Patra, A., Pitman, E.B., Bauer, A., Nichita, C.C., 2005. Evaluating Titan2D mass-flow model using the 1963 Little Tahoma Peak avalanches, Mount Rainier, Washington. J. Volcanol. Geotherm. Res. 139, 89–102. Sheridan, M.F., Patra, A.K., Dalbey, K., Hubbard, B., 2010. Probabilistic digital hazard maps for avalanches and massive pyroclastic flows using TITAN2D. Spec. Pap. Geol. Soc. Am. 464, 281–291. Stewart, C., Horwell, C.J., Plumlee, G., Cronin, S., Delmelle, P., Baxter, P., Calkins, J., Damby, D., Morman, S., Oppenheimer, C., 2013. Protocol for analysis of volcanic ash samples for assessment of hazards from leachable elements. IAVCEI Commissions joint report. International Volcanic Health Hazard Network and Cities and Volcanoes, ((21 pp.). http://www.ivhhn.org/guidelines.html [accessed July 2014]). Sutton, J.N., 2012. When online is off: public communications following the February 2011 Christchurch, NZ earthquake. In: Rothkrantz, L., Ristvej, J., Franco, Z. (Eds.), Proceedings of the 9th International ISCRAM Conference — Vancouver, Canada, April 2012 (6 pp.). Topping, W.W., 1974. Some Aspects of Quaternary History of Tongariro Volcanic Centre(PhD (Geology) Thesis) Victoria University of Wellington, (374 pp.). Turner, R., Moore, S, Pardo, N., Kereszturi, G., Uddstrom, M., Hurst, T., Cronin, S., 2014. The use of a Numerical Weather Prediction model to explain patterns of observed ash deposition and dispersion following the August 2012 Te Maari, New Zealand eruption. J. Volcanol. Geotherm. Res. (this volume). UNISDR, 2009. 2009 UNISDR Terminology on Disaster Risk Reduction. United Nations International Strategy for Disaster Reduction, Geneva ((30 pp.). http://www.unisdr. org/we/inform/publications/7817 [accessed March 2014]). United Nations, 2005. Hyogo Framework for Action 2005–2015: building the resilience of nations and communities to disasters. Resolution 2, World Conference on Disaster Reduction in Kobe, Japan, 18–22 January 2005. United Nations, A/CONF.206/6 (The full report of the WCDR, which also contains the Hyogo Framework, is available in several languages at http://www.unisdr.org/we/coordinate/hfa [accessed March 2014]). US Geological Survey (USGS), 2014. Volcanic Ash: What It Can Do and How to Prevent Damage. http://volcanoes.usgs.gov/ash/ (accessed July 2014). Wardman, J.B., Wilson, T.M., Bodger, P.S., Cole, J.W., Johnston, D.M., 2012. Investigating the electrical conductivity of volcanic ash and its effect on HV power systems. Phys. Chem. Earth 45–46, 128–145. Weinstein, P., Patel, A., 1997. The Mount Ruapehu eruption 1996: a review of potential health effects. Aust. N. Z. J. Public Health 21, 773–778. Williams, K.L., Keys, H.J.R., 2013. Reducing volcanic risk of the Tongariro Alpine Crossing. Report of Workshop, 24 September, 2013. Department of Conservation, Tongariro District, Whakapapa Village (35 pp.). Wilson, T.M., Stewart, C., Sword-Daniels, V., Leonard, G.S., Johnston, D.M., Cole, J.W., Barnard, S.T., 2012. Volcanic ash impacts on critical infrastructure. Phys. Chem. Earth 45 (46), 5–23. Wilson, T.M., Stewart, C., Wardman, J., Wilson, G., Johnston, D.M., Hill, D., Hampton, S.J., Villemure, M., McBride, S., Leonard, G., Daly, M., Deligne, N.I., Roberts, L., 2014. Volcanic ashfall preparedness poster series: a collaborative process for reducing the vulnerability of critical infrastructure. J. Appl. Volcanol. 3, 10.
Please cite this article as: Leonard, G.S., et al., Integrating multidisciplinary science, modelling and impact data into evolving, syn-event volcanic hazard mapping and communication..., J. Volcanol. Geotherm. Res. (2014), http://dx.doi.org/10.1016/j.jvolgeores.2014.08.018