390. 391. 392. 393. 394. 395. 396. 397. 398. 399 a size of just a few pixels and changing atmospheric ..... 650. 651. 652. 653. 654. 655. 656. 657. 658. 659. 660. 661. 662. 663. 664. 665 ..... [33] X. Wang, K. T. Ma, G. Ng and W. E. L. Grimson.
ICCV #****
100 101 102 103 104 105 106 107 108 109 110 111 112 113 114 115 116 117 118 119 120 121 122 123 124 125 126 127 128 129 130 131 132 133 134 135 136 137 138 139 140 141 142 143 144 145 146 147 148 149
ICCV 2011 Submission ****. CONFIDENTIAL REVIEW COPY. DO NOT DISTRIBUTE.
ICCV #****
Integrating pedestrian simulation, tracking and event detection for crowd analysis Anonymous ICCV submission Paper ID ****< replace **** here and in header with paperID> overview describing the different approaches and their objectives can be found in Schadschneider et al. [30]. However, the validation of pedestrian simulations is still an open research field. To assure the correctness of simulation results they have to be compared with realworld data captured in the field. A number of small-scale investigations have been carried out already, e.g. Seyfried et al. [31] conducted experiments which examine flows through bottlenecks to gain validation data. Another experiment was conducted by Moussaid et al. [21], where participants walk along a corridor from both directions to examine evading behavior of pedestrians. However, up to now data from real-life situations is not considered very often for validation due to lack of data. In contrast, the framework presented in this paper aims at integrating simulation results and tracking results of crowds from an every-day situation to validate the simulation model. The utilization of image sequences and video data from airborne sensor platforms for surveillance applications such as object tracking has been studied for several years, e.g. [10, 27]. However, research on tracking of people in airborne data is limited. In Miller et al. [20] individuals are detected using corner features, but the results are not satisfying. The work of Reilly et al. [28] received promising detection results including people´s shadow in the object model. In our approach, we integrate this information directly in an appearance-based model to deal with coarse image information. The use of extracted trajectories of pedestrians for event detection has been done in several approaches [4, 22, 23, 25, 33]. A basic tool for the analysis of trajectories are Hidden Markov Models (HMM) [26], which serves for further extensions for event detection and trajectory analysis [22, 23]. Systems for trajectory analysis, region modeling and trajectory mining are well investigated and are still an important topic [4, 22, 25, 33]. However, the basis for such systems are big datasets of only recurring trajectories, as for example at shopping malls or parking lots, which have to be available for each scene of interest. But, there is a lack of prior trajectory datasets at specific big events, where automatic event detection has to be performed spontaneously. Event detection of individual behavior [6] or events which are composed of up to only
Abstract In this paper, an overall framework for crowd analysis is presented. Detection and tracking of pedestrians as well as detection of dense crowds is performed on image sequences to improve simulation models of pedestrian flows. Additionally, graph-based event detection is performed by using Hidden Markov Models on pedestrian trajectories utilizing knowledge from simulations. Experimental results show the benefit of our integrated framework using simulation and real-world data for crowd analysis.
1. Introduction We present an interdisciplinary framework for the analysis of crowds in real-world scenarios which integrate the benefits of simulation techniques, detection and tracking of pedestrians, detection of dense crowds and event detection. Crowd analysis and simulation are emerging fields of research which are motivated by security and monitoring issues in crowded areas. Recent surveys show the achievements and unsolved problems in vision-based crowd analysis, dealing with detection, tracking, occlusion handling, crowd modeling and event inference [15, 17, 34]. The review of Dee and Velastin [7] tries to answer the question “How close are we to solving the problem of automated visual surveillance?”, concluding that much work remains in the field of behavior analysis in unstructured and changing environments. Depending on the scene and the application, the scale of the object which is analyzed ranges from individuals [6] to crowds themselves [1]. On the other hand, significant research has been conducted to simulate pedestrian dynamics to predict possible conflict points or bottlenecks. There exists a variety of different simulation models: macroscopic models like network-based models [11] or fluid-dynamics models [14] as well as microscopic models like e.g. the Social Force Model [13] or Cellular Automata [3]. A good
1
150 151 152 153 154 155 156 157 158 159 160 161 162 163 164 165 166 167 168 169 170 171 172 173 174 175 176 177 178 179 180 181 182 183 184 185 186 187 188 189 190 191 192 193 194 195 196 197 198 199
ICCV #****
200 201 202 203 204 205 206 207 208 209 210 211 212 213 214 215 216 217 218 219 220 221 222 223 224 225 226 227 228 229 230 231 232 233 234 235 236 237 238 239 240 241 242 243 244 245 246 247 248 249
ICCV 2011 Submission ****. CONFIDENTIAL REVIEW COPY. DO NOT DISTRIBUTE.
two people [23] sufficiently copes with behavior of individuals and abandons prior trajectory datasets, but cannot deal with large groups of pedestrians. In contrast, we aim at modeling the behavior of larger groups of people using simulations and tracked pedestrians as input information. In the next section, we introduce our simulation model applied to a daily-life scenario. Afterwards, the detection and tracking of pedestrians and the detection of dense crowds is presented. In Section 4, we give an overview of our event detection approach using the before derived information. The results using all these developed parts for the analysis of crowds are shown in Section 5 to highlight the benefit of this overall framework.
ICCV #****
2.2. Scenario Each simulated scene is called a scenario. It consists of one or more sources, obstacles and destinations. Pedestrians are generated from sources. The number of generated pedestrians can be adjusted in each time step. Each pedestrian walks towards a destination which has been assigned during generation. Obstacles refer to walls or fences as well as buildings or booths. The scenario of our test case is shown in Fig. 2.
2. Simulation of pedestrians 2.1. Model description To simulate pedestrian crowds, a microscopic approach is used, which consists of several layers: The time and space discretization is modeled by a cellular automaton, which forms the basic layer. To model pedestrians’ locomotion, a combination of potentials is applied. Each pedestrian is influenced by different forces: a driving force to the destination, repellent forces of obstacles situated on the way to a destination as well as repellent forces of other pedestrian, who walk within the scenario. These forces are superimposed into one potential field. The corresponding value from the potential field is mapped to each cell of the automation, corresponding to the position of the cell. A detailed description of the potentials approach can be found in Hartmann [12]. The third layer describes the navigation layer, which models the spatial orientation of pedestrians. The layer is implemented as a navigation graph, on which different routing strategies can be applied, e.g. pedestrians who are familiar / are not familiar with a location [18]. An overview of the model setup is shown in Fig. 1.
Figure 2: Simulation scenario
2.3. Simulation setup To get realistic start parameters we receive the number of pedestrians in the congestion areas through detection of pedestrians as described in the following Section 3.2. The images, to which we compare the simulation results, represent a snapshot of a longer process (cf. Section 5). To get a simulation state comparable to the snapshot, we need an init phase, during which the pedestrians who are generated by the sources in the lower part of the scenario walk towards the crowds in front of the entrances in the upper part (Fig. 2). The following main phase refers to the snapshot from the images, which we compare to the measures from Section 3.
3. Detection and tracking of pedestrians and crowds 3.1. Detection and tracking of pedestrians The detection and tracking of pedestrians in aerial image sequences is a challenging task. A single person has
Figure 1: Model setup of the simulation.
2
250 251 252 253 254 255 256 257 258 259 260 261 262 263 264 265 266 267 268 269 270 271 272 273 274 275 276 277 278 279 280 281 282 283 284 285 286 287 288 289 290 291 292 293 294 295 296 297 298 299
ICCV #****
300 301 302 303 304 305 306 307 308 309 310 311 312 313 314 315 316 317 318 319 320 321 322 323 324 325 326 327 328 329 330 331 332 333 334 335 336 337 338 339 340 341 342 343 344 345 346 347 348 349
ICCV 2011 Submission ****. CONFIDENTIAL REVIEW COPY. DO NOT DISTRIBUTE.
ICCV #****
using the following states: position, color and direction of motion. The latter is determined by calculating optical flow between consecutive images. The states of every object are predicted for the next frame with a linear dynamic model. Afterwards the prediction has to be associated with new detection to form tracks. We apply the efficient gating strategy of [5] to reduce the number of potential association candidates to a minimum. Each link between prediction and detection is weighted by evaluating their state similarity. The established data association problem is solved in a fast way by using the conservative direct link method of [16]. Objects associated with an observation are updated while unassigned objects are considered lost and are not tracked further. Unassigned observations are marked as new objects. In a final step tracks are rejected if the mean confidence score of all associated detections is below a certain threshold.
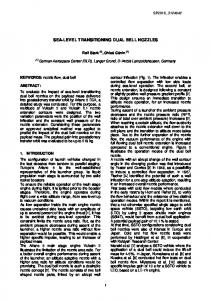
a size of just a few pixels and changing atmospheric conditions can lower the visibility even more (Fig. 3). Furthermore, the number of people can vary from hundreds up to many thousands which all look very much alike. In this section we present the features of our detection and tracking approach which can handle the mentioned challenges.
Figure 3: Example of a person with and without shadow at a pixel size of 0.15 m.
3.1.1. Detection. We utilize an appearance-based approach for object detection since this method has been successfully applied for very small objects, e.g. cars in satellite images [19] or spots in microscopy images [32]. The approach works on single images and can therefore detect small and static objects as opposed to the standard but error-prone methods for moving object detection. The shadow of a person is a very important cue for detection. Therefore, we have designed a detector which covers the body of a person and also its potential shadow. A normalization procedure ensures that the shadow will always point in upward direction. We extract color and shape features inside the detection window and pass them to a trained Gentle AdaBoost classifier [9]. It produces a confidence score about the presence of a person at the location of evaluation. By running the customized detector over the region of interest inside an aerial image, we get an independent confidence measure at every pixel position. We therefore estimate the continuous confidence distribution with a Gaussian kernel. Potential object positions are finally extracted by applying non-maxima suppression and a detection threshold for minimal confidence. The results of the detection stage are the base of the following tracking-by-detection approach. A very low detection threshold ensures that the number of misses stays at a minimum and that the tracking procedure has enough input. The final decision between object and clutter is postponed to the end of the tracking stage, where more information is available.
3.1.3. Further analysis. The generated trajectories are reliable but rather short. Hence, their potential use for individual motion analysis is still limited. Future improvements aim on generating longer trajectories even in complex situations. However, the results can be used to estimate the total number of person in the scene and their general motion. The latter can be determined easily given the generated tracklets. The displacement in object position between consecutive frames can be converted directly in a velocity measure since pixel size and frame rate are known. The total number of people can be estimated easily by knowing the specific performance range of the detection algorithm: TP TP correctness P x P ' P P' (1) P' P completeness xmin P ' P xmax P '
(2)
The detected number of individuals P ' can be converted into the true number P by multiplication with the ratio of correctness and completeness. If the variance of the ratio has been determined in advance, it is possible to make a good estimate for the lower and upper bounds of the true number of people in a scene.
3.2. Detecting dense crowd regions
3.1.2. Tracking. Tracking people in aerial image sequences requires an algorithm that can handle lots of similar objects at the same time. Further challenges arise due to the low frame rate of e.g. 2 Hz and deviations in image alignment. We adapt an iterative Bayesian tracking approach for our application, similar to the one used by [2] to track a large number of flying bats. A single person is described
The proposed approach presented in the above section will probably fail in dense crowds, because aerial image resolutions do not enable to see each person with sharp contours and details (Fig. 4). However, a local change of the color components at the pixels where a person exists can be noticed. Therefore, we develop a dense crowd detection approach depending on local features extracted from chroma bands of the input images.
3
350 351 352 353 354 355 356 357 358 359 360 361 362 363 364 365 366 367 368 369 370 371 372 373 374 375 376 377 378 379 380 381 382 383 384 385 386 387 388 389 390 391 392 393 394 395 396 397 398 399
ICCV #****
400 401 402 403 404 405 406 407 408 409 410 411 412 413 414 415 416 417 418 419 420 421 422 423 424 425 426 427 428 429 430 431 432 433 434 435 436 437 438 439 440 441 442 443 444 445 446 447 448 449
ICCV 2011 Submission ****. CONFIDENTIAL REVIEW COPY. DO NOT DISTRIBUTE.
follow an estimation approach which is slightly different from balloon estimators. First, we pick 20 numbers of random observations (FAST feature locations) to reduce the computation time. For each observation location, we compute the distance to the nearest neighbor observation point. Then, the mean of all distances give us a number l. We assume that variance of Gaussian kernel (σ2) should be equal or greater than l. In order to guarantee to intersect kernels of two close observations, we assume variance of Gaussian kernels as 5l. This automatic kernel bandwidth estimation method makes the algorithm robust to scale and resolution changes. Afterwards, we use Otsu’s automatic thresholding method on this pdf to detect regions having high probability values [24]. After thresholding our pdf function in the obtained binary image we eliminate small regions since they cannot indicate large human crowds.
Figure 4: Example of a crowd (top and left) and few single persons (bottom) at a pixel size of 0.15 m.
For local feature extraction, we use features from accelerated segment test (FAST) method. The FAST method is especially developed for corner detection purposed by Rosten et al. [29], but the method also detects small regions which are significantly different than their surrounding pixels. We start with converting RGB input image into CIELab color space. CIELab color space bands are preferred since they are able to enhance different colors best and minimize color variances [8]. After transforming, we obtain again three bands as L (intensity value) and a, b (chroma information of the pixels independently from illumination). To detect small regions which have significant color variance compared to their surrounding, we extract FAST features from a and b chroma bands of the image. As local feature, we use (xi,yi) i є [1,2,…,Ki] locations which holds FAST features extracted from a and b image bands. Extracted FAST features will behave as observations of the probability density function (pdf) of the dense crowd locations to be estimated. For dense crowd regions, we assume that more local features should come together. Therefore, knowing the pdf will lead to detection of crowds. For pdf estimation, we benefit from a kernel based density estimation method. Using symmetric Gaussian functions as kernel, the estimated pdf is formed as follows:
p ( x, y )
x xi 2 y yi 2 1 Ki 1 exp 2 R i 1 2
ICCV #****
4. Graph-based event detection using Hidden Markov Models (HMM) We perform event detection in image sequences containing large groups of people. Trajectories of tracked pedestrians (cf. Section 3) are used to construct a dynamic pedestrian graph which comprises all detected pedestrians in the scene. Triggered by the existence of edges in the graph, HMM-based analysis of the pairwise motion interaction between pedestrians is performed. Supported by simulation results (cf. Section 2), the event detection module can be focused on potentially dangerous spots in the scene.
4.1. Motion model Motion interaction between pedestrians is analyzed by inferring the type of motion pattern of two neighboring trajectories, which itself is derived from a set of three motion features. Three motion features are computed from a pair of neighboring trajectories at each frame, beginning with the second frame of the sequence. The first motion feature is the sum of the velocities of both pedestrians vij . The
(3)
second motion feature is the variation of the distance between both pedestrians d dt / dt 1 , with dt 1 being the distance at frame t 1 and dt being the distance at frame t . Thus, d 1 at an increasing distance and d 1 at a decreasing distance. The third motion feature is the average pedestrian density in an area with radius r around both pedestrians (nij ) .
where σ is the bandwidth of Gaussian kernel and R is the normalizing constant to normalize p(x,y) between [0,1]. In kernel based density estimation, the main problem is how to choose the bandwidth of Gaussian kernel for a given test image, since the estimated pdf directly depends on this value. In probability theory, there are several methods to estimate the bandwidth of kernel functions for given observations such as statistical classification or using balloon estimators. Unfortunately, those well-known approaches need high computation time for large input images having very high number of observation points (local features). For this reason, we
We define six simple pairwise motion patterns which commonly occur at adjacent pedestrians. Pairwise motion patterns are suitable for event detection in crowds, because they focus on motion interaction between pedestrians. In contrast, a single person walking on an
4
450 451 452 453 454 455 456 457 458 459 460 461 462 463 464 465 466 467 468 469 470 471 472 473 474 475 476 477 478 479 480 481 482 483 484 485 486 487 488 489 490 491 492 493 494 495 496 497 498 499
ICCV #****
500 501 502 503 504 505 506 507 508 509 510 511 512 513 514 515 516 517 518 519 520 521 522 523 524 525 526 527 528 529 530 531 532 533 534 535 536 537 538 539 540 541 542 543 544 545 546 547 548 549
ICCV 2011 Submission ****. CONFIDENTIAL REVIEW COPY. DO NOT DISTRIBUTE.
ICCV #****
fragments of length 1 or 2 provide no meaningful motion information and increase the computational cost.
open area has no motion interaction to other pedestrians and, thus, is of minor interest for event detection in groups. The six motion patterns are together standing, together queuing, parallel walking, parallel running, diverging, converging, each defined by specific intervals of the three motion features.
5. Experimental results The dataset used for this study is an image sequence taken by an airborne camera platform showing the entrance area of a soccer stadium. The images are taken at a frame rate of 2 Hz, the length of the analyzed image sequence is 8 sec, the ground resolution is 0.15 m. For the experimental results, we focus on the area in the south of the stadium gates, where thousands of people are approaching the stadium.
4.2. Dynamic pedestrian graph Managing large groups of pedestrians can ideally be performed by constructing a spatio-temporal dynamic pedestrian graph in which nodes represent pedestrians and edges represent interactions between pedestrians. The dynamic pedestrian graph can change its topology at every frame and is flexible to the number of included nodes. The number of edges is kept low by considering only those interactions which take place between directly adjacent pedestrians. This is done by introducing a Gaussian weight function in which the width is depending on the local pedestrian density. The dynamic pedestrian graph is updated at every frame by introducing edges which represent interaction between converging pedestrians or deleting edges which represent interaction between diverging edges.
5.1. Simulation of pedestrians The simulation scenario for the stadium dataset is illustrated in Fig. 2. We use measures such as densities and velocities to validate the results of the simulation as well as a visual comparison between the images and the simulation. In Fig. 5 simulation snapshots of actual positions and moving directions of simulated pedestrians are shown at the beginning of the tracking phase. In addition, Fig. 6 shows the same snapshots at the end of the tracking phase. These plots can now be compared with the real-world data to check for matches (cf. following sections and Fig. 7). In our example one can observe the same pattern of pedestrians moving in real vs. pedestrian moving in the simulation. The density within the center dense crowd region can be reproduced by the simulation: The crowd detection data shows a density of 0.81 persons per square meter, whereas the simulation produces a density of 0.79. Furthermore, the derived velocities from the tracking results of the real-world data are used to improve the model of the simulation velocities. What can be directly observed from the simulation results is the mismatch of the crowd formation. This can be partly explained by the definition of the repellent obstacle potential. Moreover, until now no queuing effect is implemented within the simulation. To improve the matching between simulation results and real-world data, a further refinement of the simulation model is necessary.
4.3. HMM-based event detection The temporal behavior of the motion interaction between two pedestrians is evaluated by Hidden Markov Models (HMM) for each edge in the graph throughout the sequence. Usually, HMM are learned offline from realworld training data containing recurring trajectories in the scene of interest. However, for the surveillance of specific events, no training data is available and the persons cannot be assumed to follow predefined paths. Therefore, we generate synthetic training data which is generated by moving agents. This approach is reliable because the moving agents follow our simple motion model which represents authentic motion interaction of pedestrians. We use about 1000 observations for each of the six motion patterns to train the HMM. The type of interaction between two pedestrians is inferred by HMM for every edge at every frame using the forward algorithm [26]. We construct a HMM-buffer which internally continues the HMM analysis of one interaction for some frames, even if the corresponding edge is deleted. This may occur when two pedestrians slightly deviate to the left or right and depart from each other awhile. By using the HMM-buffer, the interaction inference will not be interrupted during that time and no fragments of the corresponding interaction arise. The event detection module can deal with a varying number of trajectories of varying length. Trajectories that are too short can be eliminated by applying a threshold for the length. This step is necessary because short trajectory
5.2. Detection and tracking results of pedestrians and crowds The results of the detected dense crowds are visualized in Fig. 7 (red boundaries). The derived results demonstrate a reliably detection of dense crowed regions, which are obviously in the front of the gates to the stadium. This information, in particular the dimension and shape of the region, is important to support the simulation model and the detection and tracking of single pedestrians.
5
550 551 552 553 554 555 556 557 558 559 560 561 562 563 564 565 566 567 568 569 570 571 572 573 574 575 576 577 578 579 580 581 582 583 584 585 586 587 588 589 590 591 592 593 594 595 596 597 598 599
ICCV #****
600 601 602 603 604 605 606 607 608 609 610 611 612 613 614 615 616 617 618 619 620 621 622 623 624 625 626 627 628 629 630 631 632 633 634 635 636 637 638 639 640 641 642 643 644 645 646 647 648 649
ICCV 2011 Submission ****. CONFIDENTIAL REVIEW COPY. DO NOT DISTRIBUTE.
ICCV #****
Figure 5: From left to right: Real-world data, actual position simulated pedestrians, moving direction of simulated pedestrians as snapshots at the beginning of the sequence.
Figure 6: From left to right: Real-world data, actual position simulated pedestrians, moving direction of simulated pedestrians as snapshots at the end of the sequence.
Figure 7: Results of the tracked people (yellow) and the reference data (blue), the tracks are pruned to the last six frames. The detected dense crowds are shown with red boundaries.
Figure 8: Event detection result based on tracking results from Fig. 7. Colorbar on the left shows the six motion patterns.
6
650 651 652 653 654 655 656 657 658 659 660 661 662 663 664 665 666 667 668 669 670 671 672 673 674 675 676 677 678 679 680 681 682 683 684 685 686 687 688 689 690 691 692 693 694 695 696 697 698 699
ICCV #****
700 701 702 703 704 705 706 707 708 709 710 711 712 713 714 715 716 717 718 719 720 721 722 723 724 725 726 727 728 729 730 731 732 733 734 735 736 737 738 739 740 741 742 743 744 745 746 747 748 749
ICCV 2011 Submission ****. CONFIDENTIAL REVIEW COPY. DO NOT DISTRIBUTE.
ICCV #****
Figure 9: Event detection result showing the border of the dense crowd in front of the middle entrance (frames no. 2, 4, 7, 10, 13 and 16 are shown). The simulation result in Fig. 5 and Fig. 6 shows a potentially dangerous spot at this location.
shown which represent motion interactions between pedestrians. Edges are labeled by 6 colors, each of it represents one of the six motion patterns. The detected motion interactions are occurring only between small groups. In most instances, our event detection system delivers the results together walking and converging. The approach depends on the density of pedestrians and, thus, more edges in the graph will be constructed when a higher tracking completeness is achieved. In that case, a more significant event detection result will be enabled which incorporates larger groups of people. The simulation results (Fig. 5, Fig. 6) show a location of potential danger at the crowd in front of the middle entrance. Here, the queue gets close to an obstacle such that passing pedestrians might suffer from a bottleneck situation. Fig. 9 shows a sequence of event detection results based on real-world data in this area. For this result we use manually generated reference trajectories to show the potential of our event detection approach. Arriving pedestrians have to slow down in the narrow area such that congestion occurs, shown by an increased number of yellow edges later in the sequence. Therefore, the event detection result confirms the simulated dangerous scenario.
The detection and tracking of individuals is focused to the area excluding the detected dense crowds. The quality of the detection and tracking results are evaluated separately with ground truth data. We define a correct detection if its distance to a reference person is below 50 cm or 3.3 pixel. Our algorithm achieves a correctness of 88% and a completeness of 36 % (Fig. 7). The main cause for the low completeness is the poor visual quality of the image sequence. The contrast is very low and even some thin clouds are moving through. Furthermore, we have lots of people that walk in groups and form blobs which cannot be found by our single person detector. The correctness is good since there is not much person-like clutter present in the scene. The results of tracking are very similar. We compare all automatically generated links between consecutive frames with the reference links. Our algorithm achieves a correctness of 89 % and a completeness of 28 %. The values reflect the conservative setting of our tracking algorithm and also the previous mentioned difficulties of the stadium sequence. We use the detection results to calculate the number of people in the scene as described in section 3.1.3. At first we determine the ratio between correctness and completeness for several different test sequences. It varies between 2.33 and 2.95. We take the median of P ' for all frames, which is 233 and calculate a lower and upper bound. As a result we estimate the total number of people in the region of interest to lie between 515 and 688. The actual number of people in every frame of the reference data varies between 564 and 597 which approves the proposed estimation method for the evaluated sequence.
6. Conclusions We presented a novel integrated framework for the analysis of crowds including all relevant aspects as simulation, detection and tracking of pedestrians and dense crowds and event detection. The exploitation of the different parts in an overall approach lead to a clear benefit as demonstrated with the real-world scenario. Our goal for future work is to enhance the system for arbitrary new scenarios, where only a short image sequence is needed for pedestrian tracking and the results are immediately implemented in the update of the simulation model. These results allow us to focus on specific locations of potential danger, probably depending on simulated different numbers of pedestrians, and operate only there the visual surveillance and event detection. In
5.3. Event detection results The event detection results for pedestrian motion interaction in the test scenario are shown in Fig. 8. The trajectories used for event detection are the tracking results from section 5.2. Fig. 8 shows 252 pedestrian detections (black circles), each of it being part of a trajectory of minimum length 2 and forming a node of the pedestrian interaction graph. In addition, 110 edges are
7
750 751 752 753 754 755 756 757 758 759 760 761 762 763 764 765 766 767 768 769 770 771 772 773 774 775 776 777 778 779 780 781 782 783 784 785 786 787 788 789 790 791 792 793 794 795 796 797 798 799
ICCV #****
800 801 802 803 804 805 806 807 808 809 810 811 812 813 814 815 816 817 818 819 820 821 822 823 824 825 826 827 828 829 830 831 832 833 834 835 836 837 838 839 840 841 842 843 844 845 846 847 848 849
ICCV 2011 Submission ****. CONFIDENTIAL REVIEW COPY. DO NOT DISTRIBUTE.
ICCV #****
[18] A. Kneidl, A. Borrmann and D. Hartmann. Generating sparse navigation graphs for microscopic pedestrian simulation models. EG-ICE Workshop, 2011. [19] J. Leitloff, S. Hinz and U. Stilla. Vehicle detection in very high resolution satellite images of city areas. IEEE Trans. GRS, 48(7):2795–2806, 2010. [20] A. Miller, P. Babenko, M. Hu and M. Shah. Person tracking in uav video. Multimodal Technologies for Perception of Humans, International Evaluation Workshop. Springer, LNCS 4625:215–220, 2008. [21] M. Moussaid, D. Helbing, S. Garnier, A. Johansson, M. Combe and G. Theraulaz. Experimental study of the behavioural mechanisms underlying self-organization in human crowds. Royal Society B- Biological Sciences, 276(1668):2755–2762, 2009. [22] J. C. Nascimento, M. A. T. Figueiredo and J. S. Marques. Trajectory Classification using Switched Dynamical Hidden Markov Models. IEEE Trans. IP, 19(5): 1338–1348, 2010. [23] N. M. Oliver, B. Rosario and A. P. Pentland. A Bayesian Computer Vision System for Modeling Human Interactions. IEEE Trans. PAMI, 22(8):831–843, 2000. [24] N. Otsu. A threshold selection method from gray-level histograms. IEEE Trans. SMC, 9(1):62–66. [25] F. Porikli and T. Haga. Event Detection by Eigenvector Decomposition using Object and Frame Features. CVPR Workshop, on CD, 2004. [26] L. R. Rabiner. A Tutorial on Hidden Markov Models and Selected Applications in Speech Recognition. Proceedings of the IEEE, 77(2): 257–286, 1989. [27] V. Reilly, H. Idrees and M. Shah. Detection and tracking of large number of targets in wide area surveillance. Proceedings of European Conference on Computer Vision. Springer, LNCS 6313:186–99, 2010. [28] V. Reilly, B. Solmaz, M. Shah. Geometric constraints for human detection in aerial imagery. Proceedings of European Conference on Computer Vision. Springer, LNCS 6316:252–265, 2010. [29] E. Rosten, R. Porter, T. Drummond. Faster and Better: A machine learning approach to corner detection. IEEE Trans. PAMI, 32(1):105–119, 2010. [30] A. Schadschneider, W. Klingsch, H. Kluepfel, T. Kretz, C. Rogsch and A. Seyfried. Evacuation dynamics: Empirical results, modeling and applications. Encyclopedia of Complexity and System Science:3142–3176, 2009. [31] A. Seyfried, B. Steffen, A. Winkens, T. Rupprecht, M. Boltes and W. Klingsch. Empirical Data for Pedestrian Flow Through Bottlenecks. Traffic and Granular Flow, Springer: 189–199, 2009. [32] I. Smal, M. Loog, W. Niessen and E. Meijering. Quantitative comparison of spot detection methods in fluorescence microscopy. IEEE Trans. Medical Imaging, 29(2):282–301, 2010. [33] X. Wang, K. T. Ma, G. Ng and W. E. L. Grimson. Trajectory Analysis and Semantic Region Modeling Using Nonparametric Hierarchical Bayesian Models. International Journal of Computer Vision, in print, DOI 10.1007/s11263011-0459-6, 2011. [34] B. Zhan, D.N. Monekosso, P. Remagnino, S.A. Velastin and L. Xu. Crowd Analysis: A Survey. Machine Vision and Applications, 19(5-6):345–357, 2008.
addition, the individual parts of the system will be improved, e.g. a better tracking method to track more pedestrians and an enhanced event detection to include more complex events at a higher hierarchical level.
References [1] E. Andrade and R. Fisher. Hidden Markov Models for optical flow analysis in crowds. ICPR:460–463, 2006. [2] M. Betke, D. E. Hirsh, A. Bagchi, N. I. Hristov, N. C. Makris and T. H. Kunz. Tracking large variable numbers of objects in clutter. CVPR:1–8, 2007. [3] C. Burstedde, K. Klauc., A. Schadschneider and J. Zittartz. Simulation of pedestrian dynamics using a two-dimensional cellular automaton. Physica A: Statistical Mechanics and its Applications, 295(3-4):507–525, 2001. [4] S. Calderara and R. Cucchiara. People Trajectory Mining with Statistical Pattern Recognition. CVPR Workshop, on CD, 2010. [5] J. Collins and J. Uhlmann. Efficient gating in data association with multivariate gaussian distributed states. IEEE Trans. AES, 28(3):909–916, 1992. [6] G. Dalley, X. Wang and W.E.L. Grimson. Event detection using an attention-based tracker. IEEE Workshop PETS,on CD, 2007. [7] H. M. Dee and S. A. Velastin. How close are we to solving the problem of automated visual surveillance? Machine Vision and Applications, 19(5-6):329–343, 2008. [8] M. Fairchild. Color appearance models. Addison Wesley, 1998. [9] J. Friedman, T. Hastie and R. Tibshirani. Additive logistic regression: A statistical view of boosting. The Annals of Statistics, 28(2):337–374, 2000. [10] H. Grabner, T.T. Nguyen, B. Gruber and H. Bischof. Online boosting-based car detection from aerial images. ISPRS Journal of Photogrammetry and Remote Sensing 63(3):382– 396, 2008. [11] H.W. Hamacher, S.A. Tjandra. Mathematical modelling of evacuation problems: A state of the art. Pedestrian and Evacuation Dynamics. International Conference on Pedestrian and Evacuation Dynamics, Springer:227–266, 2002. [12] D. Hartmann. Adaptive pedestrian dynamics based on geodesics. New Journal of Physics, 12(4): 043032, 2010. [13] D. Helbing and P. Molnár. Social Force Model for Pedestrian Dynamics. Physical Review E, 51(5):4282-4286, 1995. [14] L.F. Henderson. On the fluid mechanics of human crowd motion. Transportation Research, 8(6):509–515, 1974. [15] W. Hu, T. Tan, L. Wang and S. Maybank. A survey on visual surveillance of object motion and behaviors. IEEE Trans. SMC-C, 34(3): 334–352, 2004. [16] C. Huang, B. Wu and R. Nevatia. Robust object tracking by hierarchical association of detection responses. ECCV, Springer, LNCS 5303:788–801, 2008. [17] J.C.S. Jacques, S.R. Musse and C.R. Jung. Crowd Analysis Using Computer Vision Techniques. IEEE Signal Processing Magazine, 9:66–77, 2010.
8
850 851 852 853 854 855 856 857 858 859 860 861 862 863 864 865 866 867 868 869 870 871 872 873 874 875 876 877 878 879 880 881 882 883 884 885 886 887 888 889 890 891 892 893 894 895 896 897 898 899