Integrating the Palladio-Bench into the Software Development Process of a SOA Project Andreas Brunnert1 , Alexandru Danciu1 , Christian V¨ogele1 , Daniel Tertilt1 , Helmut Krcmar2 1 fortiss GmbH Guerickestr. 25, 80805 M¨unchen, Germany {brunnert, danciu, voegele, tertilt}@fortiss.org 2 Technische Universit¨at M¨unchen Boltzmannstr. 3, 85748 Garching, Germany
[email protected] Abstract: This paper presents how the performance modeling capabilities of the Palladio-Bench are integrated into the development process of new enterprise applications based on a service-oriented architecture (SOA). The Palladio-Bench is used to predict the performance of applications early in the software development process. To better integrate the Palladio-Bench into this process, an automated transformation of existing software models into Palladio Component Models (PCM) is implemented. These software models contain the business processes represented in the new applications and implementation details such as web services used within the processes. The performance of the modeled applications is mainly influenced by the response times of the web services. Therefore, the web service response time behavior is modeled using software performance curves, which are automatically generated using monitoring data collected during software tests or in the production environment. Several integration tools are developed to support this feedback loop between the different phases of a software life cycle. Besides these integration capabilities, the challenges of using PCM within this project are discussed and future enhancements for the Palladio-Bench itself are proposed.
1
Introduction
The overall goal of the industrial project that we describe in this paper is to transform an existing IT landscape into a service-oriented architecture (SOA). The SOA paradigm describes how loosely coupled software components offer services in a distributed environment. SOA enables the integration of legacy applications and aims at increasing the flexibility of enterprises. However, one of the main concerns when implementing a SOA is the expected performance of the overall system [OBG08, LGZ07]. Legacy systems found in enterprises are often not designed for this type of interaction. New access patterns and additional software layers therefore lead to different performance characteristics. Our goal in this project context is to develop a continuous performance management process that allows to integrate performance evaluations early into the software development process. One of the key tools that we use for this purpose is Palladio-Bench [BKR09]. This paper describes how we apply the Palladio-Bench within this project and our experiences Proc. Kieker/Palladio Days 2013, Nov. 27–29, Karlsruhe, Germany Available online: http://ceur-ws.org/Vol-1083/ c 2013 for the individual papers by the papers’ authors. Copying permitted only for Copyright private and academic purposes. This volume is published and copyrighted by its editors.
30
in terms of the effort required for its introduction in an existing software development process. The remainder of this paper is organized as follows: Section 2 describes the context of the industrial project. Afterwards, Palladio-Bench use cases and enhancements are explained in section 3. Limitations of using Palladio-Bench in the project context and proposed feature enhancements are also outlined in the same section followed by a conclusion and directions for future work in section 4.
2
Project Context
This section explains the project context by describing the transition of the current IT landscape into a SOA. Afterwards, our approach to support this transition by introducing a continuous performance management process is illustrated.
2.1
Transition to a Service-Oriented Architecture
The current IT landscape of our project partner consists of several legacy systems which support business processes isolated from each other. Users performing business operations interact directly with each system by using different user interfaces. This leads to a high redundancy of data as well as to a high overhead for the users. The reason for this overhead is that similar data needs to be managed using different systems which often leads to inconsistencies. Thus, to better support the employees, our partner develops an integrated user interface as single point of entry for all business processes. To support this kind of integration on a user interface layer, the data and processes that are available in the existing legacy applications need to be integrated into the new front-end. For this purpose, a Java Enterprise Edition (EE)-based middleware integration layer is used in their infrastructure. The existing functionalities of the legacy systems are provided using SOAP web services running on Java EE servers as facades in front of the existing systems. This approach allows to provide these services consistently from a service consumer perspective and to abstract the technology differences of the legacy systems. The single services provided by the legacy systems are all connected to an enterprise service bus (ESB) to avoid point-topoint connections between service providers and consumers. The integrated user interface is realized using several JavaServer Faces (JSF)-based web applications that access the web services over the ESB. These applications are created in the software development process using a model-driven development approach. Business logic is modeled as event-driven process chains (EPC) by field specialists during the requirements analysis phase. These EPC models are then transformed to Unified Modeling Language (UML) models. At the same time, the UML models are extended with technical information such as interactions with web services in the design phase. Afterwards, these UML models are transformed into executable components that can be run as JSF web applications on a Java EE server.
31
Software Development Process Requirements Analysis
Design
Implementation
Testing
Production
Performance Monitoring
Performance Prediction Performance Analysis
Continuous Performance Management Process
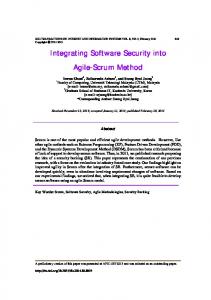
Figure 1: Continuous performance management process
As multiple of these JSF-based web applications need to be developed to support all business processes, several software development projects are necessary to implement the vision of an integrated user front-end. These projects need to carefully evaluate the performance of each new web application, as users of these new front-ends expect similar performance as what they are used to get from their isolated legacy systems.
2.2
Continuous Performance Management Process
The continuous performance management process that we intend to develop supports the development as well as the production phase of new applications. As the performance needs to be investigated early in the software life cycle, our primary project goal is to support the performance evaluation in the software development process. As shown in figure 1, the performance management process consists of three phases: performance prediction, performance analysis and performance monitoring. Each of these phases consists of activities which are required to ensure that given performance requirements can be met. The sum of these activities describe the work that a performance analyst needs to perform in an organization. Performance prediction includes all activities to support performance evaluations early in the development process. During this phase, performance models are derived from UML models created in the design phase. These performance models are parameterized using information about the response times of external systems and the expected user behavior. Using these models as input for a simulation engine allows to evaluate the system performance for different workloads. Performance analysis includes activities that can be performed once running versions of the software applications are available. The performance characteristics of applications are evaluated in this phase using profiling and load testing. The results of these activities are used to optimize the architecture of the applications and to improve test designs. The performance monitoring phase supports all activities to ensure the compliance with defined service-level agreements (SLA) and to gather data about the response time behav-
32
ior of the web services in the SOA environment. The performance management process is designed in a way that performance data gathered using performance measurement and monitoring tools in the test and production phases can be used in the performance prediction and analysis phases. This feedback cycle improves the accuracy of the performance predictions early in the process as existing knowledge (i.e. response time measurements of the SOAP web services) can be reused.
2.3
Performance Management Tool Chain
To support this continuous performance management process, an integrated performance management tool chain (see figure 2) is being developed. This tool chain consists of several tools (such as the Palladio-Bench) to provide an integrated support for the performance management work. Currently, a number of these tools are already available in the organization but they only support isolated performance management activities. For example, several load test, profiling and monitoring tools are already in use. However, these tools are not integrated and the data gathered using such tools is not accessible in all project phases or projects within the organization. Thus, the integration of these tools in order to automate the performance management activities is the main focus of our development efforts. During the test and production phases, performance data (i.e. response times) is collected from running applications and services. This data is aggregated in a performance database and can therefore be used in other phases of the software life cycle to support the performance evaluation. Apart from making existing measurements consistently available to different users in an organization, this data is used to parameterize performance models (see section 2.2). These performance models conform to the Palladio Component Model (PCM) meta model and are used within the Palladio-Bench. The remainder of this paper focuses on the specific use cases for the Palladio-Bench within this tool chain.
3
Palladio-Bench Integration
The Palladio-Bench is used during different phases of the performance management process. One of the main reasons for choosing the Palladio-Bench over other performance modeling tools is the comprehensibility of the performance models. PCM models are easily comprehensible by technical staff in an organization due to the UML alignment and the different views on the system. PCM models also allow to store performance related information that often will not be documented otherwise (i.e. response times or resource demands for specific service operations). The following sections describe use cases and enhancements for the Palladio-Bench within our project context.
33
Performance Prediction • • • • •
Performance Analysis
Response time prediction and analysis for web page transitions Call frequency prediction and analysis for web service operations Service-level agreement (SLA) calculation for web service operations Workload selection for load tests Lead time prediction for business processes Simulate
Model
Measure
PCM Simulation Results
UML to PCM Transformation
Performance Database
Software Performance Curves
Service Providers
Service Consumers
Performance Monitoring
Figure 2: Performance management tool chain [BTVK12]
3.1
Performance Model Generation
To support the performance evaluation early in the development process, PCM models are automatically generated based on UML models in the design phase. A business process is represented by several UML activity diagrams that can reference each other. Thus, specific UML activity diagrams are reused by different business processes. The UML activity diagrams are accessed in a model repository through a Java application programming interface (API) to extract the required information for generating PCM models. Performance models can be generated for a set of business processes selected by the user. The UML activity diagrams contain usage behavior information like usage probabilities and think times as well as the main control flow for the application logic. The usage probabilities and think times are collected through interviews with domain experts. Thus, realistic workload scenarios can be used for the performance evaluation of the new enterprise applications [Men02]. PCM specifies several model layers for different views on a system [BKR09]. Two of the main model layers are the PCM repository and usage models. The PCM usage model specifies the workload on a system and the repository model contains the system components, their behavior and relationships. PCM usage and repository models are generated based on the information in the UML models. The other model layers, namely the PCM resource environment, system and allocation models are generated based on static information. The reason for this decision is that these models specify which hardware resources (i.e. servers and central processing unit (CPU) cores) exist and how the repository model components are mapped to these resources. As the available hardware resources are not changing very often, this information is provided as configuration to the model generation code. In the following, the generation of PCM repository models is explained in detail.
34
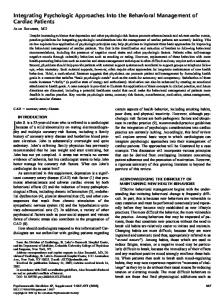
(a) Generated repository model example
(b) Generated RDSEFF for WorkflowComponent.view 1
Figure 3: Generated PCM repository model elements
As a first step, all view-to-view transitions are extracted from the UML activity diagrams. A view is defined as a web page presented to users of an application. For each view, all possible successor views are extracted and the execution flows between the current view and its successors are represented in Resource Demanding Service Effect Specifications (RDSEFF). RDSEFFs are component behavior descriptions similar to UML activitiy diagrams. The generated RDSEFFs are all associated with a so called WorkflowComponent in the PCM repository model (see view 1, view 2 and view 3 in figure 3(a)). Each successor view is dependent on the context (business process) in which a specific view is used. Therefore, a context parameter called process context is used in the corresponding RDSEFFs to differentiate the view-to-view transition behavior for the different business processes. This is shown in figure 3(b), the generated RDSEFF for view 1 receives a process context parameter and uses this parameter to differentiate its behavior according to the business process in which it is used. In this example, the view is used in process1 and process2 and behaves differently depending on the process context. Once all view-to-view transitions are extracted from the UML activity diagrams and their RSDSEFFs are available in a repository model, the single RDSEFFs are connected with each other. This means, that at the end of a view transition in a RSDSEFF, another RDSEFF is called for the new view which then specifies the execution flows for the next possible view transitions. In the example in figure 3(b), view 1 calls the RDSEFF of view 2 when it is called in the context of business process two and the RDSEFF of view 3 if it called in the context of business process one. These interconnected view-to-view transitions specified in the single RDSEFFs, model the complete execution flow of a business process. The usage behavior for different business processes can thus be easily modeled by calling the first view of the process and specifying the current process name in the process context parameter. This parameter is then used in all RDSEFFs that are called within the execution flow, as it is passed on when another view RDSEFF is called (see figure 3(b)).
35
During the transitions between the different views, calls to external web services are represented in the UML activity diagrams. Thus, each RDSEFF does not only contain views, think times as well as the probabilities for specific execution flows but also references to external web services (see figure 3(b)). For each web service found in the UML models, a new PCM component interface is created in the PCM repository model (i.e. web service 1 in figure 3(a)). How the behavior of these service interfaces is represented in PCM models is explained in the next section.
3.2
External System Representation
Once the PCM model generation based on UML activity diagrams is completed, the behavior of external systems is added to these models. For this purpose, SOAP web services provided by existing legacy systems are modeled as black box components using the response time behavior of their operations for different request counts. To represent this response time behavior, our Palladio-Bench instances are extended with the performance curve integration (PCI) plugin [WHW12]. The PCI plugin allows to specify the behavior of PCM repository interface operations (i.e. web service 1.operation 1 in figure 3(a)) without modeling a RDSEFF. Instead, the response time of an operation can be specified as a function with multiple input parameters. In our scenario, we only use the amount of parallel users of a component as input for these functions to calculate the response time. In order to use performance curves within the current version of the Palladio-Bench, the PCI plugin which is currently available for version 3.2 is adapted to version 3.4.1. In addition to the migration of the PCI plugin we have enhanced its functionality. The original version of the PCI plugin is only able to work with so called data tables that map response times to input parameters, e.g. to the number of concurrent requests. In our new version, the response time behavior can also be specified using formulas. To derive these formulas linear and polynomial regression approaches are used to associate the number of concurrent requests with corresponding response times observed during the performance monitoring or test phases.
3.3
Palladio-Bench Use Cases
Using the automatically generated PCM models enhanced with usage probabilities and software performance curves allows us to support different performance management tasks. A set of examples can be found in figure 2. First of all, the expected response time for page transitions in JSF web applications can be analyzed by simulating the corresponding PCM models. Even though these models do not contain any resource demands of the UI layer, the response time behavior of web service operations used during page transitions allows to estimate response times for the user. Additionally, the call frequency for specific web service operations can be analyzed
36
using the PCM models. This helps to support service providers in their sizing process as each development project can communicate their estimated workload more precisely. The information on page transition times and call frequencies can also be used to derive SLAs for the maximum response times of specific web service operations. Apart from analyzing and specifying response time requirements, the performance simulations can support the selection of load test cases. The simulation results show how often a specific usage path is performed by the end users and how many web services are involved in this process. Both information pieces can help the test team to derive load test scripts. Additionally, data on usage probabilities, think times and the web service response time behavior can be used to predict the overall process lead times of specific business processes. This information may be used to redesign business processes if potential improvement areas are detected.
3.4
Limitations and Proposed Feature Enhancements
During our application of the Palladio-Bench and while implementing the enhancements explained in the previous section, we have faced some challenges for which we would like to suggest some future enhancement ideas. First of all, the usage model editor should offer the possibility to reference usage models from usage models. In practice, many usage behaviors are reused in different scenarios or have to be factored out for complexity reduction. Currently, these usage behaviors have to be modeled redundantly. Another useful enhancement would be a better visual representation of nested branches as they become very complex when large business processes are modeled. Furthermore, a capability to stop complete execution flows on certain conditions would simplify the modeling process. This would also reduce the model complexity as termination conditions don’t need to be modeled multiple times. The representation of memory within PCM models would also be very beneficial. JSF applications require a considerable amount of Java heap memory. As the heap demand grows with each additional user on the system, the heap size is an important factor to estimate the required capacity for the production environment. Especially, as the garbage collection overhead in each Java EE server instance grows with the amount of heap that needs to be managed. Additional feature enhancements should include an improved visualization of simulation results. Simulation results contain large sets of data, which are hard to examine. A preprocessing of simulation results to support users by using color schemes or visual indicators for noticeable problems such as potential bottlenecks would be very helpful. A better migration support for existing models between different Palladio-Bench versions is another desirable feature enhancement.
37
4
Conclusion and Future Work
As shown in this paper, the Palladio-Bench can greatly benefit the performance evaluation in different phases of the software development process. The features implemented in our part of this project help to make the Palladio tooling better applicable in practice as creating PCM models by hand is not feasible in most industry projects. As this project is ongoing, most of the proposed approaches are still under development and need to be evaluated. A key challenge for future enhancements of the PCM-related features will be to simplify the use of the performance modeling and simulation capabilities. This is especially important to allow non-performance modeling experts to use the performance management tool chain proposed in this work. To include the resource demands in the performance evaluation of the new enterprise applications, the performance model generation capabilities introduced in [BHK11, BVK13] might be applied in the context of this project.
References [BHK11]
Fabian Brosig, Nikolaus Huber, and Samuel Kounev. Automated Extraction of Architecture-Level Performance Models of Distributed Component-Based Systems. In 26th IEEE/ACM International Conference On Automated Software Engineering (ASE), pages 183–192, Lawrence, Kansas, USA, 2011.
[BKR09]
Steffen Becker, Heiko Koziolek, and Ralf Reussner. The Palladio Component Model for Model-Driven Performance Prediction. Journal of Systems and Software, 82(1):3 – 22, 2009.
[BTVK12] Andreas Brunnert, Daniel Tertilt, Christian V¨ogele, and Helmut Krcmar. Applying the Palladio Tool in a SOA Project. Palladio Days, Paderborn, Germany, 2012. [BVK13]
Andreas Brunnert, Christian V¨ogele, and Helmut Krcmar. Automatic Performance Model Generation for Java Enterprise Edition (EE) Applications. In Maria Simonetta Balsamo, William J. Knottenbelt, and Andrea Marin, editors, Computer Performance Engineering, volume 8168 of Lecture Notes in Computer Science, pages 74–88. Springer Berlin Heidelberg, 2013.
[LGZ07]
Yan Liu, Ian Gorton, and Liming Zhu. Performance Prediction of Service-Oriented Applications Based on an Enterprise Service Bus. In International Computer Software and Applications Conference (COMPSAC), pages 327–334, Beijing, China, 2007.
[Men02]
Daniel Menasce. Load Testing of Web Sites. Internet Computing, IEEE, 6(4):70–74, 2002.
[OBG08]
Liam O’Brien, Paul Brebner, and Jon Gray. Business Transformation to SOA: Aspects of the Migration and Performance and QoS Issues. In International Workshop on Systems Development in SOA Environments, pages 35–40, Leipzig, Germany, 2008.
[WHW12] Alexander Wert, Jens Happe, and Dennis Westermann. Integrating Software Performance Curves with the Palladio Component Model. In 3rd Joint WOSP/SIPEW International Conference on Performance Engineering (ICPE), pages 283–286, Boston, Massachusetts, USA, 2012.
38