For each visualization primitive, Soot includes a type of abstract tag, which is used to store the information to be displayed. ..... add a Color Tag if( parity.equals( ..... environment http://oopsla.acm.org/fp/files/dem-1.html, 2002. [4] D. Binkley, B.
McGill University School of Computer Science Sable Research Group
Integrating the Soot compiler infrastructure into an IDE Sable Technical Report No. 2003-4 Jennifer Lhot´ak, Ondˇrej Lhot´ak and Laurie Hendren [jlhotak,olhotak,hendren]@sable.mcgill.ca
October 16, 2003
www. sable. mcgill. ca
Integrating the Soot compiler infrastructure into an IDE Jennifer Lhot´ak, Ondˇrej Lhot´ak and Laurie Hendren [jlhotak,olhotak,hendren]@sable.mcgill.ca 17 October 2003 Abstract This paper presents the integration of Soot, a byte-code analysis and transformation framework, with an integrated development environment (IDE), Eclipse. Such an integrated toolkit is useful for both the compiler developer, to aid in understanding and debugging new analyses, and also for the end-user of the IDE, to aid in program understanding by exposing semantic information gathered by the advanced compiler analyses. The paper discusses these advantages and provides concrete examples of its usefulness. There are several major challenges to overcome in developing the integrated toolkit, and the paper discusses three major challenges and the solutions to those challenges. An overview of Soot and the integrated toolkit is given, followed by a more detailed discussion of the fundamental components. The paper concludes with several illustrative examples of using the integrated toolkit along with a discussion of future plans and research.
1
Introduction
In this paper we present the integration of Soot [23], a byte-code analysis and transformation framework, into an integrated development environment (IDE), Eclipse. Traditionally, optimizing compilers and optimizing compiler toolkits concentrate on providing the compiler developer with relevant intermediate representations (IRs) and support for a variety of program analyses and transformations. Although this support is key for the development of new compiler analyses, it does not provide the compiler writer with tools for easily visualizing the results of their analysis (which is very useful for debugging), nor does it provide a simple way of conveying the analysis information to an end-user. On the other hand, IDEs often produce various visual representations of the code to help the developer understand it. However, IDEs do not usually support the low-level intermediate representations and advanced compiler analyses found in optimizing compilers. Thus most visual representations in IDEs are based only on structural analysis of a high-level representation of the code, so they cannot communicate to the developer the wealth of semantic information that is deduced by an optimizing compiler. By integrating a compiler toolkit with an IDE, we can provide a much richer environment for both the compiler developer and for the end-user. For the compiler writer, we can provide mechanisms for easily displaying and browsing the results of compiler analyses. This is very useful for both students who are developing their first simple analyses and for more advanced researchers and developers who are developing more complex analyses. For the end-user, we can provide interesting ways of conveying program analysis information back to them. For ordinary users we can provide information to help them understand the behaviour or potential problems in their program, based on analyses that are more complex than currently supported in IDEs. For example, we could display information about potential array bounds problems. For advanced users we can provide more detailed information about the results of program analyses. For example, we can expose side-effect or alias information.
1.1
Challenges
There are three major challenges to overcome in order to make a useful integration of a compiler toolkit and an IDE. First, the compiler developer would like to concentrate mostly on developing and implementing an analysis or 1
transformation on a convenient IR and should not be burdened with the complexities of how this information will be displayed in the IDE. Second, the compiler analysis/transformation will likely be performed on a lower-level IR than the Java source and for debugging purposes the analysis results should be displayed on this IR. However, the end-user is not likely to understand the low-level IR and will likely want to view information at the Java source level. Thus, there must be a simple and transparent mechanism for keeping the correspondence between the lower-level IR and the Java source files, and for displaying the analysis information at both levels. Third, the compiler framework and the IDE are separate pieces of software and the interface to make them interact cleanly must be carefully designed. In particular, we need simple mechanisms for conveying information from the IDE to the compiler framework, and analysis information from the compiler framework back to the IDE.
1.2
Contributions
In this paper we present our integration of the Soot compiler framework into the Eclipse IDE and we show how we have addressed the three major challenges given above. Although we discuss our approach with respect to a specific IDE, namely Eclipse, the general strategy should apply to other IDEs as well. We tackle the challenge of isolating the compiler developer from complex IDE display concerns by providing three new kinds of abstract tags which can be attached to classes, fields, methods, statements or values in the low-level IR. The compiler developer only has to worry about tagging the IR with the results of a compiler analysis (a simple process) and the mechanism for conveying the information to the IDE and displaying the information in the IDE is handled automatically by the integrated toolkit. For the challenge of supporting the display of analysis information for both the low-level IR and the source code, we provide automated support for transparently keeping the correspondence between the low-level IR statements and the correct position within the source code. This is done by providing a new front-end based on Polyglot which parses Java source and produces the lower-level Jimple IR with tags already added to give the line number and column offset in the Java Source. Finally, we address the challenge of combining the Soot framework and the Eclipse IDE by providing integration code comprised of three main modules (launcher, IR editor and attribute handler), and by defining an XML specification for both the command-line options to Soot and for the attribute information which conveys line numbers, column offsets and analysis information.
1.3
Paper Roadmap
The remainder of the paper is structured as follows. In Section 2, we provide an overview of the structure of Soot and the structure of the integration code. In Section 3, we discuss our three new kinds of tags. Section 4 discusses the mechanisms we have developed for communicating between the IDE and the compiler framework. In Section 5, we provide four illustrative examples of using the integrated toolkit. Section 6 gives an overview of related work and Section 7 provides conclusions and future work.
2 2.1
Structure of Soot and the IDE plugin Soot
Soot [23] was originally developed as a framework to allow researchers to experiment with analyses and optimizations of Java bytecode, and to provide a common infrastructure to compare results. It was later extended with an annotation framework, which allows analysis results to be encoded as class file annotations for use by other tools [17]. Many standard and advanced analyses and optimizations have been implemented both at McGill and at many other institutions. Examples from McGill include array bounds analysis [18], variable type analysis [21] and pointer and side-effect analysis [13].
2
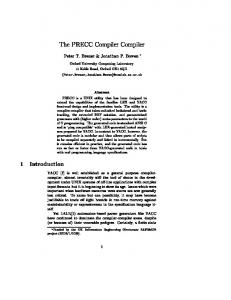
In order to make Soot useful in the IDE integration, and to support visualization of program analysis results, several modifications and extensions were required. Figure 1 shows a high-level view of Soot, including the new parts that have been developed to support the IDE integration and visualizations (new parts are shaded in dark grey or red). As indicated at the top of Figure 1, Soot takes as input the program to analyze in one of three forms (Java class files, Jimple files or Java source files) and the command-line arguments which specify which input files to process, what phases and options to enable in Soot, and what kind of output to create. .class
.jimple
.java
command−line args
Soot
Jimpilfy
Polyglot Front−end
Jimple Parser
Jimple Analysis and Transformations
Jimple, with Flow Analysis Information Add tags
Jimple with Tags Generate Bytecode
.class
Decompile to Java
.java
Generate Jimple Files and Attributes in xml
.jimple
.xml
Figure 1: Overview of Soot Inside Soot, the input program is converted into the Jimple IR, which is a three-address typed intermediate representation that is convenient for program analysis. After Jimple has been created, various analyses and transformations can be applied to the program, resulting in Jimple code that is associated with analysis information. Soot supports a variety of intraprocedural analyses, as well as interprocedural analyses such as points-to and side-effect analysis. Compiler developers can add new analyses and/or transformations to this phase quite easily. The next phase in Soot attaches tags to the Jimple IR. The original purpose of tags was as a mechanism for conveying flow information, such as array bounds checking information, to a VM. However, for the purposes of the IDE integration, we have developed three new kinds of tags which are used to convey program analysis information to the IDE. We have also added a collection of built-in tagging modules based on analyses already available in Soot. In addition, it is a very simple process for the compiler writer to create appropriate tags to encode the results of new analyses he/she has added to Soot. These new visualization tags are discussed in detail in Section 3. As indicated at the bottom of Figure 1, Soot can produce three kinds of outputs: class files, Java source files or Jimple files. In addition to these output files, Soot communicates the analysis results from the tags to the Eclipse plugin using XML files. The details of this communication are described in Section 4.
2.2
Soot Plugin for Eclipse
The Soot framework was originally designed as an ordinary Java application that was run from the command-line. In order to keep this functionality, as well as provide integration with an IDE, we created a Soot Plugin for Eclipse. As illustrated in Figure 2, the plugin is composed of two main pieces: Soot (which can serve as a stand-alone application when used by itself), as outlined in Figure 1, and the Soot Interface which provides the glue between the Eclipse platform and Soot. The Soot Interface itself is composed of three main parts: the Soot Launcher, the IR Editor and the Attribute Handler. The Soot Launcher module handles calling Soot with the appropriate command-line arguments, interfaces with the 3
Eclipse
Soot Plugin Soot Jimpilfy
Jimple Parser
Polyglot Front−end
Analysis and Transformations
Add tags
Generate Bytecode
Decompile to Java
Generate Jimple Files and Attributes in xml
Soot Interface Soot Launcher
IR Editor
Attribute Handler
Figure 2: Soot as an Eclipse Plugin Eclipse resource manager to determine the location of the input files and libraries, determines the correct location for the output files, and handles all messages sent to standard output by Soot. The command line version of Soot provides many options to specify its behaviour. Users of the Eclipse plugin can set these same options in two different ways. First, we have made several common settings (such as generating Jimple output and decompiling) available as menu items. For more advanced users, the plugin includes a dialog containing all the Soot options. The settings in this dialog can be saved as named configurations, to make it easy to run Soot many times with the same options. The configurations are persistent, so they are available in subsequent Eclipse sessions. Soot has a large number of options, and they often change as analyses and transformations are added to Soot. An important engineering challenge was how to maintain consistency between Soot and the plugin. Our solution was to create an XML file specifying and documenting all the options. This file is used to automatically generate the option handling code for both Soot and the Eclipse plugin, as well as documentation, both printed and on-line (including tooltips in the options dialog). Using a single source for the option information ensures that Soot, the plugin, and the documentation remain consistent. The IR Editor handles displaying the several different IR’s in Soot, providing syntax highlighting and a content outliner. The outliner is useful as the IR’s are often much longer than the original source, presenting the need to easily navigate to particular methods. The IR editor also displays the results of analyses in visual ways. The Attribute Handler is responsible for reading analysis results from Soot, organizing them, and displaying them in a visual way. When triggered, it reads an XML file which Soot has produced containing all the analysis results. The information must then be organized according to which parts of the code it applies to, so that it can be displayed in the appropriate places. The Attribute Handler then displays the analysis information in the code using popup tooltips, colour highlighting, popup link menus, and icons. Figure 3 provides a screenshot showing a typical use of the integrated toolkit. In the foreground (upper left), one can see the Soot dialog box which is used for setting the options for running Soot. In this case, the user is setting the Output Options. As the user moves the cursor over the various output options, a tooltip is displayed which documents the option. In this case, the mouse is over the option for Jimple File, and so the appropriate descriptive tooltip is given. In the background, one can see the typical Eclipse display. On the left side is the Package Explorer listing the files in the current project, including some .jimple files generated by Soot. On the right side is the Intermediate Representations Editor with syntax highlighting editing a Jimple file, which was produced by running Soot with a parity analysis enabled. As described further in Section 5.1, the compiler developer simply tags the variables in the IR with colour tags based on the results from the analysis, and the integrated toolkit highlights the variables in the
4
Figure 3: Soot-Eclipse Screenshot code with different colours representing results of the analysis. The icons in the left margin labelled SA indicate lines of code for which analysis information is available. Finally, the Soot Output view appears in the bottom right corner, showing the output of the last execution of Soot.
3
Visualization Primitives
One of the key requirements in the design of Soot’s visualization framework was that it be general enough to display the results of many kinds of analyses, including ones that we have not yet thought of. This is important for several reasons. First, Soot is not only a compiler, but rather a compiler framework. While it includes many standard analyses, it is mainly valuable as a tool to help compiler researchers easily implement their own analyses. Therefore, the visualization framework that we design today must be adaptable to analyses that will be designed tomorrow by other researchers. Second, one of the most important uses of Soot is in teaching program analysis, both at McGill and at other institutions, and the visualization framework is one way in which we are improving Soot for teaching. In the compiler course at McGill, one assignment requires students to implement a dataflow analysis of their choice within Soot. The students should be able to display the results of their analysis as they are developing it using the visualization framework. Therefore, the framework must be able to support the arbitrary analyses that the students may choose to implement. To make the visualization framework general with respect to different analyses, we identified three visualization primitives to convey the different kinds of information likely to be generated by analyses. The primitives are intended to be general enough so that any analysis information can be presented with them. In Section 5, we describe several 5
example analyses whose results are displayed with these primitives. Should we encounter an analysis for which these three primitives are insufficient, we would consider adding a new primitive, but we would again look for a general primitive that could be used to display the results of many different analyses. For each visualization primitive, Soot includes a type of abstract tag, which is used to store the information to be displayed. These tags can be attached to arbitrary classes, methods, fields, statements, and values in any of the Soot intermediate representations. The analysis developer needs only to choose the visualization primitive, create a tag containing the information to be displayed, and attach it to the appropriate object in the intermediate representation.1 Soot’s annotation framework propagates the tags between the intermediate representations. The visualization framework collects the tags, and displays them in the appropriate way depending on which visualization primitive they represent.
3.1
String Tags
The simplest way to present analysis information to the user is using an arbitrary string of text. The String Tag visualization primitive allows arbitrary text to be associated with an object in the intermediate representation. In previous versions of Soot, the only way to output analysis results was to print them as comments in the intermediate representation, often leading to a very cluttered output. Within Eclipse, however, this text is not displayed as part of the intermediate representation itself, but as popup tooltips that appear when the mouse is over the corresponding piece of code. The user can trace through the analysis results by moving through the code with the mouse. An icon in the margin indicates to the user which lines of code contain analysis information. Almost any analysis information can be encoded using a String Tag, since almost any information can be described using text. Even when displaying information that is more conveniently displayed using one of the other tags, we encourage analysis developers to include String Tags explaining the analysis results to supplement these other tags. A String Tag is very easy for an analysis developer to create. Its constructor requires only the string to be displayed. It is attached to a class, method, field, statement or value with a single call to its addTag() method. For example to tag a method m as not reachable, one could use m.addTag(new StringTag("Method not reachable")); or assuming some flow analysis information has been computed and stored in a map called analysisInfo, one could attach a textual representation of the flow analysis information to a statement s, using s.addTag(new StringTag (analysisInfo.getFlowBefore(s).toString()));.
3.2
Colour Tags
Many analyses assign one of a small collection of possible values to each small section of the intermediate representation. For example, a live variable analysis assigns either live or dead to each local variable at each program point. This type of information can be conveniently displayed by highlighting the relevant section of the intermediate representation with a colour representing the value. For example, each appearance of a variable in the code could be coloured red if it is dead after the statement in which it appears, and green if it is live. To highlight a class, method, field, statement or value, the analysis developer needs only to select a colour (either from a collection of pre-defined colours, or by specifying an arbitrary triple of red, green, and blue values), create a Colour Tag of that colour, and attach it with a call to addTag(). For example, to colour an unreachable method m red, one could use m.addTag(new ColorTag(ColorTag.RED));.
3.3
Link Tags
Some analyses produce results which take the form of references to other portions of the code. For example, a reaching definitions analysis produces, for each use of a variable, the set of definitions reaching the use, where each definition is some statement in the code defining the variable. This type of information is most naturally conveyed using hyperlinks to the code being referenced. To allow the results of an analysis to be presented as hyperlinks, the visualization framework includes a Link Tag primitive. Each Link Tag requires a textual description and a target statement, method, or field (which may be in the same or a different class); it can be attached to a statement, method, or field. For example, 1A
complete example of the code for attaching tags is given in Section 5.1.
6
to create a link between a use of a variable and its defining statement, one could use useStmt.addTag(new LinkTag("Definition of "+variable, defStmt, className ));. The same value, statement, field or method can be tagged with mutiple Link Tags. For example, a statement may have multiple reaching definitions. The textual descriptions of all Link Tags appearing at a given line are shown in a popup tooltip when the mouse moves over the line. In order to select one of the links, the user clicks on the SA icon in the margin to produce a popup menu of all the Link Tags with their textual descriptions. By clicking on a specific item in this menu, the user can follow one of the links; the cursor is moved to the target of the link. Eclipse also provides forward and back navigation buttons like a web browser. As shown later in our example in Section 5.2, this functionality is very useful for navigating call graphs.
4
Communicating Analysis Information from Compiler to IDE
A compiler or compiler framework like Soot performs analyses and stores analysis results on a low-level IR such as Jimple. However, the IDE does not have direct access to this internal intermediate representation; it deals with a textual representation of the program source, and perhaps a textual representation of the intermediate representation. In this section, we describe how the analysis information is mapped from the internal representation of the compiler to the textual representations managed by the IDE. In earlier work [17], Soot was extended with a framework for encoding analysis results in its intermediate representation by attaching tags to objects of the representation. This framework propagates the tags between the various intermediate representations inside Soot, and originally, it was used to encode the analysis information in the class files produced as output. For the Eclipse visualization framework, we were able to leverage this annotation framework. The key component that had to be added was a method to encode the tags containing analysis information in such a way that Eclipse could read them, and match them to the appropriate positions in the textual version of the intermediate representation. To achieve this, we modified Soot’s intermediate representation output code to output, along with the text of the intermediate representation itself, an XML file containing information from all the tags attached to the intermediate representation. The output code encodes the line and column positions in the text of each object of the intermediate representation as well as encoding the appropriate position for each tag. The Soot interface to Eclipse then needs only to parse the XML file to determine which tags should be displayed at which line and column position of the intermediate representation. Mapping analysis information back to the original source code is a more difficult problem, compounded by the fact that traditionally, the input to Soot has been pre-compiled Java bytecode, rather than the original source code. One way to do this is to make use of information stored in Java bytecode attributes. The Java Virtual Machine Specification [14] defines the LineNumberTable attribute, which maps each bytecode instruction to the line of source code from which it was produced. Soot parses this attribute and encodes the mapping as a source line number tag attached to each IR instruction. Since these tags are propagated through the various intermediate representations, they are still present when Soot outputs analysis information into the XML file. At this point, the statements of the intermediate representation have two types of tags attached to them: tags containing the analysis information, and tags containing source line number information. When Soot records the analysis information in the XML file, it can add the source line number information with each tag. This makes it possible for the Eclipse plugin to display the tag not only in the correct position in the intermediate representation, but also with the correct line of the source code. String Tags and Link Tags tend to be coarse-grained enough that it is usually sufficient to display them with the correct line of the source code. However, Colour Tags are often used to highlight a small part of a line, such as a single variable. Unfortunately, the Java class files do not preserve such detailed information about the positions of variable names in the source code. In order to have sufficient information to display Colour Tags correctly in source, Soot must accept the original source code as its input, rather than bytecode. We therefore constructed a Java source front-end for Soot, which converts Java source code directly to the Jimple intermediate representation. The front-end is based on Polyglot [16], a semantic analyzer for Java source, to which we added a Jimple code generator back-end. For consistency with the rest of Soot, this Java-to-Jimple compiler encodes the source line and column information for each object of Jimple using Soot tags. This means that Soot’s annotation framework automatically propagates the information between intermediate representations, and it is available when the output code is generating the XML file
7
containing analysis information. The source line and column information is encoded in the XML file along with the intermediate representation line and column information, so the Eclipse plugin can display the analysis information in the correct place in both the intermediate representation and the source code.
5
Example Applications of the Integrated Framework
In this section, we present several examples of applications of the integrated framework. The applications illustrate typical uses for teaching (Section 5.1), program understanding (Sections 5.2 and 5.3) and more advanced research analysis (Section 5.4).
5.1
Parity Analysis
In the optimizing compiler course at McGill, students are asked to implement a dataflow analysis of their choice in Soot. We also encourage the students to use the Eclipse plugin to visualize the results of their analysis. Parity analysis is one example of an analysis that students have chosen to implement. For each integer expression appearing in a method, the analysis computes whether its value is always even, always odd, or could be either (top). Typically the amount of code needed to visualize an analysis is very small and it is easy to write. The code needed to visualize the results of parity analysis is given in Figure 4. The code iterates through the statements in the method, and for each statement, it iterates through the values defined and used. Each use is tagged with the analysis result before the statement, and each definition is tagged with the analysis result after the statement. 2 The addTags() method actually encodes the results in tags. First, a String Tag is added for each value indicating its parity in textual form. These string tags will be automatically displayed in Eclipse as tooltips. Then, depending on the parity, a colour is chosen and a colour tag is added. These colour tags will cause the variables to be coloured appropriately. Figure 3 showed the Jimple code with the colour tags indicating parity information. In general, we find that students find it easy to add the tagging information and the resulting Eclipse displays aids in their understanding and debugging of the analysis, as well as making the exercise more fun and rewarding.
5.2
Call Graph and Parameter Alias Analysis
Soot includes a whole-program analysis framework for constructing call graphs and performing points-to analysis [13, 21]. The information computed by this framework can be particularly useful to help developers understand their code and find bugs in it. In this section we demonstrate how the call graph and parameter alias visualizations were used to find a bug in one of our benchmark programs, telecom. The telecom program simulates phone calls taking place in a public telephone network, and it is an extended, multi-threaded version of a benchmark distributed with AspectJ [1] that was submitted as an example benchmark for an optimizing compilers course. The call graph visualization presents the call graph computed by Soot using Link Tags. This allows the developer to see the possible targets of call sites, including virtual call sites, and easily navigate the call graph by following the links. Reverse links are also included from each method to all the call sites from which it may be called. Although most IDEs provide search features to help developers find specific methods, these are often based only on a textual search, ignoring the semantics of the class hierarchy, or, at best, are based on an imprecise call graph constructed using Class Hierarchy Analysis [9]. On the other hand, the call graph constructed by Soot can be made much more precise, using techniques such as Rapid Type Analysis [2], Variable Type Analysis [21], or even more precise points-to analyses. Soot’s points-to framework [13] can be used to compute may-alias information for pointers. The parameter alias visualization presents a subset of this information. Specifically, for each method with pointers as parameters, it indicates, using Colour Tags, which pointer parameters may point to the same memory location when the method is invoked. Parameters which may point to the same location are coloured with the same colour, while parameters known to point to distinct locations are coloured with different colours. 2 For example, in a statement of the form x = x + y, the parity of the uses of x and y are stored in flow information before the statement, whereas the parity of the definition of x is stored in the flow information after the statement.
8
protected void internalTransform( Body b, String phaseName, Map options) { ParityAnalysis pa = new ParityAnalysis(new BriefUnitGraph( b )); // compute analysis for( Iterator it = b.getUnits(); it.hasNext(); ) { // iterate over all stmts Stmt stmt = (Stmt) it.next(); // Tag all definitions with flow information after statement. addTags( stmt.getDefBoxes(), (Map) pa.getFlowAfter( stmt ) ); // Tag all uses with flow information before statement. addTags( stmt.getUseBoxes(), (Map) pa.getFlowBefore( stmt ) ); } } private void addTags( Collection boxes, Map parityMap ) { for( Iterator it = boxes.iterator(); it.hasNext(); ) { // iterate over all values ValueBox box = (ValueBox) it.next(); Value value = box.getValue(); // get the flow information String parity = (String) parityMap.get( value ); if( parity == null ) return; // No parity information for this value. // add a String Tag box.addTag( new StringTag( value.toString()+“ is ”+parity+“.” ) ); // add a Color Tag if( parity.equals( ParityAnalysis.EVEN ) ) box.addTag( new ColorTag( ColorTag.YELLOW ) ); else if( parity.equals( ParityAnalysis.ODD ) ) box.addTag( new ColorTag( ColorTag.BLUE ) ); else if( parity.equals( ParityAnalysis.TOP ) ) box.addTag( new ColorTag( ColorTag.RED ) ); else if( parity.equals( ParityAnalysis.BOTTOM ) ) box.addTag( new ColorTag( ColorTag.GREEN ) ); else throw new RuntimeException( “Unknown parity value ”+parity+“.” ); } }
Figure 4: Code to visualize parity analysis results Figure 5(a) shows the Call Graph and Parameter Alias visualizations applied to the Call() constructor from the telecom example. Notice that the two parameters, caller and receiver are both the same colour, indicating that they may be aliased.3 This appears to be a possible error; in a telephone system, it should not be possible for a caller to call himself. In order to determine if there really is an aliasing problem (and it is not due to imprecision of the analysis), we checked all the places where this method is called. Also, notice the comment which states “This should really only be called by Customer.call(..)”. We found all callers and verified that this comment is obeyed using the call graph visualization, by clicking on the SA icon next to the method signature. This pops up the two call graph links. The first link indicates that the only place where this constructor is invoked is in Customer.call(), confirming the comment. The second link indicates that this constructor implicitly invokes the constructor of java.lang.Object. By clicking the first link, we were taken to the call site in Customer.call(), a very short method containing little of interest. We followed another call graph link to the only call site calling Customer.call(), in CallThread.run(). By looking through the code of this method (see Figure 5(b)), we see that the caller and receiver are simply chosen at random from the list of customers, with no code to ensure that they are distinct. We have indeed found a bug, which we can observe at runtime in the output snippet in Figure 5(c), in which Customer8 calls himself. In general, we believe that by visualizing the call graph and aliasing computed by the points-to analysis in Soot, we can provide more accurate information to the end user in a way that enables them to browse and understand their program.
5.3
Unreachable Method Analysis
Another application of the call graph computed by Soot is flagging methods which are unreachable through the call graph from the starting point of the program. These methods could be removed to reduce the size of the program, either for performance reasons, or to make the program easier to understand. We highlight these methods in red 3 Note that this aliasing information was computed using a fairly precise interprocedural points-to analysis, which means that objects from the same allocation site may reach both of these parameters.
9
(a) aliased parameters and call graph links boolean foundFreeCaller = false; do { int index = Math.abs(r.nextInt())%(AbstractSimulation.customers.size()); caller = (Customer) AbstractSimulation.customers.get(index); if (!caller.lineIsBusy()) foundFreeCaller = true; }while(!foundFreeCaller); boolean foundFreeReceiver = false; do { int index = Math.abs(r.nextInt())%(AbstractSimulation.customers.size()); receiver = (Customer) AbstractSimulation.customers.get(index); if (!receiver.lineIsBusy()) foundFreeReceiver = true; }while(!foundFreeReceiver); ... Call c1 = caller.call(receiver);
(b) code extract for creating a telephone call between a caller and receiver
CURRENT TIME 10:55 Thread 2 Start Customer8 calls Customer8 [new local connection from Customer8(514) to Customer8(514)] Call length 17 Customer8 accepts call connection completed
(c) program output extract illustrating bug Figure 5: Example of aliased parameters and call graph links
10
using a Colour Tag, and also add a String Tag to indicate that the method is unreachable. By taking advantage of the Spark [13] points-to analysis framework, Soot can produce call graphs with different levels of precision, and this translates into different levels of precision in detecting unreachable methods. To demonstrate the effect of the precision gained from Spark, we describe two (out of many) examples of unreachable methods that were detected in benchmarks using a precise call graph built with Spark, but that cannot be determined to be unreachable using a simpler call graph construction algorithm such as Class Hierarchy Analysis (CHA) [9]. The Jess benchmark from the SpecJVM98 [20] suite contains a class called LostDisplay. The code using this class is commented out, with a comment indicating that it was commented out when the original Jess code was made into a SPEC benchmark. However, a field of type LostDisplay remains, so the class is not entirely unused. A different implementation of the same interface also exists (called NullDisplay) and its methods are called by the benchmark. Therefore, the methods of LostDisplay cannot be determined to be unreachable with a call graph based on CHA, but by using a more precise analysis such Rapid Type Analysis [2], Soot is able to determine all but one method of LostDisplay to be unreachable. The SableCC [19] parser generator is another interesting example. Like many programs, it includes its own utility library with implementations of standard data structures such as lists and trees. As with most libraries, the application does not use all of the library code. However, because the data structures are organized in a class hierarchy as various implementations of general interfaces, and because the application is coded to the interfaces rather than the implementations, a CHA-based call graph is insufficient to determine which methods of which implementations are unused. By constructing the call graph with the help of a Spark points-to analysis, Soot can flag many more of these library methods as unreachable. Thus, we can see that by exposing the more accurate analysis in Soot to the end user, we can improve the tools that aid in program understanding or refactoring.
5.4
Array Analysis
In this final example, we present an application of our framework to a more advanced analysis, more typical of a use in research. As part of our earlier research on array bounds check removal, we implemented in Soot a comprehensive array bounds analysis [18], consisting of three related analyses: variable constraint analysis, array field analysis, and rectangular array analysis. In that paper, we provided quantitative results about the effectiveness of these analyses on various benchmarks, in terms of the number of bounds checks eliminated and the speedup obtained. However, we are also interested in qualitative results of the analysis, for a number of reasons, from the point of view of both the programmer writing the benchmark, as well as the designer of the analysis. For the programmer, it is very reassuring when an analysis determines that none of the array accesses in the program will throw an ArrayIndexOutOfBoundsException. It is even more important, however, for the analysis to provide sufficient feedback when it cannot prove that an array access is safe, so that the programmer can study the reasons why the analysis was unsuccessful, and determine whether it is due to imprecision in the analysis, or an actual bug in the program. In addition, the programmer may be interested in the effect of specific optimizations on the performance of the program. If the programmer is relying on the compiler to perform some optimization, it is useful for the compiler to report whether it has enough information to perform the optimization, and if it does not, what would need to be changed for the optimization to be applicable. While the array bounds check elimination was very effective on some benchmarks, it was less effective on others. As compiler researchers, we want to know why it failed on these other benchmarks, and what could be done to fix it. Like many compiler optimizations, the array bounds check elimination is dependent on the three interdependent analyses, which in turn depend on other information that the compiler has computed, such as the call graph. Therefore, even for the developer of the analyses, it is difficult to determine only by examining the benchmark code the results that the various analyses will produce, and whether the optimization will be applied. However, by visualizing the results of each analysis on the benchmark code, the analysis developer can quickly see which analyses are failing to deduce the results needed by dependent analyses and optimizations. To visualize the results of the array bounds check elimination, we used four colours of Colour Tags to highlight the array index expression, to indicating one of the four possible combinations of the upper and lower bound being safe or unsafe. In addition, for multi-dimensional array expressions, we used one of two colours to indicate whether the
11
array had been determined to be rectangular. Finally, when studying why certain arrays known to be rectangular were not found to be rectangular by the analysis, we found it convenient to also generate the call graph link tags, since the rectangular array analysis is interprocedural and dependent on the call graph. These visualizations were very helpful in determining why the analysis failed on certain benchmarks, and has helped us identify ways to improve the analysis. Overall, we believe that appropriate visualizations will aid compiler researchers to quickly view the results of their analyses, to identify places where they expect the analysis to be more precise, and to help browse the program to identify where the analysis became imprecise.
6
Related Work
Several projects have attempted to visually display the data structures inside compilers for teaching and for debugging compiler optimizations. Xvpodb [7] displays the intermediate representation at various stages in a static optimizer. The Feedback Compiler [4] shows animations of the transformations performed on an intermediate representation in the lcc [11] compiler. The Visual Simple-SUIF Compiler [12] displays the intermediate representation, as well as control flow graphs, data dependence graphs, and register interference graphs. Vegdahl [24] presents a visualizer intended primarily for teaching, which shows the data structures in the front-end, rather than back-end, of a compiler. A number of tools in early stages of development present interprocedural information such as the call graph to Java programmers. These include JAnalyzer [6], a tool based on Soot for browsing call graphs, and the Gnosis framework [3], another call graph construction toolkit. Chang, Jo, and Her [8] have developed a tool for visualizing the interprocedural control flow due to exceptions in Java programs. More broadly, a large research community exists with entire conferences devoted to software visualization and program comprehension [10,15]. Most of this work focuses on high-level visualization of the overall structure of large pieces of software, in contrast with our work, which focuses on showing information gained from analyzing the code statement by statement. On the other extreme, a large body of work exists on using program slicing [5, 22] to help programmers understand the effects of individual statements. An interesting point of our work is that we are providing a toolkit which makes it easy to integrate the power of an optimizing compiler into an existing IDE. By implementing it as an Eclipse plugin, it can be widely used (anybody using Eclipse can easily add the plugin) and the resulting integrated tool is useful for both compiler developers and end users.
7
Conclusions and Future Work
We have integrated the Soot compiler infrastructure into the Eclipse IDE. We identified three major challenges to providing such an integrated toolkit and described how we tackled these challenges and described our approach for designing the Soot plugin to Eclipse. An important part of our solution is a generic visualization framework for conveying analysis results from the compiler to the user. This provides a rich environment for programmers seeking to better understand their code, students learning about compiler analyses, and compiler researchers studying new analyses. We have shown the significance of several visualizations already implemented in the framework, and we plan to implement other visualizations in the future. Another potential area of future work is construction of a step-through analysis debugger. The idea is to develop a debugger-like interface that allows the user to step through a data flow analysis as it is being performed, and visualize the information being propagated. This would be a welcome tool both for students learning about data flow analyses, and for experienced researchers debugging complicated analyses. Some of the output produced by Soot takes the form of graphs, such as control flow graphs and call graphs. Our current preferred method of drawing these graphs is by producing input to the dot graph drawing tool. It would be useful to integrate such a graph drawing tool into Eclipse, to make it possible to view these graphs in Eclipse. The graphs could even be animated (to step through a data flow analysis on a control flow graph, for example) or interactive.
12
References [1] AspectJ. http://eclipse.org/aspectj/. [2] D. F. Bacon and P. F. Sweeney. Fast static analysis of C++ virtual function calls. In OOPSLA ’96 Conference Proceedings: Object-Oriented Programming Systems, Languages, and Applications, pages 324–341. ACM Press, 1996. [3] I. Balaban, F. Tip, and J. Dolby. Using static analysis for program understanding in an integrated development environment http://oopsla.acm.org/fp/files/dem-1.html, 2002. [4] D. Binkley, B. Duncan, B. Jubb, and A. Wielgosz. The feedback compiler. In IEEE Sixth International Workshop on Program Comprehension, pages 198–205, June 1998. [5] D. Binkley and K. Gallagher. Program slicing. Advances in Computers, 43:1–50, 1996. [6] E. Bodden. A High-level View of Java Applications. In OOPSLA’03 ACM Conference on Object-Oriented Systems, Languages and Applications (Companion), SIGPLAN, Anaheim, CA, October 2003. [7] M. Boyd. Graphical visualization of compiler optimizations. Master’s thesis, Florida State University, July 1993. [8] B.-M. Chang, J.-W. Jo, and S. H. Her. Visualization of exception propagation for Java using static analysis. In Proceedings of the Second IEEE International Workshop on Source Code Analysis and Manipulation (SCAM’02), page 173. IEEE Computer Society, 2002. [9] J. Dean, D. Grove, and C. Chambers. Optimization of object-oriented programs using static class hierarchy analysis. In ECOOP’95—Object-Oriented Programming, 9th European Conference, volume 952 of LNCS, pages 77–101, 7–11 Aug. 1995. [10] S. Diehl and J. T. Stasko, editors. Proceedings of the 2003 ACM Symposium on Software Visualization. ACM Press, 2003. [11] C. W. Fraser and D. R. Hanson. A Retargetable C Compiler: Design and Implementation. Addison-Wesley Longman Publishing Co., Inc., 1995. [12] B. K. Harvey. Graphical user interface for compiler optimizations with Simple-SUIF. Master’s thesis, University of California, Riverside, December 1996. [13] O. Lhot´ak and L. Hendren. Scaling Java points-to analysis using Spark. In Compiler Construction, 12th International Conference, volume 2622 of LNCS, pages 153–169, April 2003. [14] T. Lindholm and F. Yellin. The Java Virtual Machine Specification. Addison-Wesley, 1996. [15] H. A. M¨uller, R. Koschke, and K. Wong, editors. 11th International Workshop on Program Comprehension (IWPC 2003). IEEE Computer Society, 2003. [16] N. Nystrom, M. R. Clarkson, and A. C. Myers. Polyglot: An extensible compiler framework for Java. In Compiler Construction, 12th International Conference, volume 2622 of LNCS, pages 138–152, April 2003. [17] P. Pominville, F. Qian, R. Vall´ee-Rai, L. Hendren, and C. Verbrugge. A framework for optimizing Java using attributes. In Compiler Construction, 10th International Conference (CC 2001), volume 2027 of LNCS, pages 334–554, 2001. [18] F. Qian, L. Hendren, and C. Verbrugge. A comprehensive approach to array bounds check elimination for Java. In Compiler Construction, 11th International Conference, volume 2304 of LNCS, pages 325–341, April 2002. [19] SableCC. http://www.sable.mcgill.ca/sablecc/. [20] SPEC JVM98 Benchmarks. http://www.spec.org/osg/jvm98/.
13
[21] V. Sundaresan, L. Hendren, C. Razafimahefa, R. Vall´ee-Rai, P. Lam, E. Gagnon, and C. Godin. Practical virtual method call resolution for Java. In Proceedings of OOPSLA 2000, pages 264–280, 2000. [22] F. Tip. A survey of program slicing techniques. Journal of programming languages, 3:121–189, 1995. [23] R. Vall´ee-Rai, E. Gagnon, L. J. Hendren, P. Lam, P. Pominville, and V. Sundaresan. Optimizing Java bytecode using the Soot framework: is it feasible? In Compiler Construction, 9th International Conference (CC 2000), volume 1781 of LNCS, pages 18–34, 2000. [24] S. R. Vegdahl. Using visualization tools to teach compiler design. The Journal of Computing in Small Colleges, 16(2):72–83, 2001.
14