AIAA Conference on Guidance, Control and Dynamics Honolulu, HI, Aug. 18-21, 2008 AIAA Paper 2008-6325
Integration of an Aggregate Flow Model with a Traffic Flow Simulator Robert Hoffman∗, Dengfeng Sun†, Alexis Clinet‡, Stephen Augustine§, Jason Burke¶, Rohit Viswanathank, Alexandre M. Bayen∗∗ This paper describes a research and integration effort to develop computational tools to assess the performance of the National Airspace System (NAS). The problem of interest is focused on the en route airspace and how restrictions to aircraft movement are applied by air traffic controllers and traffic managers in response to demand overages or capacity shortfalls in sectors of airspace. To estimate and assess the efficiency of air traffic control responses, we apply the Large-capacity Cell Transmission Model (CTM(L)), which models the airspace system and its capacity constraints as a linear time invariant dynamical system, in which the state is a vector of aggregate aircraft counts. A mixed integer program is solved to minimize the control and delay of aircraft. We describe the integration of CTM(L) with NASA’s Future ATM Concepts Evaluation Tool (FACET). Using delay predictions, system metrics, and a visualization of the aggregated network, we apply the integrated environment to analyze and propose Traffic Flow Management (TFM) solutions for weather disturbances.
I. A.
Introduction
The Need for System Modeling.
TFM initiatives are a major source of delay and disruption in the NAS. Service providers, users, policy makers and the traveling public have a vested interest in minimizing these operational disturbances to the level at which they are able to assure safe operations. Moreover, concern about present and future congestion and delay in the NAS now necessitates an understanding of the fundamental structure of air traffic flow. In particular, the characterization of the underlying flow (or stream) network is a challenge in modeling the en route airspace and its reaction to disturbances. In response to forecasts that air traffic will at least double or perhaps triple by the year 2025, the consensus in the United States (and in Europe) is that the current aviation infrastructure must be transformed in order to avoid daily gridlock or massive delays. Through Vision 100 legislation from 2003, Congress charged the Federal Aviation Administration (FAA) and Department of Transportation (DOT) with addressing the most significant limitations to growth in the current air transportation system. The FAA’s existing Joint Planning and Development Office (JPDO) has been expanded into a multi-agency organization, which now includes the Departments of Transportation, Defense, Homeland Security, Commerce, NASA and the White House Office of Science and Technology Policy. JPDO is developing the Next-Generation Air Transportation System (NGATS), with a target year of 2025 for implementation. NASA research in Air Traffic Management is currently aligned with these interests and concerns. The research described in this paper is part of a larger research effort under NASA’s NGATS-ATM Airspace Project to understand and predict the complex behavior of the NAS at the system level. ∗ Metron
Aviation.
[email protected]. Corresponding author. of Civil and Environmental Engineering, University of California at Berkeley. ‡ Department of Civil and Environmental Engineering, University of California at Berkeley. § Metron Aviation. ¶ Metron Aviation. k Metron Aviation. ∗∗ Assistant Professor, Systems Engineering, Department of Civil and Environmental Engineering, University of California at Berkeley. † Department
1 of 10 American Institute of Aeronautics and Astronautics
AIAA Conference on Guidance, Control and Dynamics Honolulu, HI, Aug. 18-21, 2008 AIAA Paper 2008-6325
B.
NAS Performance and Predictive Models
Frameworks that replicate or predict the movement of individual aircraft dominate TFM and ATM research.1, 2 The aggregation of data is a necessary step to system-wide performance evaluation and the development of effective strategies for ATM system control. We develop an aggregated flow network to represent movement of aircraft through space and time. This network representation has a key advantage over a classic space-time model1 by allowing aircraft speed to vary with geographical location. This better captures movement through the NAS and the patterns of aircraft moving on controlled jet routes. Moreover, aggregation over flows allows users of the model to detect delay patterns that would be hard to recognize solely through the automated post-processing of data. We apply an existing model to predict (minimal) delays that would be imposed on aircraft by air traffic controllers or traffic managers when confronted with airspace capacity shortfalls or demand overages. The model is summarized in Section II. C.
NAS Simulation
The Future ATM Concepts Evaluation Tool (FACET) is a flexible environment for the exploration, development and evaluation of advanced ATM concepts for the National Airspace System (NAS).3 Development of this system was initiated under NASA’s Advanced Air Transportation Technologies (AATT) Project and continues under the current Strategic Airspace Usage (SAU) Project. Examples of ATM concepts studied using FACET include aircraft self-separation, modeling and prediction of air traffic controller workload and airspace complexity, algorithms for rerouting, integration of space launch vehicle operations into the NAS air traffic and advanced Traffic Flow Management techniques.3 In this research effort, we integrate CTM(L) with FACET to provide a fuller simulation of NAS performance under adverse conditions than either the model or FACET could provide on their own. FACET provides a mature, fast-time simulation environment from which delays that would be induced by air traffic controllers or traffic managers in response to en route congestion can be modeled. FACET maintains databases of the physical representation of the NAS (i.e. sector and center boundaries, airport locations, jet routes, waypoints, etc). In turn, CTM(L) provides an abstraction of the NAS that lends itself to aggregate flow modeling and optimization. The integration effort is discussed in Section III. D.
Contributions of this research
This research contributes to the body of air traffic research on several levels. First, we further develop a control model that minimizes restrictions placed on en route aircraft. Second, we construct an abstraction of the system in the form of a network representation of traffic flow that can be used to predict and evaluate the impact of disturbances arising from adverse weather, increased demand levels or special use airspace. Third, through integration with current NASA simulation software (FACET), we apply metrics and visualization techniques to gain insight into the NAS structure and performance under stressed conditions.
II. A.
Large-capacity Cell Transmission Model
Flow Model Used
The system to be modeled is the continental en route U.S. airspace, for altitudes 24,000 feet and above. All non-military flights traveling through the considered airspace are included in the scope of this work. The Enhanced Traffic Management System (ETMS) data used in this study provides the position and altitude of all airborne aircraft in the United States. Additional information related to flight plans or other flight parameters, such as speed and heading, are also provided in the data, but are not used to build the present aggregate model. The CTM(L) model is inspired by Lighthill-Whitham-Richards theory,4, 5 and by the Daganzo Cell Transmission Model,6, 7 which is commonly used in highway traffic. The CTM(L) is based on the graph-theoretic network model constructed from historical ETMS traffic data. Flow on this graph is reduced to a linear time invariant dynamical system, in which the state is a vector of aggregate aircraft counts. The controlled input to the model is delay control, which can take several forms: speed change, vector for spacing (VFS) and holding pattern (HP).
2 of 10 American Institute of Aeronautics and Astronautics
AIAA Conference on Guidance, Control and Dynamics Honolulu, HI, Aug. 18-21, 2008 AIAA Paper 2008-6325
First, flights are clustered based on their entry-exit node pairs in the network. Each pair corresponds to a path consisting of links between these nodes. If two or more paths have one link in common, this link will be duplicated. Therefore, the NAS-wide model can also be cast in the framework below, and the corresponding x(k) includes all cells of the complete network. The [forcing] input, f (k), is the entry count onto the NAS. The output, y(k), denotes the aircraft count in a user-specified set of cells at time step k: x(k + 1) = Ax(k) + B f f (k) + B u u(k),
(1)
y(k) = Cx(k).
(2)
Details about the matrices A, B f and B u are described in the article by Sun and Bayen.8 B.
Track Data Processing
The CTM(L) is designed to predict or optimize the flow control of aircraft for a realistic planning period (e.g. several hours or one day into the future). However, the structure of the NAS should be inferred from a much broader historical data set. We construct the underlying network on which CTM(L) operates by processing historical flight tracks. For this project, we analyzed NAS-wide flight tracks from the Enhanced Traffic Management System (ETMS) over a four-month period from May through August of 2006. The track data processing is explained in more detail in Sun and Bayen8 but here we summarize for the sake of completeness. For each sector of the airspace, graph vertices are created at each entry and exit point, depending on the sectors used to access or leave the sector at hand. Due to the applied aggregation techniques, the physical locations of the vertices on the graph do not necessarily align with the physical locations in the NAS. The edges of the graph are created by connecting these vertices. Thus, each edge (or link) represents the transition across a given sector. Each link is further broken down into cells, which one can think of as interim vertices. These cells are used to model and meter the flow rate across links. Specifically, using the ETMS track data, we analyze the typical (historical) travel times across the links. Each link is broken down into n-many cells, where n is a (integer rounded) division of the average transit time across the link by the time step assumed by the model. For instance, if the average transit time is five minutes and the one-minute time steps have been selected, then the link would be subdivided into five cells. This generates a graph of vertices and edges. The optimization algorithm behind CTM(L) is a mixed integer linear program operating on multiple commodities. Each commodity represents an aggregation of aircraft between the origin and destination airports or, more precisely, between en route sectors closest to the origin and destination airports. We assume that each such flow commodity travels on one (or some small number of a) path in the network. An additional copy of the graph is created for each commodity. Commodities are linked by their usage of capacity and common vertices (sector entry/exit points). Using the method described in Sun and Bayen,8 in the CTM(L), there are 284 high-altitude sectors, 1598 links and 1841 nodes. Each commodity-specific vertex is copied once for each time step in the simulation experiment. For example, eight hours of traffic simulation at one-minute time steps leads to 60 x 8 = 480 copies of the vertex. Together, the commodity-specific and time-specific graphs comprise the underlying network. Unimpeded volumes of aircraft flow across the network by moving from one cell to another along their respective paths but forward in time. For instance, if the path calls for movement from cell cj to cell cj + 1, and if there are n aircraft in cell cj at time t, then there would be n aircraft of that type in cell cj + 1 at time t + 1. Since cells have been placed in proportion to typical transit speeds, movement from one cell is guaranteed to happen at the proper rate (on the average). Impeded flow of aircraft is modeled as the looping of aircraft from a cell to the same cell as time progresses. For instance, if n aircraft are in cell cj at time t and are held for one time period, then they would also be in cell cj at time period t + 1. C.
Sector Capacity Modeling
ETMS flight track data between May and June 2006 is used to model default sector capacity values. The CTM(L) reflects capacity as an instantaneous airspace occupancy value (i.e. the maximum number of aircraft permitted to occupy a sector in any minute of time). For each sector, we compute the capacity as the statistical 95th percentile value within the historically observed data. Furthermore, in order to account
3 of 10 American Institute of Aeronautics and Astronautics
AIAA Conference on Guidance, Control and Dynamics Honolulu, HI, Aug. 18-21, 2008 AIAA Paper 2008-6325
for low-demand sectors, we set a lower bound on sector capacity as the median of all sectors’ 95th percentile values. In addition to default sector capacities, a method for computing weather-reduced capacities is needed. We employ a method used in prior research by Krozel and Doble9 for computing lowered airspace capacity as a function of convective weather coverage. Specifically, we measure the percent of sector coverage using the National Convective Weather Diagnostic (NCWD) weather reports over the time range CTM(L) is solving. Then, we lower sector capacities, as a fraction of the default values, using the function specified in Krozel.9
III.
Integration of CTM(L) with FACET
This integration and analysis is part of a larger research effort to model and understand the performance of the current air traffic management system. The metrics and knowledge gained through this research will feed development of the future air traffic management system, a prime focus of NASA research in ATM. Furthermore, FACET maps CTM(L) controls onto individual flights through a process we call “disaggregation.” A.
Interfacing with FACET
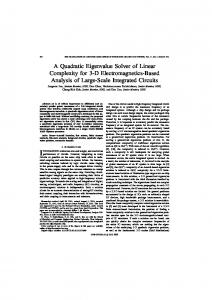
As previously stated, the CTM(L) model is being integrated with FACET. Specifically, FACET generates an initial input to the CTM(L) model in the form of projected flight demand for network commodities. The CTM(L) model processes this demand and computes the optimal TFM initiatives necessary to reduce congestion. FACET accepts the CTM(L) results and yields metrics and visualizations that enable the interpretation of the aggregate model solution.
Figure 1. CTM(L) Integration with FACET.
B.
Simulation and Visualization
One of the main integration activities is to enable visualization of this abstract network and the traffic demand levels it carries, both before and after control by CTM(L). Visualization of the underlying network leverages the inherent human capability to detect visual patterns. Each link in the CTM(L) network represents an aggregation of paths, specifically, traffic that crosses a sector using a fixed entry and exit sector. For example, all traffic entering sector s1 via sector s2 and leaving via sector s3 . The length of a link denotes the average number of minutes it takes to make that sector crossing. Thus, link length gives implicit aircraft speed information. The entry and exit points are ideally lying on the boundary of sectors; but because of necessary approximations, this is not always the case. Therefore, the visualization function includes mapping the entry and exit points to the boundaries of sectors. In some cases (when the sectors are non-convex), connecting the entry and exit points results in line segments outside the sector; the visualization function also includes drawing links constrained in the sector. We use color and intensity to represent traffic demand. This provides a convenient way to see where in the NAS delays would be accumulating. Figure 2 represents the visualization of the CTM(L) network in FACET.
4 of 10 American Institute of Aeronautics and Astronautics
AIAA Conference on Guidance, Control and Dynamics Honolulu, HI, Aug. 18-21, 2008 AIAA Paper 2008-6325
Figure 2. FACET Depiction of the CTM(L) Network.
C.
ATC Actuation
Another integration activity is actuation of the CTM(L) control. For each time period in the planning horizon, the CTM(L) optimization algorithm (a mixed integer linear program) dictates how many aircraft will be held (in theoretical looping) at each link in the CTM(L) network, as well as the number of unimpeded aircraft that will be present. Before this can be realized, the output of the optimization algorithm must be parsed and mapped to the CTM(L) network both spatially and temporally. The aforementioned actuation occurs at the aggregated level. We also actuate at the flight-specific level. For this actuation, the aggregate flow output from the CTM(L) optimization algorithm is mapped into individual flights. One can think of this as disaggregation. Inherent in this process is the resolution of the ambiguities associated with aggregation. For instance, we may know that three flights are held at a given sector boundary, but which three flights? Since links and aggregated flows in the CTM(L) are specific to certain commodities (origin-destination pairs), in some sense, it does not matter which flights we pick, provided that they are from the right origin-destination pair. However, the choice of flights must be made consistent with subsequent holding information at other points on the paths and links. For this, we have developed a disaggregation algorithm based on the resource allocation algorithm provided by Hoffman et al.10 D.
Dissagregation Algorithm
This disaggregation algorithm converts an aggregate (flow-based) solution from the CTM(L) to a flightspecific solution. The CMT(L) outputs for each cell (which we can consider as the smallest resource) the number of aircraft that should be in it during each time period. This algorithm then says which flights should be in that cell during each time period. From that information, routes and speeds can be fed to FACET, or FACET can simply use the optimized departure times of flights to perform its ordinary fast-time simulation using its own trajectory predictions. Input P = set of paths (O-D pairs) Fp = set of all flights on path P S F = set of all flights such that F = P FP
5 of 10 American Institute of Aeronautics and Astronautics
AIAA Conference on Guidance, Control and Dynamics Honolulu, HI, Aug. 18-21, 2008 AIAA Paper 2008-6325
t = 1, 2, . . . , T = set of time intervals (e.g. 1-minute each) C = set of cells, indexed by k ck (t) = number of flights to be in ck during t (optimized cell count from CTM(L)) Output Lk (t) = a list of flights using ck during t, where |Lk (t)| = ck (t) Xkf (t) = binary variable set via 1 if flight f uses cell k during t, 0 otherwise Preprocessing Choose a flight-ordering rule (for allocating flights to resources one by one). Earlier work provides other options.10 Options include: first-come, first-served, ration-by-schedule (i.e. first-scheduled, first-served), or flight demanding the most constrained resource. Main Algorithm 1. Order the flights in F , according to the chosen flight-ordering rule. We can assume they are indexed f1 , f2 , . . . , fN , where N = |F |. 2. For f1 , f2 , . . . , fN , schedule the flight across the set of cells that lie along its pre-determined path. This determines not only the time at which f will be in each cell, but also how long it will stay there. For instance, if f enters the system via cell c1 at time 5, exits via cell c4 at time 9, and is held at c3 for two time periods, then these binary variables are all set to value 1: X1f (5), X2f (6), X3f (7), X3f (8), X4f (9). 3. Output delay stats for each flight. Note that the unconstrained travel time of f is |P |, where f ∈ Fp . Also, the constrained travel time of f is t2 − t1 , where t2 = max{t : Xkf (t) = 1}, t1 = min{t : Xkf (t) = 1}. 4. Output all X variables and cell flight lists. Analysis of Algorithm This is a dispatching algorithm, in the sense that it processes flights one by one. An alternative would be to process ck (t) values one by one, running over all cells k and over all time periods t. But many of these will have a zero value, so this would be probably inefficient. Also, by processing flights one at a time, we can ensure reasonable equity, which is determined by the flight-ordering rule. The algorithm is correct in two respects. First, cell counts cannot be exceeded. Also, each must be met, assuming sufficient demand. This is ensured by CTM(L) optimization. The algorithm is complete because every flight receives a time slot at each of the resources it needs to fly from its entry sector to its exit sector. Also, it specifies for each cell count. The only way it can fail is if CTM(L) optimization output did not allocate enough cell counts (ck (t) values) to accommodate all the demand. Run time of the algorithm will be proportional to the sum of all cell counts over all k and t values.
IV. A.
Example of FACET-CTM(L) Integration
Weather Scenario
For the purpose of demonstrating the FACET-CTM(L) integration, we select a severe weather day from 2006 to investigate. The CTM(L) optimizes the air traffic demand for two cases. A first solution uses default sector capacities and a second solution is achieved using the weather-reduced capacities. We can then interpret the difference in the two solutions as the impact of the convective weather. Figure 3 displays the weather scenario used in this example. The shaded areas are the regions of the NAS for which the model solved for capacity constraints. Out of the 284 sectors within the model, 97 were given a capacity constraint. The results presented in this section are for a single hour of model solution (19:00z to 20:00z). 6 of 10 American Institute of Aeronautics and Astronautics
AIAA Conference on Guidance, Control and Dynamics Honolulu, HI, Aug. 18-21, 2008 AIAA Paper 2008-6325
Figure 3. NCWD Weather Reports from 19:01z through 21:01z on July 21, 2006.
B.
FACET Interpretation of Aggregate Model Results
FACET loads the CTM(L) results and generates metrics and visualizations of the model’s solutions. The aggregate results specify aircraft count and delays to occur per network cell, per model time step. This information can be interpreted at the cell, link, and sector levels. FACET can display the model’s link demand levels at a point in time, as shown in Figure 4. This visualization uses link colors to indicate different levels of aircraft loading, and links are only visible if they have non-zero demand. We can also use a slider bar to allow the user of the CTM(L) model to see demand levels over time; as the slider is moved forward, visualized traffic demand levels change over time over a backdrop of the CTM(L) network. From this an animation can also be assembled. Another type of FACET visualization displays the model’s assigned delay per sector. Figure 5 displays the total delay per sector, summed over the entire CTM(L) optimization time range. In the image, only sectors with positive delay are shaded. Comparing the geographic distribution of delays to the weather coverage (see Figure 3), we can observe that the model appears to pass delay away from the weather-congestion. Metric Total Delay Average Delay per Sector Percent of Sectors Affected Maximum Sector Delay
Result 4,903 minutes 17.3 minutes 25.0% 310 minutes
Table 1. FACET Aggregate Metrics.
At the aggregate level, we can interpret a number of useful numerical results (see Table 1). The model applied 4,903 minutes of total delay across 25 percent of the sectors (i.e. 75 percent of the sectors were not impacted). According to the model, an optimal solution to the weather-reduced capacities involves allocating a high amount of delay across a relatively small fraction of the sectors. This is illustrated further in the sector delay distribution graph shown in Figure 6. In fact, ten sectors account for roughly 37% of the total assigned delay. This can be interpreted as the model searching for an optimally minimized NAS impact.
7 of 10 American Institute of Aeronautics and Astronautics
AIAA Conference on Guidance, Control and Dynamics Honolulu, HI, Aug. 18-21, 2008 AIAA Paper 2008-6325
Figure 4. FACET Showing Aggregate Link Demands at an Instant in Time.
Figure 5. Cumulative Aggregate Sector Delays.
8 of 10 American Institute of Aeronautics and Astronautics
AIAA Conference on Guidance, Control and Dynamics Honolulu, HI, Aug. 18-21, 2008 AIAA Paper 2008-6325
Figure 6. Sector Delay Distribution Graph.
V.
Conclusion and Future Work
This article presented an integration of computational tools to assess the performance of the National Airspace System. A Large-capacity Cell Transimission Model, CTM(L), is developed to model the airspace system as a time invariant linear dynamical system. Based on CTM(L), a mixed integer program is formulated and solved to minimize the total delay of the aircraft. The CTM(L) is integrated with FACET, a software developed at NASA Ames Research Center. Based on the aggregated network associated with the CTM(L), an integrated environment is designed to analyze and propose TFM solutions for weather disturbances. Future work of this research will mainly include the following items (i) The current CTM(L) model focuses on en route air traffic. It would be straightforward to generate additional links connecting airports to high altitude sectors, expanding the current network model of the NAS to include airports in the study. (ii) The optimization algorithm designed in this article is focused on en route delay, which does not take into account flight reroutes. Based on the aggregated network developed in this article, new optimization algorithms will be developed for reroutes, which will be useful to mitigate the impact of the shortfall of airspace capacities, which will be particularly useful for AFPs. (iii) The disaggregation algorithm described in Section III will be completed in the FACET-CTM(L) integration effort. Once this is complete, FACET will be able to further evaluate the effectiveness of the CTM(L) solutions. Specifically, FACET will be capable of measuring flight-level metrics and it will allow us to study the model’s ability to reduce congestion in individual NAS elements.
Acknowledgments This research was supported by the NASA NGATS-ATM Airspace Project through contract NNA06CN27A. We are grateful to are NASA researchers Banavar Sridhar and Shone Grabbe (Associate Principal Investigator of the Traffic Flow Management research focus area) for their thoughtful suggestions and insight into the modeling and simulation of the NAS.
References 1 Helme, M., “Reducing Air Traffic Delay in a Space-Time Network,” IEEE International Conference on Systems, Man and Cybernetics, Vol. 1, 1992, pp. 236–242. 2 Bertsimas, D. and Stock, S., “The Air Traffic Flow Management problem with enroute capacities,” Operations Research, Vol. 46, No. 3, May–June 1998, pp. 406–422. 3 Bilimoria, K., Sridhar, B., Chatterji, G., Sheth, K., and Grabbe, S., “FACET: Future ATM concepts evaluation tool,” Proceedings of the 3rd USA/Europe ATM 2001 R&D Seminar , Naples, Italy, June 2001. 4 Lighthill, M. J. and Whitham, G. B., “On kinematic waves. II. A Theory of traffic flow on long crowded roads,” Proceedings of the Royal Society of London, Vol. 229, No. 1178, 1956, pp. 317–345. 5 Richards, P. I., “Shock waves on the highway,” Operations Research, Vol. 4, No. 1, 1956, pp. 42–51. 6 Daganzo, C., “The cell transmission model: a dynamic representation of highway traffic consistent with the hydrodynamic theory,” Transportation Research Part B , Vol. 28, No. 4, 1994, pp. 269–287.
9 of 10 American Institute of Aeronautics and Astronautics
AIAA Conference on Guidance, Control and Dynamics Honolulu, HI, Aug. 18-21, 2008 AIAA Paper 2008-6325
7 Daganzo, C., “The cell transmission model, part II: network traffic,” Transportation Research Part B , Vol. 29, No. 2, 1995, pp. 79–93. 8 Sun, D. and Bayen, A., “Multicommodity Eulerian-Lagrangian Large-capacity Cell Transmission Model for en route traffic,” AIAA Journal of Guidance, Control and Dynamics, Vol. 31, No. 3, 2008, pp. 616–628. 9 Krozel, J. and Doble, N., “Simulation of the National Airspace System in Inclement Weather,” AIAA Modeling and Simulation Technologies Conference, Hilton Head, SC, August 2007. 10 Hoffman, R., Burke, J., Lewis, T., Futer, A., and Ball, M., “Resource Allocation Principles for Airspace Flow Control,” AIAA Aviation Technology, Integration, and Operations (ATIO) Forum, Arlington, VA, September 2005. 11 Brennan, M., “Airspace Flow Programs - A Fast Path to Deployment,” Journal of Air Traffic Control, Vol. 49, No. 1, 2007, pp. 51–55. 12 “Airspace Flow Programs,” The CDM News, Vol. 2, No. 1, 2006, pp. 1.
10 of 10 American Institute of Aeronautics and Astronautics