KSCE Journal of Civil Engineering (0000) 00(0):1-9 Copyright ⓒ2016 Korean Society of Civil Engineers DOI 10.1007/s12205-016-0777-x
Transportation Engineering
pISSN 1226-7988, eISSN 1976-3808 www.springer.com/12205
TECHNICAL NOTE
Integration of Heuristic and Statistical Methods for Estimation of Cyclist Injury Severity Shinhye Joo*, Soyoung Jung**, and Cheol Oh*** Received December 16, 2014/Revised August 22, 2015/Accepted January 11, 2016/Published Online March 4, 2016
··································································································································································································································
Abstract The number of crashes that involve bicycles and result in severe injuries has increased every year in the Republic of Korea, though bicycling is a promising alternative transportation mode that can help address transportation emission problems. Correspondingly, this study intends to quantitatively examine the impacts of contributing factors on the cyclist injury severity levels and to provide meaningful insight into prioritizing and specifying strategies for improving cyclist safety. To this end, a decision tree and ordered probit regression were integrated in this study. The findings showed that heavy vehicle use and cyclist age should be preferentially considered when implementing cyclist safety improvement strategies: targeting young heavy-vehicle drivers or cyclists, driver education regarding proper curve maneuvering and a law enforcement prohibition of speeding are suggested, and ITS-based traffic management system and road facilities would help enhance light vehicle driver visibility and senior cyclist alertness, particularly in horizontally curving road sections. These data-driven results could quantitatively support the policy makers or practitioners making decisions about prioritizing cyclist safety improvement strategy implementations and further specifying such strategies. Keywords: cyclist injury, decision tree, ordered probit regression, prioritizing and specifying strategies, cyclist safety improvement ··································································································································································································································
1. Introduction Bicycling is an environmentally friendly and emission-free transportation mode that can help increase the sustainability of transportation systems. Bicycling is also a reasonably fast alternative for short-distance trips, particularly in congested urban networks (Rietveld, 2000). Due to these advantages, there have been worldwide efforts to encourage the use of bicycles. However, safety and comfort issues remain serious impediments to the use of bicycles. Cyclists in bicycle-involved crashes are more likely to be seriously injured than motor vehicle occupants are. The number of bicycle-involved crashes has increased annually by 6.9% in the Republic of Korea (Korea hereafter) since 2001 (KoRoad Traffic Authority, 2013). In particular, elderly cyclists have elevated risks of severe injuries due to their physical fragility. Fatalities from bicycle-involved crashes for cyclists aged 60 or greater represent 21% of all bicycle-involved crashes that occur in Korea. Thus, elderly cyclists were observed to be the most vulnerable bicycle user group. To address the aforementioned bicycle safety issues, the Korean government provided some strategies to enhance cyclist safety in the 7th National Transportation Safety Master Plan
(Ministry of Land, Infrastructure and Transport, 2012). The national master plan simply listed cyclist safety improvement strategies such as bicycle road safety audits, education for the safe operation of bicycles, protective facility implementation and maintenance of existing bicycle roads. However, the current cyclist safety improvement strategies were neither data-driven nor supported by quantitative studies that examined impacts of risk factors on cyclist safety. Further, the cyclist safety improvement strategies lack specificity. For example, no priority targets for cyclist safety improvements were identified. Moreover, the current cyclist safety improvement strategies do not provide items that include what education methods are effective, who the target of the education methods is, or where the protective facilities should be implemented. Therefore, it is necessary to determine factors that contribute to the severity of cyclist injuries with relevant priorities and thereby further specify the current strategies to more effectively enhance Korean cyclist safety. To satisfy the need for cyclist safety enhancement, this study aims to identify contributing factors that affect the severity of cyclist injuries involved in a certain crash type and provide meaningful insights into prioritizing and specifying strategies for
*Research Assistant, Dept. of Transportation and Logistics Engineering, Hanyang University, Ansan 425-791, Korea (E-mail:
[email protected]) **Research Professor, Dept. of Transportation and Logistics Engineering, Hanyang University, Ansan 425-791, Korea (Corresponding Author, E-mail:
[email protected]) ***Associate Professor, Ph.D., Dept. of Transportation and Logistics Engineering, Hanyang University, Ansan 425-791, Korea (E-mail:
[email protected]) −1−
Shinhye Joo, Soyoung Jung, and Cheol Oh
cyclist safety improvement. For this aim, this study combined a heuristic method with ordered probability modeling. Using the heuristic method, a decision tree algorithm was employed in the current study, which has the advantages of separating homogeneous crash observations and removing unobserved factor effects. The decision tree can also prioritize the splitting variables that affect the target response variable, which thus distinguishes this method from traditional clustering techniques and is consistent with the aim of this study. We focus on crashes with cyclist fatalities and injuries because they include comparatively large human and economic losses rather than Property Damage Only (PDO) crashes. Three-year bicycle-involved crash data for the Gyonggi province in Korea are used. This paper is organized as follows. First, we present a literature review of the factors that affect bicycle-related crashes and of several analysis methods. Next, the methodologies and data used in this research are described. The findings and a discussion are also presented. Finally, we provide conclusions and future research directions.
2. Literature Review Based on the study aim, a literature review is focused on studies that have considered contributing factors to bicycle-related crashes. We also describe various analytical methodologies to identify the contributing factors that were used in safety estimation. Several studies have identified human factors, such as vehicle drivers’ speeding, irregular maneuvers, intoxication, and age as well as cyclists’ age and gender, that significantly affect fatality in bicycle-related crashes (Bíl et al., 2010; Kim et al., 2007; Yan et al., 2011; Moore et al., 2011). Heavy vehicles, such as trucks, were also identified as a significant contributing factor that increased the crash severities (Kim et al., 2007; Yan et al., 2011; Moore et al., 2011). Additionally, external factors, such as road geometry and temporal attributes, have significant effects on the severity of bicycle-vehicle crashes (Bíl et al., 2010; Kim et al., 2007; Yan et al., 2011; Moore et al., 2011). To examine impacts of contributing factors on road user safety, numerous studies have utilized generalized linear models and data-mining techniques. The most frequently used methods are ordered probability and multinomial logit modeling. Binary logit modeling (Yan et al., 2011), sequential logistic regression (Jung et al., 2011; Jung et al., 2013) and mixed logit modeling (Moore et al., 2011) have also been used to examine the factors that impact ordered response variables. Comparing the multinomial and mixed logit models, the mixed logit model was found to offer a superior fit (Moore et al., 2011). Naveen et al. (2008) generalized the standard ordered response models for injury severity analysis. An ordered response model is likely to provide unreliable factors that impact the target variable when there are heterogeneous data and interactions among factors. To address data heterogeneity, other safety assessment methods have been employed, including data-mining techniques, such as classification trees or clustering.
Classification and Regression Tree (CART) and K-means clustering have been employed to analyze the most sensitive factors to crashes (Montella et al., 2011; Kashani et al., 2011; Kim et al., 2007; Prato et al., 2010). Most previous studies have separately employed ordered response probability models or data-mining techniques such as decision trees or traditional clustering to analyze bicycle-involved crash data. Compared with traditional clustering techniques, decision trees are advantageous because they prioritize the splitting of factors that affect target response variables. Few studies have considered integrating a decision tree and ordered probability models to estimate cyclist safety.
3. Methodology The methodological framework proposed in this study consists of two main steps. The first step is to classify bicycle-involved crashes into several homogeneous groups using a decision tree. The decision tree approach is a non-parametric data mining technique that is used for classification. The decision tree approach is able to separate homogenous crash groups by targeting crash severity, which is much easier than the clustering technique, which must determine clustering variables. The first step is associated with prioritizing the factors that contribute to cyclist injury severities, which can determine the order of implementing relevant cyclist safety improvement strategies; this is one of the current study’s aims, as mentioned in the Introduction section. However, the classification model must be used not as an attempt to supplant other techniques but as a complementary method that can be integrated into other safety analyses (Montella et al., 2011). The second step of employing multi-category response models is thus to identify the impacts of the identified contributing factors on the severity of cyclist injuries in each homogenous crash group, as determined by the first step of decision tree development. The second step is associated with further specifying strategies for cyclist safety improvement, which is also an aim of the current and was introduced in section 1. This study employed a decision tree to separate homogeneous crash observations by identifying the importance of the variables that affect target response variables (cyclist injury severities). Then, multinomial logit, ordered logit and probit logit model fits were compared to estimate cyclist injury severities. The P-value of the chi-squared test for global fit, the AIC value, and parameter significance were used to select the best estimation model. As a result, the ordered probit model was found to be optimal for cyclist injury estimation. Theoretical concepts for decision trees and ordered probit regression are presented as follows. 3.1 Decision Tree Approach The decision tree approach is a commonly used method for data-mining. The decision tree classifies instances in the form of a tree. The tree can be “learned” by splitting the source set into subsets based on an attribute value test. This process is repeated
−2−
KSCE Journal of Civil Engineering
Integration of Heuristic and Statistical Methods for Estimation of Cyclist Injury Severity
on each derived subset in a recursive manner called recursive partitioning. The recursion is completed when the subset at a node has the same value as the target variable or when splitting no longer adds value to the predictions (Quinlan, 1986). This process starts from an initial node, called the root node, and progresses to the terminal nodes by top-down induction. During the splitting process, the Gini index is frequently used as a measure of the impurity in the node, as specified by Kashani et al. (2011). The Gini index is expressed as j
Gini (i) = 1 − Σ j = 1 Pij
I
Ni - ∆ Gini (xj, i) ∑ ---N
(2)
i=1
where ∆Gini(xj,i) is the reduction in the Gini index at node i, which is achieved by splitting variable xj, I is the total number of nodes, N is the total number of observations, and Ni /N is the proportion of observations in the dataset that belong to node I (Kashani et al., 2011). 3.2 Ordered Probit Regression The ordered probit regression is a typical statistical method that is used to estimate an ordered response with multiple categories, such as injury severity levels (Duncan et al., 1998). Similarly, ordered logit or multinomial logit models are also frequently used to estimate multi-category responses. Because the ordered probit model showed the best fit to the dataset used in this study, we utilized an ordered probit regression formulation. This ordered probit regression is a generalization of the popular probit analysis for a case of more than two outcomes for an ordinal dependent variable, which is specified as P (Y|X) = Φ (X’β) *
(4)
*
= 2, if µ 1 ≤ Y ≤ µ 2 *
= 3, if µ 2 ≤ Y ≤ µ 3 M *
= J, if µ J – 1 < Y , where µ represents the unknown (or latent) threshold parameters to be estimated along with the parameter vector for the explanatory variables β. The ordered probit technique uses the observations for Y, which are a form of censored data for Y *, to fit the parameter vector β.
4. Data Crashes that occurred in the Korean road system are initially recorded in police reports. The police records of crashes are transferred to the database center at the Korea Road Traffic Authority (KoRoad) and digitized. The current study considered all data fields of the KoRoad crash dataset. To develop a decision tree and estimate cyclist injury severities, this study utilized bicycle-involved crashes that occurred in Kyonggi province, Korea, between 2010 and 2012. The threeyear bicycle to vehicle crash dataset yielded 4,476 observations. The dependent variable was cyclist injury severity level involved in bicycle involved crashes: fatal injury vs. severe injury vs. minor injury (fatal injury: 153, severe injury: 2,160, minor injury: 2,163). A severe injury was an injury that required more than three weeks of hospital care. A minor injury required less than three weeks of hospital care. The KoRoad crash dataset also involved 18 data fields regarding crash characteristics, road geometries, environment, and humanrelated factors. The records in all data fields were categorical. All 18 data fields were considered explanatory variables for this study, as listed in Table 1. The categories in each explanatory variable were classified based on a sample size greater than 30, and each category was coded as binary values, 1 and 0.
5. Results and Discussion
(3)
k
Y = Σ k = 1 βk x k + ε where P is the probability of the response outcome, Y is the outcome of the response, X is the vector of the repressors, Φ is a cumulative distribution function of the standard normal distribution, β is the vector of the regression coefficients that we wish to estimate, Y * is the exact unobserved dependent variable, x represents the explanatory variables, and K is the total number of Vol. 00, No. 0 / 000 0000
*
Y = 1, if Y ≤ µ 1 (= 0)
(1)
where Pij is the number of class j cases divided by all of the cases in node i. If all observations on a node i belong to one class, the Gini (i) will be zero, indicating the greatest possible purity in node i. From a root node that contacts all observations, tree growth will continue until only similar observations exist at each terminal node based on the Gini index. In the decision tree growing method, one of the most useful outputs is the independent Variable Importance Measure (VIM) (Breiman et al., 1984; Rokach and Maimon, 2008; Jung et al., 2016). The decision tree ranks each predictor according to its importance to the model through the VIM, which is calculated by VIM (xj) =
explanatory variables. The dependent variable Y, i.e., the cyclist injury severities in this study, has J categories. In our case, J is equal to three, which are coded as 1 for fatal injuries, 2 for severe injuries, and 3 for minor injuries. This is expressed as
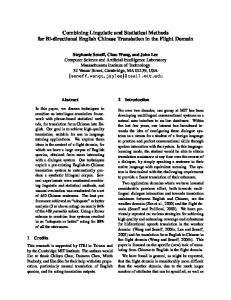
5.1 Decision Tree Development The split diagram of the decision tree is provided in Fig. 1. According to Fig. 1, the decision tree provided three terminal nodes, including one crash group separated by at-fault vehicle type and two crash groups separated by at-fault vehicle type and cyclist age. All crash groups found in the three terminal nodes had sizeable samples. For the ordered probit regression, the bicyclerelated crash dataset was divided into three homogeneous groups:
−3−
Shinhye Joo, Soyoung Jung, and Cheol Oh
Table 1. Descriptive Statistics of Variables Variable Dependent variable Fatal injury Injury Severe injury Severity Minor injury Independent variable Crash characteristics
Hour of the time
Head-on Parking Crash type Passing Side Other Environmental characteristics Spring Summer Season Fall Winter Rain or snow Weather Cloudy Clear Geometric characteristics National highway Provincial road Road City road function class County road Local road At intersection Near intersection On crosswalk Road Pattern Near crosswalk On single-route road Bridge or tunnel Signal Curve to the left Curve Curve to the right Straight Uphill Grade Downhill Flat Human characteristics Passenger car Van or Bus At-fault Motorcycle vehicle type Truck Machine vehicle At-fault driver’s gender Cyclist gender
Variable definition
N (%)
The crash involved a fatality The crash involved a severe injury The crash involved slight or no damage
153 (4) 2,160 (48) 2,163 (48)
Midnight (23:00-5:00) Morning peak (6:00-8:00) Non-peak (9:00-13:00) Afternoon peak (14:00-18:00) Nighttime (19:00-22:00) Head-on collision Rear-end collision in parking Rear-end collision in passing Side right-angle collision Other types of collision
359 (8) 680 (15) 1,024 (23) 1,490 (33) 923 (21) 118 (3) 64 (1) 454 (10) 2,439 (54) 1,401 (32)
The crash happened in spring The crash happened in summer The crash happened in fall The crash happened in winter The crash happened in rainy or snowy weather The crash happened in cloudy weather The crash happened in clear weather
1,118 (25) 1,449 (32) 1,412 (32) 497 (11) 169 (4) 186 (4) 4,121 (92)
The crash occurred on a road system managed by the national authority The crash occurred on a trunk road system managed by a provincial government The crash occurred on a road system within a city The crash occurred on a road system managed by a county The crash occurred on a road within a village or community. The crash occurred at an intersection The crash occurred near an intersection The crash occurred in a crosswalk The crash occurred near a crosswalk The crash occurred on a single-route road The crash occurred on a bridge or in a tunnel A signal was installed at the crash location The crash occurred on a road that curved to the left The crash occurred on a road that curved to the right The crash occurred on a straight road The crash occurred on an uphill road The crash occurred on a downhill road The crash occurred on a flat road
787 (18) 481 (11) 3,995 (64) 52 (1) 272 (6) 1,356 (30) 863 (19) 550 (12) 75 (2) 1,591 (36) 41 (1) 1,906 (43) 96 (2) 144 (3) 4,236 (95) 214 (5) 319 (7) 3,943 (88)
At-fault passenger car At-fault van or bus At-fault motorcycle At-fault truck At-fault machine vehicle such as a construction machine vehicle Male Female Male Female
3,110 (69) 494 (11) 262 (6) 585 (13) 25 (1) 3,438 (77) 1,038 (23) 3,511 (78) 965 (22)
−4−
KSCE Journal of Civil Engineering
Integration of Heuristic and Statistical Methods for Estimation of Cyclist Injury Severity
Table 1. Continued Variable
At-fault driver age
Cyclist age
At-fault driver experience
Blood alcohol content (BAC) of driver
BAC of cyclist Improper intersection pass Signal violation ©©©Driver’s Safe distance violation violation Reckless driving Centerline violation No pedestrian protection
Variable definition At-fault driver aged less than 10 At-fault driver aged 10 to 19 At-fault driver aged 20 to 29 At-fault driver aged 30 to 29 At-fault driver aged 40 to 49 At-fault driver aged 50 to 59 At-fault driver aged 60 or greater Cyclist aged less than 10 Cyclist aged 10 to 19 Cyclist aged 20 to 29 Cyclist aged 30 to 39 Cyclist aged 40 to 49 Cyclist aged 50 to 59 Cyclist aged 60 or greater Unlicensed driving Less than 5 years Less than 10 years Less than 15 years More than 15 years Unknown/Undefined Normal driving Less than 0.09% More than 0.1% Unknown/Undefined Normal driving Drunk driving Unknown/Undefined At-fault driver violated the intersection pass rule At-fault driver violated the rule on signaling At-fault driver violated the rule on keeping a safe distance At-fault driver violated the rule on reckless driving At-fault driver violated the rule on maintaining the centerline At-fault driver violated the rule on protecting pedestrians
at-fault heavy vehicles, including vans, buses, trucks, and machine vehicles; at-fault light vehicle-cyclists aged 50 or older; and atfault light vehicle-cyclists aged less than 50. Cyclists aged 50 or greater are referred to as senior cyclists hereafter. As shown in Fig. 1, at-fault vehicle type and cyclist age were the splitters that mainly affected cyclist injury severities in the decision tree algorithm. Because these two splitters were much stronger factors than the other explanatory variables, the resultant decision tree was simplified, as shown in Fig. 1. The Variable Importance Measures (VIM) for at-fault vehicle type and cyclist age variables verified their strong impacts on cyclist injury severities. In Table 2, the VIM indicates the comparative variable importance based on the at-fault vehicle type, with a value of 100. The VIM value of cyclist age was found to be 78, which was the second-highest of all VIM values. However, the VIM values for the other variables were less than 20, which is clearly and comparatively lower than the VIM values for vehicle type and cyclist age. Thus, the decision tree was simply completed, as Vol. 00, No. 0 / 000 0000
N (%) 0 (0) 48 (1) 491 (11) 974 (22) 1,368 (31) 1,019 (23) 576 (13) 326 (7) 716 (16) 451 (10) 484 (11) 750 (17) 744 (17) 1,005 (22) 54 (1) 596 (13) 672 (15) 721 (16) 2,008 (45) 425 (10) 2,754 (62) 38 (1) 72 (2) 1,612 (35) 2,810 (64) 30 (1) 1,636 (37) 623 (14) 800 (18) 79 (2) 2764 (61) 163 (4) 87 (2)
shown in Fig. 1. The resultant decision tree also provided reasonable classification accuracy. According to Table 2, all of the cyclist injury severity levels had more than 50% prediction accuracy in the learning samples. In particular, the decision tree provided high accuracies of more than 70% for fatal injuries in both the learning and testing crash samples, which is consistent with our estimation based on the substantial human and economic losses. 5.2 Decision Tree Based Cyclist Injury Severity Estimation Comparing the multinomial logit, ordered logit and ordered probit models, the ordered probit model was selected as the best model based on its global goodness of fit and parameter estimate significance, as shown in Table 3. For bicycle-involved crashes that were separated by at-fault heavy vehicle type, both right-curving sections and drivers aged 30 to 39 were found to increase the probabilities of cyclist injury severities. In particular, the parameter estimate (0.6443) for curve
−5−
Shinhye Joo, Soyoung Jung, and Cheol Oh
Fig. 1. Decision Tree (1: fatal injury; 2: severe injury; 3: minor injury). Table 2. Resultant Decision Tree Model Prediction Accuracy Cyclist injuries Learning (%) Testing (%) Fatal injuries 72 79 Severe injuries 50 40 Minor injuries 50 44 Overall 50 43 Variable Importance Measures (VIM) Standardized Standardized Variable Variable VIM (%) VIM (%) At-fault vehicle type 100 Hour of the day 3 Cyclist age 78 Curve 3 Weather 17 Crash type 2 At-fault driver violation 16 Road class 2 Driving Grade 10 1 experience At-fault driver age 4 Road pattern 1
sections was approximately doubled compared to the parameter estimate (0.3267) for drivers aged 30 to 39. This result implies geometric road complexity is a comparatively challenging factor for heavy vehicle maneuvering. This result also implies that education/training programs on negotiating curves, specifically targeting heavy vehicle drivers in their thirties, would help reduce serious injuries to cyclists.
For bicycle-involved crashes that were separated by at-fault light vehicle type and cyclists aged less than 50, the factors of spring season, morning peak time and at-fault drivers’ driving experience of less than five years were likely to increase the probabilities of cyclist injury severities. Comparing two temporal factors, the resultant parameter estimate of morning peak time (0.2209) was found to be greater than that of spring season (0.1776). In Korea, cyclists often travel during morning peak hours for commuting. That is, cyclists are more likely to be exposed to higher traffic conditions during the morning peak hours. Several previous studies have shown similar results, where crashes that occur during the morning peak hours have a higher probability of fatal injury (Kim et al., 2007; Eilert-Petersson and Schelp, 2007; Rodgers, 1995). These studies asserted that both motorists and bicyclists tend to drive and bike more aggressively during the busy morning commute and that such behavior can increase bicyclist injury severity. Additionally, novice drivers are more likely to be included in the group of young drivers who drive aggressively without sufficient driving experience, which might cause severe cyclist injuries. To prevent severe cyclist injuries, these findings suggest the implementation of ITS-based temporal traffic management and safety education/campaign strategies targeting both novice light-vehicle drivers and comparatively younger cyclists. For bicycle-involved crashes that were separated by at-fault
−6−
KSCE Journal of Civil Engineering
Integration of Heuristic and Statistical Methods for Estimation of Cyclist Injury Severity
Table 3. Resultant Ordered Probit Model Parameter Curve to the right Driver aged 30-39 Parameter Spring (March to May) Morning peak (6 to 8 AM) Driver experience less than 5 years Parameter Curve to the right Grade downhill parameter Morning peak (6 to 8 AM) Bus Truck Machine vehicle Driver aged 30-39 Cyclist aged less than 10 Cyclist aged 20-29 Cyclist aged 30-39 Crash group Heavy vehicle group Light vehicle, cyclist aged 50 or less group Light vehicle, cyclist age over 50 group Full data
Heavy vehicle to cyclist crash Estimate Standard error 0.6443 0.3423 0.3267 0.1634 Light vehicle to cyclist aged less than 50 Estimate Standard error 0.1776 0.0639 0.2209 0.0752 0.1837 0.0840 Light vehicle to cyclist aged 50 or greater Estimate Standard error 0.3648 0.1802 0.2393 0.1269 Full data Estimate Standard error 0.2204 0.0971 0.7211 0.1446 0.6538 0.136 1.527 0.3636 0.2396 0.0858 -1.0136 0.0964 -1.0735 0.1063 -0.6016 0.1086 Score test for the equal slope assumption Chi-square 4.0634 2.8381 7.2503 75.806
light vehicle and cyclists aged 50 or greater (senior cyclists), only road geometric factors were found to significantly increase the likelihood of cyclist injuries. Right-curving and down-grade road sections were found to similarly increase the likelihood of cyclist injuries. In these sections, down-grade vehicle speed in particular is likely to be faster, and road geometries with horizontal curves are comparatively challenging, which implies that drivers need more perception-reaction time. Correspondingly, the finding for this crash group implies that speeding prohibitions should be implemented, especially in curving or downhill road sections. Senior cyclists also tend to react slowly under this circumstance, and injuries to senior cyclists can be particularly severe. The results of Kim et al. (2007) are consistent with the results of this study. Their study showed that cyclists aged 55 or greater are more likely to be fatally injured when they are in bicycle-motor vehicle accidents than are younger age groups. Their study suggested that the senior cyclist group has insufficient perception and reaction ability compared with younger cyclists. Another study similarly stated that older adults’ physical fragility due to aging and various medical treatments can increase the probability of fatal and severe injuries in bicycle-involved crashes (Maring and van Schagen, 1990). Considering the resultant finding and previous studies, protective safety facilities to separate senior Vol. 00, No. 0 / 000 0000
Wald Chi-Square 3.5432 0.0456
Pr >Chi sq 0.0498 0.0456
Wald Chi-Square 7.7280 8.6299 4.7819
Pr >Chi sq 0.0054 0.0033 0.0288
Wald Chi-Square 4.0990 3.5541
Pr >Chi sq 0.0429 0.0594
Wald Chi-Square 5.1509 24.8656 23.1213 17.633 7.7932 110.6541 101.9271 30.6668
Pr >Chi-sq 0.0232