INTEGRATION OF TWO METHODS TO DETECT AIRCRAFT NOISE EVENTS Ismael Gómez1, Alejandro Osses2,3, Max Glisser1, Claudio Albornoz1, Ricardo Guzmán4, and Christian Gerard1 1
Department of Engineering, Gerard Ing. Acústica SpA., Control Acústico, 7770563 Ñuñoa, Santiago, Chile. 2 3
Laboratory of Acoustics, Acustical S.A., 7770563, Ñuñoa, Santiago, Chile.
Research Group ExpORL, Department of Neurosciences, KU Leuven, B3000 Leuven, Belgium.
4
Directorate of Aerodromes and Aeronautical Services DASA, Directorate General for Civil Aviation DGAC, 9020588, Pudahuel, Santiago, Chile
ABSTRACT This paper addresses the use of a hybrid algorithm for detecting aircraft noise events using noise data. The algorithm uses two complementary methods. The first method considers the temporal history of typical acoustic descriptors while exceeding specific thresholds. In the other hand, the second method uses Artificial Neural Networks to discriminate whether the detected noise event actually correspond to an aircraft operation. The methods were validated using real data from continuous noise monitoring measurements in the vicinity of the Santiago International Airport SCEL, in Chile.
1. INTRODUCTION Due to the high noise impact caused by aircraft operations in the vicinity of airports, long-term noise monitoring procedures are addressed in several regulations and technical standards, establishing guidelines and minimum requirements regarding the measurement equipment, the selection monitoring points, the content and frequency of the monitoring system reports, among other things. To calculate noise levels from an airport at a particular receiver, with the objective of evaluating the impact they have, it is essential to have a high precision system for continuous noise monitoring. With the goal to develop an alternative method capable to obtain a high performance on the detection of aircraft noise events, this study presents the use of an algorithm that integrates two methods. The results are compared to the information contained in the official flight logs of the Santiago International Airport (SCEL). The measurements were conduced at a point located in a residential area 12 km to the south of the airport.
1
[email protected]
1
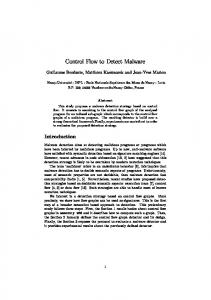
2. THEORY AND METHODS 2.1 ACOUSTIC DESCRIPTORS The use of specific acoustic descriptors allows the identification, definition and classification of noise sources. Considering this, the measured descriptors were the Equivalent Continuous Noise Level L EQ in dB(A), dB(C) and dB(Z); Maximum Sound Pressure Level L max Slow in dB(A), dB(C) and dB(Z), and the Peak Sound Pressure Level Lpeak in dB(A) and dB(Z). In addition, one-third Octave Band values between 50 and 10 kHz in dB(Z) were considered. This frequency range is often used to analyse aircraft noise sources [1]. Furthermore, the Sound Exposure Level SEL in dB(A) was assessed and used as well. The mentioned descriptors combined with their respective durations in seconds completed a total of 65 parameters that were used as inputs to a feed-forward Artificial Neural Network. 2.2 MONITORING POINT The noise monitoring point is called “Huentelenfú” and it is located in the neighbourhood of Maipú 12 Km. to the south of the Santiago International Airport SCEL, as presented in Figure 1.
Figure 1 – Location of the noise monitoring point The noise monitoring terminal (NMT) consists of a weatherproof microphone unit B&K type 4184 with its respective windshield and anti-bird spikes mounted on a robust pole in a residential area. The microphone unit is positioned at a height of six (6) meters on the ground. . For this study, it was used noise data registered during three (3) days of continuous measurement, between December 23 th and 25 th, 2012. 2.3 REFERENCE METHOD: FLIGHT LOGS In order to quantify the effectiveness of the methods proposed along this study, the obtained results were compared with the official flight logs during the observed days. For the data analysis military and civilian operations were omitted [1]. The civilian operations consisted mainly of small aircraft and helicopter operations. In addition, only take-off operations on thresholds 17L and 17R were taken into account. This condition considers all the operations carried out in the direction north-south as presented in Figure 2. A summary of the number of operations registered in the official flight logs during the observed period is shown in Table 1. The observed fleet consisted of Airbus (67.6%), Boeing (30.2%), Embraer (1.5%) and McDonnell Douglas aircraft (0.7%), where the model Airbus A320-200 presented the largest number of events
2
with a 46.7% of the total. Table 1 – Details of the number of events and their distribution per day Analysed day (yyyy.mm.dd)
Total
Description
Su 2012.12.23
Mo 2012.12.24
Tu 2012.12.25
N° of events
167
141
150
458
Percentages
36.5%
30.8%
32.8%
100%
Figure 2 – Direction of departures from the runways 17L and 17R. 2.4 NOISE EVENT DETECTION METHOD This method considers a multiple threshold-triggering to detect noise events. For doing this, the variability of the acoustic descriptors is evaluated over the time by means of the changing rate between a current value a(t) and the hth previous sample, a(t-h), this relation is defined by Equation 1.
a(t ) a(t ) a(t h) t h
(1)
Where h is in seconds and a(t) is an acoustic descriptor. For this work, a(t) is the L EQ, 1s , in dB(A). This means that a noise event will be detected only if its duration is longer than h seconds [3]. For detecting an event, a first order IIR filter defined by a smoothing coefficient [4] has to be applied to the derivative of the noise levels and then by using 3 thresholds (T h, TL1 and T L2,) the start and the end of the event can be defined, as shown in the as shown in the example of the Figure 3. The parameters T h , T L1 and T L2, depends on the acoustic descriptor in use and the nature of the event. In this study, to determine the threshold values an empirical calibration process was done. The h value was obtained considering the parameter t10 [5], which is explained in section 2.4.1.
3
Figure 3 – Noise event detected by using a multi-threshold triggering method. Pictures taken from [3]. 2.4.1 DETERMINING THE T10 VALUE The t10 is defined as the time at which the instantaneous level of a given event is not less than 10 dB of its maximum level. The value is obtained using the flyover speed, flyover altitude and the distances before, during and after the monitoring point (between s and 3 times s) as sketched in Figure 4. Considering the distance between the take-off thresholds 17L and 17 R and the noise monitoring point corresponding to 12,719 and 13,292 metres respectively and knowing the altitudes (between 1,100 and 1,800 metres) as well as the average speed of the flyovers operations (between 435 and 520 km/h), it was possible to assess the average time duration for aircraft noise events. This average time duration took into account the airplanes with the highest number of annual operations at the SCEL Airport [8]. In this way, the obtained t10 values were between 52 and 57 seconds, thus the average value of 55 seconds was used as an estimate of the h constant required by the detection method. Both the altitude and speed information were taken from the INM database 2
2
Integrated Noise Model (INM) U.S. Federal Aviation Administration version 7.0c of December 2011.
4
Figure 4 – Example of a flight path showing the direction of the wave fronts reaching the monitoring site located at point 2. Figure taken from [5]. 2.5 AIRCRAFT / NON-AIRCRAFT DECISION An artificial neural network (ANN) was implemented as a second decision criterion either to confirm or to reject the first decision made by the noise detection algorithm. The capability of the ANN’s to learn how to relate input-output values by storing a set of numeric values gives the possibility to add many simultaneous parameters and therefore to give more arguments to make a final decision. 2.5.1 ARTIFICIAL NEURAL NETWORKS The base of an artificial neural network (ANN) lies in the emulation of the processing carried out by human neurones to learn how to relate a input parameters to the expected responses allowing a further extrapolation of this experience. The learning process of an ANN is codified into several numeric vectors and functions related to each artificial neuron, generally combined considering simple arithmetic operations (sums and products) [6]. 2.5.2 FEED FORWARD ANN A feed forward artificial neural network (FF ANN) corresponds to a topology in which the neuron connections are always between contiguous layers. For this study, several configurations of 4-layer FF ANN were evaluated. The first or input layer handled the 65 input parameters to the second and third layer (hidden layers). The second and third layers used both sigmoid activation functions and they consisted of N and M neurons, respectively, were N and M are parameters found during the training process. The fourth layer had 1 output neuron with a threshold activation function obtaining an Artificial Neural Network for classification ends, where the binary output indicates whether an aircraft noise event was detected or not, as shown in Figure 6. To train the net was used an optimisation algorithm to obtain the number N and M of neurones in each hidden layer. This way is possible to find the optimal configuration of the net which allows obtaining the best results. Was used the MATLAB ® Neuronal Network Toolbox to work with the ANN, considering the training function Scaled Conjugated Gradient, recommended for classification problems [7], and its different tools to evaluate the obtained performance. 2.6 DATA PROCESSING The data were divided into 2 groups. The 67.2% of the data, corresponding to the days 1 and 2 (2012.12.23-24) were used both to calibrate the detection method and for training the Artificial Neural Network. The remaining 32.8% of the data were used for evaluating the performance of both methods, not only as complementary but also as individual methods. All the processes were carried out using an algorithm developed in software MATLAB ®. This algorithm contains different scripts each one with a specific function, for example to load data, to apply the detection method, to train and to use the ANN, to compare the results with the information from flights log, etc. This way the results and its respective effectiveness are obtained automatically.
5
Figure 5 – Topology and configuration of the ANN used in the noise event detection method.
3. RESULTS AND ANALYSIS 3.1 DETECTION PROCESS Based on the average event duration t10 , the obtained h value was 55 seconds, which was used to differentiate the measured L EQ, 1s , in dB(A). The obtained detection thresholds after the calibration process for each hour are shown in Table 2. Table 2 – Detection thresholds per hour Period (hh.mm) Thresholds [dB / s] Period (hh.mm) Thresholds [dB / s] Start – End Th T L1 T L2 Start – End Th T L1 T L2 00.00 – 00.59 0.18 -0.19 -0.18 12.00 – 12.59 0.08 -0.05 -0.04 01.00 – 01.59
0.13
-0.07
-0.06
13.00 – 13.59
0.08
-0.07
-0.06
02.00 – 02.59
0.14
-0.15
-0.14
14.00 – 14:59
0.08
-0.04
-0.03
03.00 – 03.59
0.18
-0.22
-0.21
15.00 – 15.59
0.07
-0.04
-0.03
04.00 – 04.59
0.13
-0.14
-0.13
16.00 – 16.59
0.09
-0.06
-0.05
05.00 – 05.59
0.19
-0.16
-0.15
17.00 – 17.59
0.09
-0.06
-0.05
06.00 – 06.59
0.09
-0.09
-0.08
18.00 – 18.59
0.05
-0.06
-0.05
07.00 – 07.59
0.08
-0.04
-0.03
19.00 – 19.59
0.06
-0.04
-0.03
08.00 – 08.59
0.11
-0.02
-0.01
20.00 – 20.59
0.06
-0.04
-0.03
09.00 – 09.59
0.10
-0.05
-0.04
21.00 – 21.59
0.12
-0.08
-0.07
10.00 – 10.59
0.09
-0.08
-0.07
22.00 – 22.59
0.07
-0.04
-0.03
11.00 – 11.59
0.09
-0.08
-0.07
23.00 – 23.59
0.11
-0.14
-0.13
Variations on the detection thresholds were found as a function of the time. These values are presented in Table 2. The main factor affecting the thresholds is the background noise which presents itself a high sensitivity to the daytime. In Table 3, the results of the detection method from the processes of calibration and testing are presented. Table 3 – Summary of results of the noise event detection method N° of flights
Correct
% Correct
False
% False
log events
Detection
Detection
Positives
Positives
Calibration (data days 1-2)
308
280
91 %
114
37 %
Test (data day 3)
150
132
88 %
68
45 %
Process
6
The efficiency obtained after the calibration of the thresholds is presented in Table 3, corresponding to a 91% of correct detections and a 37% of false positives. Moreover, for the testing process the percentage of correct detections decreased to 88% and, therefore, false positives increased by 8%. An example showing the event detection process is shown in Figure 6. In the Figure, the red lines represent the automatic noise event detection. On the other hand, the black dotted lines correspond to each actual aircraft noise event according to the flight logs. This information was used for the further comparisons. 70
Leq in dB(A)
60
50
40
Unprocessed LAeq signal LAmax of event detected Flights log information
30
20
0
5
10
15
20
25
30
Times in Minutes
35
40
45
50
55
60
Figure 6 – Detection of aircraft noise event for the period between 01:00 and 01:59 on 2012.12.24. 3.2 ARTIFICIAL NEURAL NETWORKS: TRAINING AND VALIDATION As mentioned in section 2.5.2, a feed forward FF ANN was used to reduce the number of false positives after the first aircraft detection. The numbers N and M of neurons for the second and third (hidden) layers of the FF ANN were randomised and trained using the data measured on days N° 1 and 2. Data measured on days 1 and 2 will be referred as training data. The configuration presenting the best performance using the training data consisted of 65-68-103-1 neurones, i.e., N and M were found as 68 and 103 respectively. In practice, this error corresponded to 18 out of 200 noise events wrongly classified by the network, where 15 events were missed take-off operations and 3 events were false positives. Therefore, the performance of the algorithm appending the ANN applied to the training data can be seen as a 91 % of succeeded detections. On the other hand, when applying the same criterion with the test data (see Table 4), while using the ANN is possible to reduce considerably the error associated to false positives presented on the first detection phase, decreasing from 68 events to just 5, which in percentage is equivalent to a reduction of 42%. However, this has an effectiveness cost on detection of real events of aircrafts according to the flight log because the ANN dismisses erroneously 13 events, decreasing the effectiveness in 9% from an 88% to a 79%.
7
Table 4 - Results of the noise event detection method before and after the use of the ANN. The data measured on day 3 (Tuesday 2012.12.25) was used. N° of flight
Correct
% Correct
False
% False
log events
Detection
Detection
Positives
Positives
Test Detection
150
132
88 %
68
45 %
Test Detection + ANN
150
119
79 %
5
3%
Process
4. FURTHER WORK An important part of the processing presented in the paper involved manual tasks . In order to enlarge the scope of this method to other noise monitoring points and further to other types of noise sources either a partial or total automation of the optimal detection thresholds would be desirable. To perform an analysis of sensitivity to the 65 input parameters fed into the ANN to mini mise, in this way, the amount of information required by the network to obtain similar results to those presented along this paper.
5. CONCLUSIONS For the current study, noise data measured for three days at a point located 12 km away the SCEL Airport in Santiago were taken into account. During the observed period, 458 noise events corresponding to take-off (on thresholds 17L and 17R) which were analysed compared to official data. For the analysis two methods were merged for an automatic detection of aircraft noise events. First a multi-threshold algorithm was used to identify the potential aircraft noise events and then a second method was used to reduce the number of false positives based on different parameters. Considering the 32 measured acoustic descriptors, another 33 parameters were calculated and all of them were used to feed in an artificial neural network. Part of the noise data was used to train the network for recognising typical and non-typical patterns related to aircraft noise events. For the first method 4 parameters were needed: the time interval h in seconds and 3 other numeric thresholds. The time interval h used to differentiate the L EQ was calculated considering the parameter t10 defined in ISO 20906:2009. In this way, it was possible to determine h in function of the altitude, distance and velocity of the aircraft operation. The assessment of the 3 thresholds was determined in periods of one hour to take into account the high variability of the background noise. The integration of the 2 methods led to a performance characterised by a 79% of real aircraft noises and a 3% of false positives. To consider background noise variations at the monitoring point according to the time of the day, the optimum detection thresholds were assessed in intervals of one hour, finding great variability of optimal thresholds. The assessment of the thresholds per hour improved the performance of the algorithm. The low percentage of false positives obtained was due to the high effectiveness of the ANN used, which allows discarding great part of the erroneous information delivered by the initial detection method. However, the previous has a cost on the effectiveness of detecting real events of aircrafts, which decreases in a 9%.
ACKNOWLEDGEMENTS The authors would like to acknowledge the support given by the Chilean Directorate General for Civil Aviation (DGAC) for the access to the Noise Monitoring Terminals and to the official flight logs. This research was granted by the companies Control Acústico and Acustical, making possible the publication of this paper.
8
REFERENCES [1] Federal Aviation Regulation, FAR 150 – Airport noise compatibility planning. [2] Airbus, “Flight Operations Support & Line Assistance – Getting to grips with aircraft noise”, Chap. 10.3 Analyzers. (December 2003). [3] Wright, Richard A., Goulamhoussen Guillaume, “Improvements in source identification from unattended sound level measurements using threshold-triggered audio recording” (Inter-Noise 2010). [4] Osses, A., Glisser, M., Gerard, C., Guzmán, R. “Comparison of methodologies for continuous noise monitoring and aircraft detection in the vicinity of airports” (18th International Congress on Sound & Vibration ICSV, Río de Janeiro 2011). [5] International Organization for Standardization, ISO 20906:2009 “Unattended monitoring of aircraft sound in the vicinity of airports”. [6] Osses, A., Gómez I., Glisser, M., Gerard, C., Guzmán, R., “Noise Classification of Aircrafts using Artificial Neural Networks” (SAE BRASIL, International Noise & Vibration Colloquium 2012). [7] M. Hudson Beale, Martin T. Hagan, Howard B. Demuth, “MATLAB® Neuronal Network Toolbox – User’s Guide” (R2012a). [8] Control Acústico. “Comprehensive study of the noise component of the SCEL Airport, Noise Modelling for the forecasting years 2011, 2016, 2021, 2026”. 2011 (In Spanish)
9