REPORTS 15.
16. 17. 18.
19.
20.
21.
22.
23.
24. 25. 26. 27. 28. 29. 30. 31. 32.
sternum, and lower jaw aplasia were also commonly seen. W. F. Lever and G. S. Lever, Histopathology of the Skin (Lippincott, Philadelphia, 1990); S. Miller, J. Am. Acad. Dermatol. 24, 1 (1991). A. C. Markey, E. B. Lane, D. M. MacDonald, I. M. Leigh, Br. J. Dermatol. 126, 154 (1992). A. Stoler, R. Kopan, M. Duvic, E. Fuchs, J. Cell. Biol. 107, 427 (1988). J. Stanley, J. Beckwith, R. Fuller, S. Katz, Cancer 50, 1486 (1982); P. Savoia, L. Trusolino, E. Pepino, O. Cremona, P. Marchisio, J. Invest. Dermatol. 101, 352 (1993); Z. Lazarova, N. Domloge-Hultsch, K. Yancey, Exp. Dermatol. 4, 121 (1995); J. Fairley, P. Heintz, M. Neuburg, L. Diaz, G. Giudice, Br. J. Dermatol. 133, 385 (1995). M. Cooper and H. Pinkus, Cancer Res. 37, 2544 (1977); R. E. Grimwood et al., Cancer 56, 519 (1985); G. Stamp, A. Quaba, A. Braithwaite, N. A. Wright, J. Pathol. 156, 213 (1988); S. Hales, G. Stamp, M. Evans, K. Fleming, Br. J. Dermatol. 120, 351 (1989). We performed mouse skin grafts as in (27 ), except that we used transgenic or wild-type dorsal trunk skin from B6CBF2 embryos that had been dissected away from underlying muscle and grafted it onto 8to 12-week-old male scid recipient mice. Dressings were removed after 3 weeks. Each animal was photographed weekly. Genomic sequences containing SHH were isolated from a bacterial artificial chromosome library obtained from Research Genetics. Primers used to screen this library from exon 2 [ACC GAG GGC TGG GAC GAA GAT GGC and GCG AGC CAG CAT GCC GTA CT T GCT G (28)] identified BAC 270A17, which was digested with restriction enzymes and ligated with vectorette linkers (29). Exon-intron boundaries for the three exons were determined by sequencing polymerase chain reaction (PCR) products amplified using the universal vectorette primer and SHH cDNA primers selected from published sequences. Since we were unable to obtain sequences from the exon 2–intron 3’ boundary, a primer from the 39 end of exon 2 was used. Primers used to amplify genomic SHH were as follows: exon 1, CCG CCG CGC GCA CTC G and AAG GAG CGG GTG AAA TCA CC; exon 2, TAA CGT GTC CGT CGG TGG G and TGC T T T CAC CGA GCA GTG G; and exon 3, CCT CCT CCC CGA GAC GC and GGC CCC CTC CCG CGC C. Mutations were identified by single-strand conformation polymorphism (SSCP) analysis of PCR products amplified from genomic DNA. The PCR products were sequenced on both strands directly from the PCR-produced templates and after cloning into Bluescript. Subsequent to our completion of this work, another group has published intron sequences and primers useful for amplifying SHH exons from genomic DNA (26). DNA from one other BCC had a methionine to isoleucine change at position 115, but this change was also present in DNA from the patient’s blood. This unusually large BCC was diagnosed at age 40 in a patient with no other phenotypic abnormalities suggestive of BCNS. K. F. Liem, G. Tremmi, H. Roelink, T. M. Jessell, Cell 82, 969 (1995); H. Roelink et al., ibid. 81, 445 (1995); C. Tabin, ibid. 80, 671 (1995); M. J. Cohn and C. Tickle, Trends Genet. 12, 253 (1996). S. Ting-Berreth and C. Chuong, Dev. Dyn. 207, 157 (1996). J. Arbeit, Cancer Surv. 26, 7 (1996). E. Belloni et al., Nature Genet. 14, 353 (1996); E. Roessler et al., ibid., p. 357. D. Medalie, J. Invest. Dermatol. 107, 121 (1996). V. Marigo et al., Genomics 28, 44 (1995). J. Riley et al., Nucleic Acid Res. 18, 2887 (1990). Y. Echelard et al., Cell 75, 1417 (1993). L. Goodrich, R. Johnson, L. Milenkovic, J. A. McMahon, M. Scott, Genes Dev. 10, 301 (1996). In situ hybridization studies were performed on mouse embryonic skin with the use of antisense and sense control probes and standard techniques. The Shh template (30) was a mouse Shh partial cDNA missing 300 bp of the 39 coding region. The ptc template was M2-3, an 841-bp cDNA fragment from the 59 end of the coding region (31).
33. T. Lufkin et al., Nature 359, 835 (1992). 34. L. Guo, Q.-C. Yu, E. Fuchs, EMBO J. 12, 973 (1993). 35. We thank H. Fan and P. Khavari for instruction in skin grafting techniques and the Scott lab, D. Kingsley, A. McMahon, E. Fuchs, B. Smoller, A. Rothman, J. Xie, and C. Tabin for clones and advice. We thank D. Roop (K14), Z. Liu (BPAG2), J. P. Ortonne (Lam5), and S. Yuspa (K6) for antibodies. A.E.O. was supported by a grant from the National Institute for Ar-
thritis and Musculoskeletal Diseases. Research in San Francisco was supported by NIH grant AR39959. M.P.S. is an Investigator of the Howard Hughes Medical Institute and this research was done with the Institute’s support. Human and mouse work was done according to NIH Human Subjects and Animal Use Guidelines at each institution. 22 January 1997; accepted 3 March 1997
Integration of What and Where in the Primate Prefrontal Cortex S. Chenchal Rao, Gregor Rainer, Earl K. Miller* The visual system separates processing of an object’s form and color (“what”) from its spatial location (“where”). In order to direct action to objects, the identity and location of those objects must somehow be integrated. To examine whether this process occurs within the prefrontal (PF) cortex, the activity of 195 PF neurons was recorded during a task that engaged both what and where working memory. Some neurons showed either object-tuned (what) or location-tuned (where) delay activity. However, over half (52 percent, or 64/123) of the PF neurons with delay activity showed both what and where tuning. These neurons may contribute to the linking of object information with the spatial information needed to guide behavior.
Anatomical segregation of processing is an important principle of neural organization. Even within a modality, largely separate pathways process different attributes of the same stimulus. Perhaps the best explored example of segregation is in the visual system, where the analysis of visual scenes is carried out by at least two pathways. A “ventral pathway” through inferior temporal (IT) cortex processes information about features that identify objects, such as shape and color (object, or “what” information), and a “dorsal pathway” through posterior parietal (PP) cortex processes information about location and spatial relations among objects (spatial, or “where” information) (1). This example raises the question of where and how information about object identity is integrated with information about object location. One region that may play a role in integration is the prefrontal (PF) cortex, which receives inputs from virtually all of the brain’s sensory systems (2) and has long been thought to be an area where diverse signals are integrated to serve higher order cognitive functions. A major contribution of the PF cortex to cognition is the active maintenance of behaviorally relevant information “online,” a process known as working memory (3). Working memory is typically studied in tasks in which an animal must remember a cue stimulus over a delay period and then Department of Brain and Cognitive Sciences and The Center for Learning and Memory, Massachusetts Institute of Technology, Cambridge, MA 02139, USA. * To whom correspondence should be addressed. E-mail:
[email protected]
www.sciencemag.org
make a behavioral response based on the cue. Physiological studies in monkeys have revealed that many PF neurons are highly active during the delay of such tasks (4). The activity is often cue-specific, suggesting that this “delay activity” is the neural correlate of the working memory trace. Given its central role in cognition, PF neurons that contribute to working memory are obvious candidates for integrating diverse signals. However, the extent to which different types of information, such as what and where, are integrated within the PF cortex is not well understood. Highly processed spatial information from the PP cortex and object information from the IT cortex are received by separate regions of the PF cortex, the dorsolateral (areas 46 and 9) and the ventrolateral (area 12) PF cortex, respectively (5), but there are interconnections between these regions that could bring what and where together (2, 6). Physiological studies have found that different neurons and even different regions of the PF cortex convey either object information (in the ventrolateral PF cortex) or spatial information (in the dorsolateral PF cortex), but no neurons have been reported to convey both (7). In previous studies, however, working memory for what and where was examined in two separate tasks: an object task and a spatial task. This separation rarely occurs in the real world and it raises the possibility that the apparent segregation of what and where working memory reflected an artificial behavioral segregation. Thus, to investigate whether object and spatial information is integrated by in-
z SCIENCE z VOL. 276 z 2 MAY 1997
821
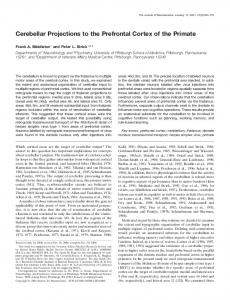
Fig. 1. A typical behavioral trial. The correct behavioral response, a saccadic eye movement to the remembered location of the matching object, is indicated by the arrow. The order of presentation is from the upper left to the lower right.
dividual PF neurons, we employed a task in which what and where are used together. On each trial (Fig. 1), while the monkey maintained fixation of a fixation spot, a sample object was briefly presented at the center of gaze. After a delay, two test objects were briefly presented at two of four possible extrafoveal locations. One of the test objects matched the sample, the other was a nonmatch. After another delay, the monkey had to make a saccade to the remembered location of the match. Thus, this task required that the monkey, within a trial, link what with where. It had to remember the object’s identity over the first delay (the what delay), use that information to find the match, and then remember its location over the second delay (the where delay) (8). We recorded the activity of 195 neurons from the lateral PF cortex of two monkeys (9). Many of the neurons were activated during the delay intervals. To discern whether the level of delay activity was related to the information retained in memory, we performed analyses of variance (ANOVAs) on each neuron separately (10). The sample object was the factor for a one-way ANOVA on activity from the what delay (OBJECT factor). The cued location (LOCATION factor) and object used to cue it (OBJECT factor) were used for a two-way ANOVA applied to the where delay activity. On the basis of the ANOVAs (evaluated at P , 0.01), 64% of the neurons (123/195) showed delay activity that varied depending on either the object or location, or both. Some PF neurons (8/123, or 7%) showed delay activity that was significantly tuned to the sample object only. During the what delay while the monkey viewed a blank screen and held the sample object in working memory, these neurons were highly active, with different sample objects evoking different levels of activity (OBJECT factor, P , 0.01). By contrast, during the where delay while the monkey had to hold loca822
tion information in working memory, none of these cells were selective for the cued location (LOCATION factor, P . 0.01) or for the sample object (OBJECT factor, P . 0.01). For example, the neuron shown in Fig. 2A showed significant sample object– tuned activity during the what delay. During the where delay when the task demands shifted to retaining location information, the neuron’s activity decreased relative to its level of activity during the what delay. We termed these neurons “what” cells. They appear to be specialized for object working memory. Other neurons (51/123, or 41%) were not selective for the sample object during the what delay (OBJECT factor, P . 0.01) but showed significant tuning for locations during the where delay (LOCATION factor, P , 0.01). For nearly all of these neurons (48/51, or 94%), object information had no effect on the where delay activity (OBJECT factor, P . 0.01, LOCATION X OBJECT interaction, P . 0.01). For example, the neuron shown in Fig. 2B exhibited relatively little activity until a location was cued by the matching object. Then, during the where delay, this neuron was highly active, with different locations eliciting significantly different levels of activity. We termed these neurons “where” cells because they appear to be specialized for spatial working memory (11). Over half of the PF neurons with delay activity (64/123, or 52%) were not specialized but rather appeared to contribute to both object and spatial working memory. Their what delay activity varied significantly with the object used as the sample (OBJECT factor, P , 0.01), and their where delay activity varied significantly with which location was cued (LOCATION factor, P , 0.01) (Fig. 3A). They were highly selective for both objects and locations. On average, there was a 64% increase in what delay activity after a good (preferred) sample object over the activity after a poor (nonpreferred) sample object and a 71%
SCIENCE
Fig. 2. Responses of single PF neurons showing either object-tuned (A) or location-tuned (B) delay activity. The small horizontal line on the left of each histogram indicates the time of the sample object presentation, and the line in the middle indicates presentation of the test objects. “Good object” and “poor object” refer to the objects used as samples. “Good location” and “poor location” refer to the locations cued by the matching object. “Good” or “poor” refer to the object or location that elicited the most or least activity, respectively. Bin width, 20 ms.
increase in where delay activity after cueing of a good location over the activity after a poor location. Thus, these “what-andwhere” cells conveyed object and spatial information during different epochs of the same behavioral trial and appeared to contribute to both object and spatial working memory. What cells, where cells, and whatand-where cells were distributed equally between the dorsolateral PF cortex and the ventrolateral PF cortex (12). Because we cued each location with an object, location-tuned activity could have conveyed either location information alone or information about both the location and the matching object that cued it. We found examples of both. The two-way ANOVA revealed that a little over half of the whatand-where cells (36/64, or 57%) showed location tuning in the where delay that was unaffected by the match object (LOCATION factor, P , 0.01, OBJECT factor, P . 0.01; LOCATION X OBJECT interaction, P . 0.01); that is, the level of activity for a given location was the same regardless of which object cued it. We also conducted, for each neuron, a discriminant analysis on the activity from the where delay to measure the amount of information carried about the cued location and the matching object. The discriminant analysis
z VOL. 276 z 2 MAY 1997 z www.sciencemag.org
REPORTS Fig. 3. (A) Response of a single PF neuron showing objecttuned activity in the what delay and location-tuned activity in the where delay. (B) Object and location information. Average histogram of the 28 what-andwhere cells for which both location and object significantly affected where delay activity (on the basis of an ANOVA; see text). Cueing a good location with a good object elicited more activity than cueing a good location with a poor object. However, a poor location elicited less activity than a good location, regardless of which object cued it. See Fig. 2 for conventions.
attempted to classify, on the basis of a neuron’s firing rate on each trial, which one of the four locations was cued or which one of the four objects was the match (13). Because four objects and four locations were used, chance performance for each classification was 25%. For these neurons, the mean successful classification rate for locations on the basis of where delay activity was 33.3%, which was significantly greater than chance (t test, P , 0.001) (14). By contrast, the mean classification rate for objects on the basis of where delay activity, 25.6%, was not significantly different from chance (P 5 0.206). Thus, after having conveyed object information in the what delay, these neurons “switched modes” and conveyed only location information in the where delay. This transformation mirrors the demands of the behavioral task. For the remaining what-and-where cells (28/64, or 44%), both object and location information significantly affected the where delay activity (LOCATION factor, P , 0.01; OBJECT factor, P , 0.01, or LOCATION X OBJECT interaction, P , 0.01). The predominantly location-tuned activity was further modulated by the object that cued the location. For a given location, the where delay activity was higher if a good object cued it than if a poor object cued it (Fig. 3B). For these neurons, the mean classification rate for locations on the basis of where delay activity was 34.2%, whereas the classification rate for objects, 28.3%, was smaller, but significantly above chance (both different from chance, P , 0.001) (15). Thus, the where delay activity of these neurons reflected both the cued location and the object that appeared in it, that is, integrated what and where information. Recent studies have emphasized a segregation of object and spatial information processing in both the visual cortex and the prefrontal cortex. The results of the present study indicate that when object and location information are used together (as is typically the case in the real world), information about these attributes converges in the PF cortex. Indeed, the results support the notion that a
function of the PF cortex is to integrate disparate information (16). What and where signals could be integrated through interconnections between dorsolateral and ventrolateral PF cortices (2, 6), through converging projections from the parietal and temporal cortex on the frontal cortex (17), through cross-talk in the visual cortex (18), or through a combination of these pathways. In any case, single PF neurons that process both what and where signals may contribute to the linking together of object information with the spatial information needed to direct action. They may also help synthesize a unified representation of objects in their places. Indeed, the activity of many neurons simultaneously reflected a location and the object that appeared in it. They may play a role in integrating what and where in working memory. Finally, the fact that the properties of many of the delay neurons mirrored the requirements of the task (they conveyed first object, then location, information) suggests that the PF cortex is “tuned” by behavioral demands (19). Functional topography of sensory cortical areas changes with experience (20). It may be that the PF cortex, which plays a central role in the flexible guidance of behavior, exhibits extensive functional plasticity. Thus, the PF cortex may be highly modifiable, its representations changing to meet the demands placed on it. REFERENCES AND NOTES ___________________________ 1. Reviewed in L. G. Ungerleider and M. Mishkin, in Analysis of Visual Behavior, M. A.Goodale and R. J. W. Mansfield, Eds. (MIT Press, Cambridge, MA, 1982), pp. 549 –586; J. H. R. Maunsell and W. T. Newsome, Annu. Rev. Neurosci. 10, 363 (1987). 2. D. N. Pandya and C. L. Barnes, in The Frontal Lobes Revisited, E. Perecman, Ed. (IRBN, New York, 1987), pp. 41–72. 3. A. Baddeley, Working Memory (Clarendon, Oxford, 1986). 4. J. M. Fuster and G. E. Alexander, Science 173, 652 (1971); K. Kubota and H. Niki, J. Neurophysiol. 34, 337 (1971); J. M. Fuster, ibid. 36, 61 (1973); S. Funahashi, C. J. Bruce, P. S. Goldman-Rakic, ibid. 61, 331 (1989); E. K. Miller, C. A. Erickson, R. Desimone, J. Neurosci. 16, 5154 (1996). 5. M. Petrides and D. N. Pandya, J. Comp. Neurol. 228, 105 (1984); L. G. Ungerleider, D. Gaffan, V. S. Pelak, Exp. Brain Res. 76, 473 (1989). 6. H. Barbas and D. N. Pandya, J. Comp. Neurol. 286,
www.sciencemag.org
353 (1989). 7. J. M. Fuster, R. H. Bauer, J. P. Jervey, Exp. Neurol. 77, 679 (1982); F. A. W. Wilson, S. P. O Scalaidhe, P. S. Goldman-Rakic, Science 260, 1955 (1993); S. M. Courtney, L. G. Ungerleider, J. V. Haxby, Cerebral Cortex 6, 39 (1996). 8. Eye position was monitored by means of the scleral search coil method [D. A. Robinson, IEEE Trans. Biomed. Eng. 10, 137 (1963)]. The sample and test objects were presented for 400 ms, and the delays were 1000 ms. The monkeys (Macaca fasicularis and Macaca mulatta) were required to maintain fixation of a central spot throughout the trial. At the end of the where delay, the fixation spot was extinguished and small (0.3°) spots appeared simultaneously at each of the four locations used in this task (Fig. 1). This was the monkey’s “go” signal. It then had to make a direct saccade to the spot that was at the location where the match had appeared. The four locations were on the horizontal and vertical meridians, 4° above, below, to the right, and to the left of fixation. The four objects were color pictures of “real world” objects 2° by 2° in size. Each object was used as a sample or match on some trials and as a nonmatch on other trials, and each object was used to cue each location. With this design, what and where are linked within a single trial, but across trials they are varied independently (that is, no object is exclusively linked with a location). The same four objects and locations were used throughout the experiment. 9. Recording sites were localized by magnetic resonance imaging. 10. Delay activity was analyzed over the last 800 ms of a 1000-ms delay. We did not include the first portion of the delay, to exclude any responses related to the offset of the preceding stimulus. On average, data from about 600 correctly performed trials (about 85% of the total trials) were collected from each cell. 11. We did not distinguish between location-tuned activity related to retaining sensory information about a location and activity related to a “motor set” of the forthcoming saccade. However, previous studies have found that the activity of most of the PF delay neurons is related to retaining sensory rather than motor information [S. Funahashi, M. V. Chafee, P. S. Goldman-Rakic, Nature 365, 753 (1993); G. DiPellegrino and S. P. Wise, J. Neurosci. 13, 1227 (1993)]. 12. We mapped a 12 mm by 12 mm extent of the lateral PF cortex at 1-mm intervals using a grid system (Crist Instruments, Damascus, MD). The recording chamber was centered on the principal sulcus. Its posterior end was 2 mm behind the bow of the arcuate sulcus. The dorsal and ventral recordings extended to about just above and below the superior and inferior arcuate sulci, respectively. The dorsolateral PF cortex lies in and dorsal to the principal sulcus, and the ventrolateral PF cortex lies on the inferior convexity, ventral to the principal sulcus. What cells, where cells, and what-and-where cells were found about equally in the dorsolateral and ventrolateral PF cortex. In the dorsolateral PF cortex, 3 what cells, 25 where cells, and 34 what-andwhere cells were found. In the ventrolateral PF cortex, 5 what cells, 26 where cells, and 30 what-andwhere cells were found. The ANOVAs identified
z SCIENCE z VOL. 276 z 2 MAY 1997
823
highly selective neurons; across the population, selectivity for what and for where varied along a continuum from nonselective neurons to highly selective neurons. 13. To eliminate any optimistic bias in the classification, we performed the discriminant analysis with crossvalidation; that is, the distribution of means for each class was computed on half the data, chosen randomly, and these means were used to classify the objects or locations in the other half of the data. 14. Because the activity of individual neurons is “noisy,” they rarely perform as well as the animal as a whole. By pooling the activity of multiple neurons, it is possible to reduce noise, and a neural classification rate equal to behavioral performance can thus be achieved [for details, see E. K. Miller, L. Li, R. Desimone, J. Neurosci. 13, 1460 (1993)]. 15. Their relatively low classification rate for objects on the basis of where delay activity (28.3%) was not due to the generally poor ability of these neurons at
classifying objects; their mean classification rate for objects on the basis of what delay activity was significantly greater (32.3%, P , 0.001). The lower rate could have been due, in principle, to an effect of the nonmatching object, which was not included in the classification and thus could add “noise.” However, the mean classification rate of a discriminant analysis of the where delay activity that attempted to classify the nonmatching stimulus (24.8%) was not different from chance (P 5 0.680), indicating no effect of the nonmatch on the where delay activity. Thus, the effect of object on the where delay activity appears to be due to the match object alone. 16. See J. M. Fuster, Memory in the Cerebral Cortex (MIT Press, Cambridge, MA, 1995). 17. J. Bullier, J. D. Schall, A. Morel, Behav. Brain Res. 76, 89 (1996). 18. V. P. Ferrera, K. K. Rudolph, J. H. R. Maunsell, J. Neurosci. 14, 6171 (1994); A. B. Sereno and J. H. R. Maun-
TECHNICAL COMMENTS
Delta-Interacting Protein A and the Origin of Hepatitis Delta Antigen Robert Brazas and Don Ganem (1) propose that the cellular protein, delta-interacting protein A (DIPA), interacts with hepatitis delta antigen (HDAg), affecting hepatitis delta virus (HDV) replication. Although their work provides useful information about the biology of HDV, the main conclusion, that DIPA is the cellular homolog of HDAg, is not supported by their data. We have examined the statistical significance of the match between HDAg and DIPA protein sequences by Monte Carlo simulation. In their comparison between HDAg and DIPA protein sequences, Brazas and Ganem reported an identity of 24% and a similarity of 56%, using the GES scale, which considers hydrophobicity when determining the distance matrix for substitutions (2). We compared HDAg with 10,000 randomized DIPA sequences, using the GAP program with the same parameters as Brazas and Ganem (1) (a gap weight of 3.0 and gap length weight of 0.1). The probability distributions for identity match and for similarity values that are determined using the GES scale (1) show that the match between HDAg and DIPA is not significant (Fig. 1A): The probability for an identity match greater than or equal to 24% is 13.2% and the probability for a similarity match greater than or equal to 56% is 14.1%. This does not support the proposed common ancestral relationship between HDAg and DIPA. Furthermore, it is inappropriate to use the GES scale to determine homologous relationships between protein sequences, because convergent evolution could easily affect the hydrophobicity of a protein se824
quence, a relatively simple chemical property. However, the match between HDAg and DIPA is also not significant, with the use of the PAM-250 matrix (data not shown). While various matrices may give different similarity measurements, the identity remains the same given a particular alignment. However, the identity match is a result of a biased amino acid composition. A Monte Carlo simulation comparing HDAg to 10,000 random sequences that
sell, Invest. Opthal. Visual Sci. 36, 692 (1995). 19. A neural network model also suggests that the extent to which what and where are segregated or integrated in the prefrontal cortex depends on task demands [ T. S. Braver and J. D. Cohen, Proc. Cognit. Neurosci. Soc. 2, 95 (1995)]. 20. G. H. Recanzone, M. M. Merzenich, W. M. Jenkins, A. G. Kamil, H. R. Dinse, J. Neurophysiol. 67, 1057 (1992). 21. Animal experiments were conducted in accordance with the MIT Committee on Animal Care. This work was supported by the Pew Charitable Trusts and the McKnight Foundation. We thank M. Histed for help in animal training and W. Asaad, R. Desimone, Y. Munakata, J. Mazer, R. O’Reilly, and M. Wicherski for valuable comments. S.C.R. was supported by a fellowship from the McDonnell-Pew Foundation and the Markey Foundation. 9 December 1996; accepted 5 March 1997
have the average amino acid compositions of an overall protein with the same length of the DIPA protein sequence shows that the observed similarity is again not significant (P 5 18.2%), but the identity match would have been significant (Fig. 1B). Thus the reported “match” is biased by the amino acid compositions of HDAg and DIPA. [We used the amino acid composition derived from the exon database developed from GenBank release 90, where redundant sequences are deleted by a similarity criterion of 20%. For detailed procedures, see (3)]. The three amino acid compositions are listed (Table 1). Both HDAg and DIPA have similarly biased amino acid compositions with overrepresented residues like Glu, Gly, and Arg and underrepresented His, Thr, and Tyr. This will lead to elevated identity matching between the simulated random sequences and HDAg. We conducted a test of the effect of amino acid composition on the identical Table 1. Amino acid compositions of HDAg, DIPA, and the exon database.
Fig. 1. Probability distributions for (A) DIPA sequence randomized and (B) randomization based on average amino acid composition.
SCIENCE
Residues
HDAg
DIPA
Database
Ala Cys Asp Glu Phe Gly His Ile Lys Leu Met Asn Pro Gln Arg Ser Thr Val Trp Tyr
0.0421 0.0047 0.0561 0.1168 0.0280 0.1262 0.0047 0.0327 0.1028 0.0794 0.0093 0.0280 0.0841 0.0327 0.1262 0.0561 0.0234 0.0327 0.0140 0.0000
0.0990 0.0297 0.0446 0.1287 0.0099 0.1238 0.0050 0.0050 0.0198 0.1584 0.0149 0.0198 0.0495 0.0644 0.1188 0.0495 0.0198 0.0248 0.0149 0.0000
0.0683 0.0202 0.0538 0.0648 0.0427 0.0612 0.0235 0.0548 0.0607 0.0886 0.0245 0.0463 0.0529 0.0418 0.0532 0.0796 0.0574 0.0633 0.0118 0.0306
z VOL. 276 z 2 MAY 1997 z www.sciencemag.org