Intellectual Capital Evaluation: Relationship between Knowledge Management Implementation and Company’s Performance Elena Shakina, Anna Bykova State University Higher School of Economics, Perm, Russia
[email protected] [email protected] Abstract Knowledge management is becoming the most relevant and challenging issue of company’s strategy implementation in new economy. One of the most important issues in knowledge management is intellectual capital identification and evaluation.. Our study focuses on the evaluating intellectual capital methods which allow finding out the most efficient way of intellectual capital management, including investment decision making. We suppose that the potential effectiveness of intellectual capital resources varies depending on the company size, industry and country. Most of the relevant researches are based on resource-‐ and value-‐based approaches which separately analyze the intellectual capital from a certain point of view, limiting the number of problems at the intersection of these concepts. Therefore, we integrate two approaches to solve problems of intellectual capital evaluation which are relevant for firms and industries behavior studying. We seek to integrate two approaches to answer following questions: • Is there a close relationship between an intellectual capital quality and company performance: a creation and destruction of the enterprise value due to intellectual capital employed? • What are the external and internal factors affecting on this relationship? (country, industry, firm size, market dynamics, etc.) • Is there a certain complementarity of the intellectual capital separate components (human, institutional and market resources)? Despite a large empirical background intellectual capital management issues are not well studied fundamentally. The purpose of this research is a development of cost-‐effectiveness tools for a company intellectual resources analysis. Several statistical methods should be provided for the empirical issues of this research, including common cross-‐sectional and panel data analysis. The data base collected for this purpose will consist of financial and economic indicators underlying intellectual capital evaluation, for example, strategic performance indicators (EVA, FGV, Q-‐Tobin). It should be emphasized, that a number of required data are quiet specific and hardly observed. Thus, the data base of this research founds on the annual statistical and financial reports including a description of some qualitative characteristics of analyzed companies and industries: total labor productivity, staff education level, customer loyalty, product range, R&D expenditures, participation in business associations, co-‐operative innovation projects, localization and specialization coefficients and others. This paper is devoted to the research problem identification and motivation and also presents some empirical results.
Electronic copy available at: http://ssrn.com/abstract=1999904
Key words: intellectual capital inputs and outcomes; economic value added. 1.
Introduction
The strategic role of the knowledge management for company in new economy is widely discussed both on theoretical and practical levels (Ramelt, 1991; Stewart, 2001; Roos, 2006). One of the most important issues in knowledge management is intellectual capital identification and evaluation, as well as company’s performance measurement in terms of value-‐added of the intellectual capital. Our study focuses on the methods of intellectual capital evaluation, in particular: key value drivers identification and their relationship analysis. This approach allows to find out the most efficient way of knowledge management, including making of investment decision. It should be emphasized that intellectual capital analysis in terms of investment evaluation is based on inputs and outcomes identification and assessment. In other words we need to study the mechanism of intellectual capital transformation in company’s performance. Most of the relevant researches are based on resource-‐ and value-‐based approaches which separately analyze the intellectual capital from a certain point of view, limiting the number of problems at the intersection of these concepts. Therefore, we integrated two approaches to solve problems of intellectual capital evaluation which are relevant for firms and industries behavior studying. The idea of the intellectual capital research in the resource-‐based approach is associated with P. Ramelt, who showed empirically the predominance of intra-‐ sectoral over inter-‐ differences in the ratio of 7:1. This confirms the organizational factors dominance as a company competitive advantage (Ramelt, 1991). B. Stewart in his research in the frame of value-‐based approach draws attention to the gap between book and market value: while in 1978 the gap was about 5-‐10%, in 1998 the market value exceeded the book value in average at three times (Stewart, 2001). Researches, who deal with value-‐based concept, associate this fact with the increasing role of intellectual capital in a new economy and called it “ the knowledge economy” (Stern, Stewart, 2001).
Several researches, analyzing an intellectual capital in terms of knowledge management implementation, are trying to catch a connection between indirect characteristics of intellectual capital and performance of the company. The essential assumption of most empirical studies is that an indirect assessment of intellectual capital could be provided by financial statements analysis. It is obviously that the intangible characteristics of the company are very poorly expressed in financial terms. Therefore, we need to use information which could not be found in financial statements to assess the intellectual capital inputs and knowledge management implementation. Despite of the relevance of the intellectual capital issues existing studies show poor development and practical implementation of measuring tools. That dues to several limitations and shortcomings of knowledge management monitoring and assessment systems. This paper is devoted to the problem identification and motivation and some empirical results are also presented here. The purpose of this research is a development of cost-‐effectiveness tools for knowledge management drivers identification. We suppose that the potential effectiveness of intellectual capital resources varies depending on the company size, industry and country. 2.
Literature review
Analyzing the evolution of the intellectual capital concept, we can conclude that, unlike a common understanding of this phenomenon in the classical economics in the modern scientific and applied studies the interpretation of the intellectual capital is diversified. That could be easily explained by the multiple purposes of its study. Obviously, the intellectual capital phenomenon is described by
Electronic copy available at: http://ssrn.com/abstract=1999904
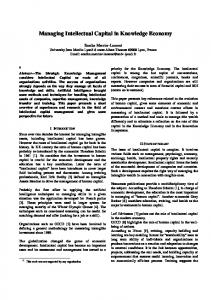
two categories: capital and intelligence (knowledge). The firstof these concepts reveals the essence of the phenomenon, and the second gives its basic definition. Most of them are based exactly on the combination of the above mentioned properties such as ‘capital’ and ‘intelligence’. For instance: ‘Intellectual capital is the group of knowledge assets that are attributed to an organization and most significantly contribute to an improved competitive position of this organization by adding value to defined key stakeholders’(Marr, Schiuma, 2001). Analyzing this definition, we can conclude that intellectual capital is defined as a company’s resource which should provide the additional value for stakeholders. That explains a simultaneous development of two intellectual capital concepts: resources-‐based and value-‐based approaches. The ability to enhance an effectiveness of the others resources, including tangible assets is the key feature of intellectual capital. Knowledge management provides the whole set of tools for effective intangibles use. Despite specific features of intellectual resources they should be considered as a part of companies invested capital and characterized according to common approach to capital identification. Let us consider key attributes of intellectual capital associating it with tangibles assets (figure 1). According to common approach on the financial and economics basis the invested capital is characterized by following categories: • • •
amount of capital employed; return on capital employed; cost of capital employed.
Return on Capital
Amount of Capital
Quanity and Quality of IC
Capital
Intellectual Capital Cost of Capital
Return on IC
Alternaive Cost of IC
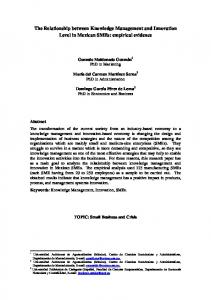
Figure 1: Common characteristics of intellectual resources as a part of company’s capital It should be noticed that intellectual capital is a heterogeneous resource. We need to split an intellectual capital into components and analyze each of them separately. A variety of intangibles compositions options are currently proposed and reasoned, including two-‐ three-‐, four-‐ and five-‐ components structures (Edvinsson, Malone, 1997; Bontis, 1998, Stewart, 1997, Saint-‐Onge, 1996; Sveiby, 1997; Van Buuren, 1999; Roos,1998; O’Donnell, O’Regan, 2000). We are following an approach suggested by Roos and Stewart who identified three components of the intellectual capital: human (HC), relational (RC) and structural resources (SC) – Fig.1. This division fits good in a resource-‐based logic, as separately describes key areas of company management:
• • •
HC -‐ human resource management; RC -‐ marketing (communication with customers, suppliers, partners and competitors); SC -‐ processes engineering, organizational culture, innovation and technology
HC RC SC Figure 2: Three-‐component structure of intellectual capital All intellectual capital components are strongly interconnected. Meanwhile many studies emphasize higher importance of a human capital; others pay more attention to the structural capital. We suppose that significance of each component is associated with a variety of factors, for instance belonging to a particular industry and country. Many researchers argue that intellectual capital is becoming almost the only competitive advantage of the company in the new economy. The economic profit or residual income concepts are based on the fact that just the competitive advantages of a particular firm provide additional value creation. Therefore the close connection of the modern value-‐based management concepts and knowledge management becomes clear. Despite the obvious logical relation and theoretical reasonableness of the assumptions mentioned above, this hypothesis testing leads to the contradictory results in empirical studies. We suppose that such results could be explained by shortcomings of the information field as well as unclear objective setting and incorrect research choosing instruments. Our study is based on the critical analysis of the relevant theoretical and empirical researches and seeks to take into account their experience for drawing more precise conclusion. According to the relevant studies value created by the company, expressed in material form, depends largely on intangibles employed such as reputation and relationships with clients, staff competence, etc. now. In most researches intellectual capital are recognized as knowledge that can be converted into value (Edvinsson, Malone, 1997; Zeghal, Maaloul, 2010). Consideration of the value added as one of the key productivity and efficiency indicators of intellectual capital have increasingly become the object of academic studies in recent years. Within the value-‐based approach following tools are comsidered as a proxy indicator of intellectual capital: economic value added (EVA©), future growth value (FGV©),Q-‐Tobin, real assets value enhancer (RAVE©) and value added of the intellectual capital (VAIC©). Meanwhile we are going to implement resource-‐based approach principles to get a comprehensive and complete description of all intellectual capital components.
An intellectual capital, which allows companies to create value added, is considered as a long-‐term growing point in new economy (Riahi-‐Belcaoui, 2003; Youndt, 2004). Several empirical researches were devoted to intellectual capital and value added analysis, for instance, Kurima who studied the Brazilian public companies (Kimura at al, 2010), Ozturk and Demirgunesa (Ozturk, Demirgunes, 2007), who examined companies listed on the ISE (Istanbul Stock Exchange), Diez who analyzed the value creation by Spanish firms (Diez JM et al, 2010), as well as many others. A statistical analysis allowed them to reveal a relationship between the intellectual capital and value added elements. However it remains unclear what share of value is created by physical or intellectual resources. Thus, despite a huge number of papers, covering issues mentioned above, (Pulic, 2000; Stewart, 2002; Chen, Cheng, Hwang, 2005; Tan et al, 2007; Zeghal, Maaloul, 2010) this research problem remains relevant and interesting for further studying.. The recent studies consider EVA as one of the key proxy indicators of intellectual capital (Lev, 1999, Pohlman, 2000; Stern, 2001; Riahi-‐Belkaoui, 2003). They argue that the economic profit is the welfare gains of the company through the effective use of resources. In the era of globalization and "the new economy" a role of tangible assets recedes into the background because they are not able to create the company's competitive advantage. As a result of the growing importance of investments in intangible assets in terms of value creation intellectual capital accumulation is increasing every year , exceeding the amount of investments in physical and financial capital in some countries. (Zeghal, Maaloul, 2010). Different researchers associate these changes of the investment strategy with the transition to knowledge economy (Stewart, 1997; Sveiby, 1997; Edvinsson, 1997; Lynn, 1998; Zeghal, 2000). Despite a good theoretical validity some researchers strongly criticize this approach about intellectual capital evaluation. This criticism is mostly based on the empirical results. For instance, Fernandez has shown in his research that EVA© indicator is not able to measure even if the creation or destruction of value expressed in market capitalization (Fernandez, 2001). Meanwhile, according to some researches, an impact of the intellectual capital and its components on the company’s value explains a spread between market capitalization and book value (Steward, 1999; Lev, 1999). The index, calculated as the ratio of market value of assets to their book value, is called q-‐Tobin. The idea of this approach is as follows: the more is a mentioned indicator the more is a spread between invested capital and potential return the more is an intellectual capital employed. If we assume that market capitalization reflects companies performance and especially intangibles outcomes, EVA© could not be used as an intellectual capital indicator. Furthermore some present relevant empirical studies sound conclusions about a low predictive power of almost all value-‐based models applied for intellectual capital analysis. (Bontis, Dragonetti, Jacobsen, Roos, 1999). Another proxy indicator which is closely connected with economic profit is a value of future growth (FGV©). FGV© asses a share of market value attributed to EVA© growth. In accordance with J. Stern and B. Stewart FGV© can be driven by market expectations of productivity improvements, organic growth, and value-‐creating acquisitions. Companies can calibrate their incentive plan to performance targets tied to the annual EVA© growth implied by FGV©. Furthermore, the FGV© component can be a useful tool in benchmarking against the "growth plan" of competitors and evaluating investors' assessment of the wealth creation potential of new strategies and opportunities (Stern, Stewart, 2010). Several studies show that a share of the future growth value in several company's value grows every year, and in some industries are characterized by innovative products implementation (Burgman, Roos, 2005). This approach suggests the innovative behavior and investment policy focused on the intellectual capital accumulation have a higher potential of a future growth. Obviously that FGV© has similar shortcomings and limitation as EVA©. However this indicator gives clear interpretation about future opportunity of a particular company to increase
current value though intellectual capital employment. Therefore, a share of FGV© in market value could be considered as intellectual capital outcome in terms of value creation. 3.
Research design
As we have mentioned above we try to synthesize value-‐ and resource-‐based approaches in the intellectual capital study. However we primarily focus on the value-‐based approach goal-‐setting. It means that the idea and main assumption of this research is closely connected with relevant VBM models, in particular economic EVA©, FGV©, Q-‐Tobin. These indicators are considered as proxy indicators of intellectual capital outcomes in our research and present explained variables. Meanwhile we are going to implement resource-‐based approach principles to get a comprehensive and complete description of all intellectual capital components (intellectual capital inputs). Moreover we need to identify factors which support or prevent intellectual capital transformation in companies’ performance (Figure 3). Any link between performance outcomes and intellectual capital components is unlikely to be simple. Following this fact, four prominent have been tested during the research: Hypothesis 1: Economic value added, future growth value, Q-‐Tobin are proxy indicators of intellectual capital outcomes. Hypothesis 2: Intellectual capital inputs can be described by proxy indicators, based on public available information about the company from its annual financial and statistical reports. Hypothesis 3: There are internal (IC components configuration of the particular company and age) and external (country, industry, location) factors which influence on a transformation of intellectual capital in companies performance. Hypothesis 4: There is a complementarity between intellectual capital components and that has an impact on company performance. With regard to these assumptions and literature background we use the following research framework:
• Resource-‐based approach (intellectual resources idenificaion and discripion)
Factors of transformaion • Country
• Value-‐based approach (EVA, FGV, Q-‐Tobin)
• Industry • IC components configuraion • Age
Intellectual capital inputs
Intellectual capital outcomes
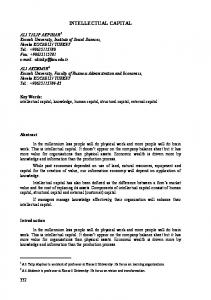
Figure 3: Framework of intellectual capital analysis (resource-‐ and value-‐based approaches combination) Taking into account that all components of intellectual capital are linked each other (Figure 2) we need to analyze some attributes of intangibles separately. A description of the intellectual capital attributes as well as examples of some indicators are presented hereinafter (Figure 4). According to above suggested approach (Figure 1) five characteristics of intangibles should be identified. We suppose all-‐around analysis would reveal important proxy characteristics and we would get good estimations of intellectual capital investments and knowledge management effectiveness. These indicators present explanatory (dependent) variables in our study.
Quantity of IC
• Proxy indicators of the amount of resources involved (number of employees, number of long-term contracts with customers and suppliers, the number of patents and licenses, trade marks)
Quality of IC
• Proxy indicators of quality of the resources involved (staff qualifications, value and exclusivity of long-term contracts with customers and suppliers, value of patents and licenses, brand power)
Return on IC components
• VAIC: HSE, CEE, SCE • RAVE: workonomics, supplynomics, custonomics
Return on IC
• EVA • FGV • Tobin’s q
Alternative cost of IC
• return on alternative investments (inside and outside company)
Figure 4: Description of the intellectual capital attributes This study investigates the local economic impact of intellectual capital components on Russian and European companies’ performance. To assess economic impact we use a number of different dependent variables measured at the level of the individual firm.
Figure 5 provides a brief description of variables used in our study that were selected based on earlier studies and theoretical models. In order to capture possible relationships and significant internal and external factors, we also consider natural logarithms of the measures. Dependent variables: intellectual capital outcomes EVA
FGV
Q-‐Tobin’s
Independent variables: intellectual capital inputs and factors of transforma5on Common informaCon Age -‐ years of presence on the market
Belonging to industry (dummy) -‐ manufacture membership
Belonging to country (dummy) -‐ Germany membership
Belonging to developed country (dummy) -‐ Germany, Great Britain, Spain, Finland or Denmark membership
Independent variables: intellectual capital inputs and factors of transforma5on Share of wages in costs
Intellectual capital components: human capital Board of directors qualificaion (categorical 0-‐2) -‐ proxy indicator of employee qualificaion *
Earnings per employee -‐ proxy indicator of human capital quality
Corporate university (dummy)
Independent variables: intellectual capital inputs and factors of transforma5on Intellectual capital components: relaConal capital Commercial expenses share
Foreign capital employed (dummy)
Presence of subsidiaries
Well-‐known brand (dummy)
Citaions in search engines (categorical 0-‐8)
Integrate indicator of the site quality (categorical 1-‐4)
Independent variables: intellectual capital inputs and factors of transforma5on R&D investments
Intellectual capital components: structure capital ERP, quality management Patents, licenses, systems implementaion Intangible assets trademarks (dummy)
Stable turnover growth
Figure 5: Variable list Notes: * Criteria: • If more than a third of directors have postgraduate level of qualification and more than 5 years experience – 2 points. • If more than a third of directors have postgraduate level of qualification or more than 5 years experience – 1 point. • Another – 0. ** Criteria: • Availability of information for investors. • Multi-‐lingual information. • Amount of information. • Design. Each categorical variable is transformed into dummy variable for linear regression analysis. Before the empirical study results in the next section we will present the employed data. 4.
Data and methodology
We have investigated firms from Russia and several European countries such as Serbia, Great Britain, Ukraine, Turkey, Finland, Denmark and Spain according to the country position in Knowledge Economy Index 2008 [http://data.worldbank.org/data-‐catalog/KEI]. Also we only have analyzed companies from industries with the predominance of varied intellectual capital components and therefore different intellectual capital configuration. So that, we have selected the following industries: financial services, wholesale and retail trade; machinery and equipment manufacture; chemical; transport and communications. We have chosen these particular industries since they represent a wide range of knowledge-‐intensive manufacturing and service sectors. The datasets in this study erw derived from a combination of several detailed longitudinal databases FIRA PRO and SPARK-‐INTERFAX for Russia and Bureau Van Dijk (Amadeus and Ruslana) for Europe based on the companies’ annual statistical and financial reports. Due to intellectual capital nature and our goals we have used many qualitative data from web-‐sites, magazines, citation bases, data from patent bureaus and etc. We have used the following criteria when deciding on the inclusion of firms in the sample: • •
Number of employees should be no less than 500 and no more than 20 000 people. Firm should belong to public company.
As a result, the Russia and Europe databases include information on 420 and 332 firms over 2005-‐ 2009 years, respectively. The dataset compiled by the authors includes the following information: • Common indicators – form and structure of ownership, company age, industry and enterprise code, location, patents and licenses. • Economic indicators – costs, export, R&D expenditures, capital investments, working capital • Financial indicators – operating profit, company profitability, economic value added, future gross value and Q-‐Tobin coefficient etc. • Specific intellectual capital indicators – VAIC, brands, quality of web-‐site, and others. Table 1 helps us to characterize the type of a company that was used in our research. It presents several descriptive objectives of the sample, where the mean and the standard deviation of the variables are detailed: Table 1: The sample descriptive adjectives
As shown in table 1, we can detect R&D investments only for 217 from 1635 of objectives for Europe database. Others objectives in the databases are classified as “system missing”. Despite this factor importance we decided to exclude them from our research for not reducing the sample. Let us now turn to EVA and intellectual capital indicators for our sample. According to the established approach to the competitiveness theory and intellectual capital concept, the higher intellectual capital efficiency degree is the more competitive and successful is a company, as measured by EVA, FGV and other measures. 5. Empirical results As mentioned earlier, the interest in the study of intellectual capital emerges due to their assumed ability to enhance the value creation. Nevertheless, empirical research offers contradictory results that, on occasions, calls into question the statements made in the papers that study this link. It should be clear that we do not combine the Russia and Europe samples because of vary distinctions between countries and firms, respectively. Therefore, we have constructed separate equations and gave different outcomes. Nevertheless, we try to use standardized variables wherever possible. Our core econometric specification is as follows: Perf = α + (β1, ..., βn) HC + (δ1, ..., δn) SC + (δ1, ..., δn) RC + (λ1, ...,λn) Dummy + ε, where Perf -‐ an indicator of the performance of companies (EVA; Q-‐Tobin; FGV as independent variables); HC -‐ a vector of variables responsible for human capital component; SC -‐ a vector of variables responsible for structural capital component; RC – a vector of variables responsible for relational capital component; Dummy -‐ a vector of dummy variables introduced in the analysis. OLS method is used for regression equation coefficient estimation. There is no statistically significant spatial correlation existing between the independent variables.
This model is developed in accordance with the concept of financial architecture based on assumptions about the exogenous variables of the structure ownership and capital structure. In this case, the measurement performance companies is conducted in the context of the three indicators, which allowed reducing the level of subjectivity in the choice of favor of an indicator, and also provided an opportunity to compare the results. For each case we have constructed three models: for quantitative and qualitative factors only as well as for their combination for checking the robustness of our results12. In case of Hypothesis 1 – 2 confirmations, we expect the statistical significance of models in whole. For hypothesis 3 confirmation, the variables reflecting intellectual capital components need to be statistically significant. The results of the regression analyses for Russian companies are shown in Table 2.
2
We tested different specifications of our general model but in this paper we show only most important of them.
Table 2: Regression results for Russian companies
Notes: * Significant at p