Intelligent Context-Aware Monitoring of Hypertensive Patients Alessandro Copetti, Orlando Loques, J. C. B. Leite
Thais P. C. Barbosa, Antonio C. L. da Nóbrega
Computer Science Institute Fluminense Federal University Niterói, Brazil {acopetti, loques, julius}@ic.uff.br
Biomedical Institute Fluminense Federal University Niterói, Brazil
[email protected],
[email protected]
We present a decision-level data fusion technique for monitoring and reporting critical health conditions of a hypertensive patient at home. Variables associated to the patient (physiological and behavioral) and to the living environment are considered in the solution, contributing to improve the confidence on the system outputs. In the paper, we model the problem variables as fuzzy, aiming to capture their intrinsic essence, and draw rules based on medical recommendations to identify the health condition of the patient. This initiative move towards to build an abstract framework for context-aware telemonitoring applications. We also describe the relevant components of the framework and provide an initial evaluation of its decision component. Our results demonstrate that a principled choice of rules and variables may lead to a consistent identification of critical patient's conditions. Pervasive health care, context-awareness, home care, decision making
I.
INTRODUCTION
All around the world, the elderly population is increasing, putting an enormous pressure on health systems. This is particularly serious in underdeveloped countries, where there are insufficient economic resources to cater for hospital maintenance, as well as a small number of specialized doctors to care for the aging population. In this context, remote health assistance represents a potential solution towards helping an overloaded hospital system and provides better health care for the population. However, the benefits of home care involve demands for hardware and software infrastructures in the homes in order to collect and manage the relevant information for implementing health care services. In a pervasive computing context, the monitoring of the patient can be revolutionized. Firstly, the relevant physiological data can be collected during different times of the day. Several variables related to environmental conditions (humidity, temperature, wind, among others) can be collected and interpreted in real-time. Additionally, activities related to a person's behavior (e.g., going to the bathroom, sleeping, eating, etc.) can be inferred by processing data from sensors located in the environment. Context-aware systems that consider this kind of information in a comprehensive fashion can help improve the quality of medical care [1].
In home health care applications, pervasive computing may help implement monitoring services, but it may also have a relevant role in improving the patient's comfort (e.g., automating tasks and supporting daily life activities) and in promoting health education (e.g., providing useful information to the patient through various devices). According to [2], longterm telemonitoring provides clinically useful trend data, allowing doctors to make decisions with greater knowledge (e.g., identifying beforehand the need for changing medication or even diagnosing a disease in its initial phase), to monitor chronic deterioration in a patient's conditions, or to assess the patient's response to a treatment. A typical architecture involves sensors that collect data from the patient and send this data to a monitoring center (a clinic, a doctor, a hospital). In our vision, we take a step further by incorporating local intelligence at home: the sensors throughout the house and close to a person's body constantly generate data and their values are monitored by a local computer system that interprets them using medical knowledge. The identification of a patient's abnormal condition can activate a local device (e.g., turning on an air conditioning appliance), start an interaction with the person (e.g., through a TV screen) or send an emergency message to the monitoring center. In this work, we describe a decision-level data fusion technique, as categorized in [14], for monitoring and reporting critical health conditions of a hypertensive patient at home. Taking advantage of pervasive computing technologies, the proposed solution integrates medical guidelines, environmental conditions, and physiological and behavioral data. As a case example, we consider a hypertensive patient living alone and show how the decision function can help medical doctors identify critical situations and also to report emergency situations. II.
PERVASIVE HOME CARE
A primitive home care system requires the patient to press a button to report an emergency. It is also possible to engineer automated real-time health monitoring systems that can react autonomously when pre-set limits of physiological data are violated, e.g., as described in [3]. Clearly, for the latter, it is necessary to identify critical situations with efficiency and confidence, making a trade-off between keeping silent and
having a paranoid behavior, informing every minor disturbance in the patient's condition. An architecture for pervasive healthcare is described in [4]. It discusses the importance of data collection, data cleaning, data fusion, context and knowledge generation, and data analysis. However, it does not contemplate mechanisms for identifying critical situations. The platform presented in [5] considers ECG measurements (electrocardiogram) and the identification of walking and running activities for real-time health monitoring. However, the authors do not present results based on patient’s data. By assuming a pervasive computing infrastructure, and focusing on identifying critical health conditions our approach starts by selecting a set of variables that are relevant for the case of hypertensive patients; these variables were represented using a fuzzy model. We also identified some issues that should be considered in order to improve the confidence on the system outputs. Then, relying on medical guidelines, we drew a set of weighted rules which allowed us to identify some potentially critical situations; the weighting factors for these rules were assigned and calibrated in order to improve de confidence on the system outputs. Finally, we used a rule extraction technique to synthesize additional rules to select which of these critical situations really deserve urgent attention. III.
techniques, in order to analyze the collected data and to identify the specific activity. In our research, we assume that this information can be reliably inferred using techniques such as those presented in [6] and [7]. IV.
•
Individualization of treatment. The physiological data may vary for each patient. A possible solution to this problem is the definition of rules that establish the individual limits, or consider historical data for making decisions. Thus, alarms will not constantly trigger for a person who already has high blood pressure.
•
Influence of the patient activity and of the home environment. Examples are: room temperature interfering in a person's heartbeat; a domestic activity causing an increase in the patient's blood pressure. The system should be aware of these relationships in order to classify them within specified limits as well as to assist in the detection of different causes.
•
Relaxation (or loosening) of the limits of each monitored variable. The values that try to express a rigid concept or situation are not appropriate for different variables, especially the physiologically related ones. For example, if a person is eating, her blood pressure can increase up to 8.8mmHg above the average blood pressure ([8], p. 84). Only if this limit is exceeded, a change happens to a situation different to the normal.
•
Correlation between variables. The worsening physiological data may be accompanied by worsening in another type of data. For example, some circumstances, the increase in heart rate may followed by a drop or increase in blood pressure.
CLASSES OF MONITORED INFORMATION
In our project, we have identified three relevant classes of information that can be gathered through pervasive devices. Specifically: •
•
•
Environmental: Collected by sensors dispersed throughout the home. Examples include light, sound, smoke, fire, humidity, floor pressure, or those associated to domestic activities that may present some sort of hazard, such as using ovens and heaters. Depending on the patient's disease, some sensors can be specially required. For example, detecting floor humidity can be of assistance to patients suffering from Amyotrophic Lateral Sclerosis who are more susceptible to falls. Physiological: Collected by sensors added to the patient's body through wearable devices that can compose a Wireless Body Area Network. Common examples are blood pressure, glucose level, body temperature, and heart rate. More sophisticated devices are also becoming available: pulse oximeter (analysis of the concentration of hemoglobin and the coagulation trend of the blood), spirometer (pulmonary capacity), and electrocardiography devices. Behavioral or Activity-Related: Sensor networks are used to collect data that allow the identification of activities of daily life, such as bathing, getting dressed, using the bathroom. Other activities are also relevant: sleeping, leaving and coming back to the house and carrying out domestic activities. Contact sensors in doors, RFIDs in objects and accelerometers are commonly used, together with artificial intelligence
RELATED ISSUES
The useful interpretation of the previously described information involves considering issues such as those described in this section:
in a in be
Uncertainty in the reading of the sensors is also a relevant issue. Bad physical sensor attachment to a person's body, the person's movements (or position), or even problems inherent in data transmission on wireless networks, may affect the measurements. Currently, we do not address this complex issue; we rather assume that, in the near future, progress in the field of sensor technology will provide the necessary reliability. V.
A FRAMEWORK FOR PERVASIVE HOME CARE
The general issues discussed in the previous sections highlight key features in telemonitoring applications. Pervasive home care with health monitoring purposes require a platform with online support, inferring information or making decisions when relevant events happen. This scenario includes real-time activity-recognition algorithms [9] and techniques to realize physiological and behavioral data fusion [10]. In order to generate a context for a particular situation, data fusion techniques can be used to aggregate and combine data as proposed in [4].
Our proposal is based on a conceptual framework called HSAUDE (Health Support in Aware and Ubiquitous Domestic Environments - SAUDE means health in Portuguese), which includes functions for Context-Management, Reasoning, and Learning and are respectively implemented by modules with the same name (Figure 1). In particular, the solution described in this paper, includes a decision-level data fusion technique that helps the identification of critical health conditions.
recognize personal activities [7] [11]; however, they do not make associations with the physiological data like we do. The interaction between the framework modules may occur in several ways. For example: the Context-Management module may infer a movement of transition (for example, from lying to standing) and then trigger a reasoning rule in the Reasoning module that performs a measurement. The Reasoning module updates Context-Management with the new situation of the user (normal, alert, or emergency) and can use the Notification service in the emergency case. If the Reasoning module detects a state of alert, it can determine a sampling rate increase in the measurement of vital signs. VI.
REASONING MODULE
As a first case study, we chose an Arterial Blood Pressure (ABP) monitoring application to illustrate the design of the Reasoning module. As a specific scenario, we assumed the daily life of a hypertensive person living alone in a house.
Figure 1. H-SAUDE: Framework Modules
The essential requirement of generating reliable alarms makes the Reasoning module the core of the framework. The decision-making function of the Reasoning module (described in section VI) receives preprocessed data from sensors as input, conducts an analysis to determine critical situations, and identifies which of them must effectively generate emergency notifications. The rules component contains different types of configurations. Each configuration establishes a combination of variables and rules, used by the decision component according to current context. The Context-Management module contains primary mechanisms for the treatment and refinement of data. Initially, it performs data filtering and extracts relevant features. Data fusion and inference may be used to generate new information that is useful for reasoning at higher levels. For example, a rule can define that if the person is in the sleeping room, his/hers vital signs are normal, and does not present movement, then he/she is sleeping. This module can also interact with environment devices; for example, changing the sampling rate of a sensor. The Learning module aims to meet the requirement of adapting the system to the needs or special circumstances of an individual. The initial training data may be formed by examinations carried out previously by the patient. Examples include data from ABPM (Ambulatory Blood Pressure Monitoring), and data gathered on mental stress tests. A training database can also be formed by a process of calibration, which consists in demonstrating to the system an activity or situation involving the patient. For example, heart rate variations and the position of a person near a gym equipment may represent a session of physical exercise. Other works adopt real demonstrations to teach the system to
The first issue to be addressed is expressing medical knowledge, considering the complexity of the monitoring activity. A simple way to do this, which can be well understood by physicians, is by using rules if-then. In the sequel, we present some examples of rules using environmental, physiological and behavioral (activity of a person) variables rules are obtained from medical guidelines, mainly carried out in 24-hour ABPM analysis: •
If the average systolic pressure is greater than 135mmHg and the diastolic is greater than 85mmHg then the patient is considered hypertensive [12].
•
If the patient is eating, the systolic pressure should rise no more than 8.8mmHg above the average and the diastolic to 9.6mmHg ([8], p. 84).
•
If the patient is performing domestic activities, the systolic pressure should rise no more than 10.7mmHg above average and the diastolic pressure no more than 6.7mmHg ([8], p. 84).
•
It is always permitted for the heart rate to be between 61 and 99bpm at rest.
The physiological variables chosen were: diastolic blood pressure (DBP), systolic blood pressure (SBP) and heart rate (HR). These variables can be easily collected and change rapidly according to the clinical picture of the patient. Among the environmental factors that influence the health of the patient (light, temperature, noise, smoke and humidity, among others), for simplicity, we initially chose the ambient temperature. Regarding the patient's activity, we consider: sleeping, resting, eating, walking, or general domestic activities. Table I shows some variables considered in our prototype. While the accelerometer and the physiological data sensors are wearable, the temperature and presence sensors are placed in the main living places in the patient's home (for example, bathroom, bedroom, kitchen and living room). The activity carried out by the patient is obtained by a sub-system that infers this high-level information using raw data from sensors,
and provides it to our system. This sub-system uses techniques such as those proposed in [6] [7] [9], involving data filtering, feature extraction, and classification. We envisage a topology in which all measured values are transmitted by a wireless network to a computer (in the house) where the system runs. TABLE I.
VARIABLES AND SENSORS
Variables Physiological - DBP, SBP, HR Behavioral - sleeping, resting, eating, walking, performing domestic activity Environmental - temperature
Sensors => ABP monitor => heart rate monitor => accelerometer, presence detector, etc
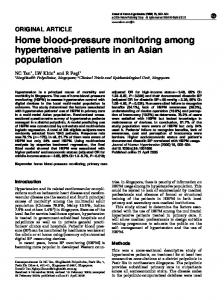
Figure 2. SBP variation while sleeping (mmHg vs. pertinence)
=> temperature sensor
Besides the “normal situation” of a patient, the system is expected to reliably identify “alarm” situations, which indicate a deviation from the expected medical recommendations, and “emergencies”, which require urgent medical assistance. In the first case, the warning output is useful in the medium term to improve the quality of medical decisions, since it identifies specific contexts where abnormalities occur. In the second case, the output serves to notify someone that the patient needs urgent care. A. Definition of Variables The dynamics of human behavior, the inherent variability of vital signs, and the uncertainties associated with the sensor collected data must be considered when defining the variables of interest. In addition, medical knowledge is expressed in a way that makes the application of exact techniques difficult. Rules such as those presented in this subsection are based on quantitative data, but these data items are subject to fluctuations and require an appropriate approach to be manipulated in a useful way. Considering this context, we adopt a Fuzzy Logic Model to represent the relevant variables and to implement decision-making functions in decision component. The physiological variables, SBP and DBP, were modeled both separately and together with the variables associated with the patient's behavior. For example, the variable SBP is important in defining what is loosely abnormal; even if a person suffering from high blood pressure feels well, she can be considered hypertensive (people at home with an average SBP greater than 135mmHg). We also model the variables for each patient situation. For a sleeping person (Figure 2), SBP is between 0 and -10mmHg, this is considered normal; values above are considered high and values below are considered negative-high. Figure 3 represents the medical recommendations regarding SBP when the person is at rest. In this case, the variation of SBP must be around the average (computed for the vigil period), that is, great variations in blood pressure values should not occur. The results produced by the fuzzy function that identify the patient's current situation (normal, alert or emergency) are shown in (Figure 4).
Figure 3. SBP variation while resting (mmHg vs. pertinence)
Figure 4. Patient situation
As for the “activity” variable, there is a singularity. The order of the states in this variable is related to the increase in SBP variation: sleeping, resting, eating, walking, and domestic activities. These states represent very specific home care situations, which do not exclude others, such as making a phone call or taking medication. The “activity” variable is treated as fuzzy singleton, i.e., only the integer values that represent each activity have a complete and full membership. Activity recognition can be based on information gathered from different sensors. In order to identify an activity, a process using one or more sensors should accurately classify the activity. As stated before, this work does not aim to explore activity recognition techniques; we assume that the activity information will be supplied to our system. B. Reasoning Model The interactions in the Reasoning module are presented in Figure 5. Raw data coming from sensors is preprocessed by the context management services, producing higher-level information. After this, the fuzzy component identifies the current state of the patient (normal, alert or emergency). This can be achieved in two steps: in the first step, the fuzzy rules are applied; in the second step, the individualization function further examines the generated output. For example, if the current input (physiological values) is atypical (e.g., does not occur frequently) for the patient, an alert output can be consolidated as an emergency. The generated data is stored for helping the next decisions and for additional uses. Another
component can perform a context analysis in off-line mode based on the stored alert reports. It is important to detect, for example, whether the ambient temperature is higher in alerts situations.
trials were performed (using data of dozens of patients) in order to calibrate the system outputs and satisfy its confidence requirements. For evaluating the rules the “min” implication and the “sum” aggregation operators were used. The “bisector” defuzzification method was also employed. As a result we were able to adjust the weight of the rules that identify normal, alert and emergency situations. For evaluating the sensibility of the system regarding the relevance of variables and rules, we have defined two model configurations for testing: 1) SBP, DBP, HR, V/S, and generic rules (GR); 2) SBP, DBP, HR, activity, rules with averages (RwA), and GR;
Figure 5. Reasoning Module
VII. EXPERIMENTAL EVALUATION We are developing a prototype to validate the proposal. Here we report some initial results using real data collected offline in 24-hour ABPM exams. In a next step, we intend to use real-time data collected through wireless devices. The main objective was to evaluate the outputs of the fuzzy block after submitting patient data.
The second configuration uses all activities types defined for the activity variable: sleeping, resting, eating, walking, or general domestic activities. The first configuration uses only vigil and sleep. Some manual adjustments were made in the “activity” variable. When the activity diary reports that the patient is watching TV or when no activity is reported, it is assumed that the patient is resting. In other exceptional cases, it is assumed that the information of a meal or resting after lunch is valid for 30 minutes; leaving the house becomes the activity “walking”. The results for the two configurations are shown in Figure 6. The tests with dozens of patients showed a very similar behavior, therefore we present only two patients for each patient's blood pressure level (hypertensive is greater than 135/85mmHg).
Analyzing vital signs may produce better results when we add variables and rules relevant to the decision component. Improved results are observed by means of correctly identifying critical situations, distinguishing alerts from emergencies so as not to generate false alarms. Concurrently, we intend to identify these situations in patients who possess different blood pressure levels. This implies avoiding the emission of repeated alerts or emergencies for hypertensive patients. The ABPM data of a patient probably presents just a few alert situations and a much smaller number of emergency situations. Thus, obtaining a higher average of normal outputs and maintaining the identification of alert situations means a better result, as long as it is confirmed through medical analysis. The model presented in this work contains “rules with averages” (RwA). In other words, there is a pre-processing step, where blood pressure values and the average pressure are compared in order to obtain a pressure variation value. The rules defining hypertension are traditionally “generic rules” (GR) containing fixed values, such as the definition of a SBP alert within the interval 140mmHg-179mmHg, or an emergency for values above or equal to 180mmHg. Another feature of the generic rules is that they only consider whether the patient is sleeping (S) or in the vigil (V) state. The ABPM data sets of patients were fed to the Reasoning module, implemented with MATLAB/Simulink tools. Many
Figure 6. System outputs for different variables and configuration rules; P1 and P2 are normotensive patients; P3 and P4 are hypertensive
The resulting average values of the system with a 95% confidence interval indicate lower values for the first model. This is true for patients with low blood pressure values (normotensive). However, in hypertensive patients, the best alternative is a data entry with all the suggested variables, the rules with averages (RwA) and the generic rules (GR). We also ran experiments related to “individualization”. In order to extract association rules from the patient's history, we used the APRIORI algorithm [13. At first, a discretization
process is performed for each variable. Then the rules are created using the variables that exceeded their limits. Table II shows results of a “Manual Analysis” used in the traditional process of ABPM data evaluation, which identifies alerts for values higher than 135/85 during the vigil period and 120/70 during the sleep period. Table III shows the outputs produced by using our “Basic” fuzzy system and the “Individualized” system. The individualization process verifies whether the input values are within the blood pressure intervals that occur with greater frequency for the patient. When this happens, it applies a reduction factor on the outputs of the fuzzy system. In order to improve the confidence, this adaptive process applies different factors defined by physicians for abnormalities caused by SBP and DBP measurements. These experiments indicated that individualization step was efficient in reducing false outputs. TABLE II.
We believe that flexible decision mechanisms are essential for producing accurate health reports. For example, diseases, medicaments and physical activities cause variations in the patient's physiological data, which should require a customization of the set of rules, for each particular case. Thus, in a future research step, we intend to investigate learning techniques to help to make automatic this customization process. ACKNOWLEDGMENT The authors would like to thank the support provided by FAPERJ and CNPq for this research. REFERENCES [1]
MANUAL ANALYSIS [2]
Patients
Manual
id
Average
normal
Alerts
P1
121/72
66
12
P2
138/75
33
45
P3
167/71
1
68
P4
158/94
1
59
[3]
[4]
[5]
TABLE III.
FUZZY SYSTEM OUTPUTS [6]
Basic
Individualized
id
normal
alerts
emerg.
Normal
alerts
emerg.
P1
68
9
1
70
7
1
P2
55
20
3
59
16
3
P3
40
25
4
58
7
4
P4
38
21
1
50
9
1
[7]
[8] [9]
VIII. CONCLUSIONS The presented approach for home health monitoring hinges on the fusion of physiological, behavioral and environmental information. Making the system aware of this kind of variables helps a local reasoning mechanism to generate more accurate emergency notifications. According to our initial results, the proposed approach performs reliably for hypertensive patients, probably because it relies on averages and considers the vital signs overall history. Currently, we are trying to improve on these results considering other options, such as a history search based on restricted time intervals. In addition to continuing to develop several aspects of the system, we intend to perform experiments with a larger number of patients in order to refine our initial results. Furthermore, we intend to develop a methodology for system confidence evaluation.
[10] [11]
[12]
[13]
[14]
J. Maitland, S. Sherwood, L. Barkhuus, I. Anderson, M. Hall, B. Brown, M. Chalmers, and H. Muller. “Increasing the awareness of daily activity levels with pervasive computing”, in 1st International Conference on Pervasive Computing Technologies for Healthcare, pp. 1–9, 2006. C. Scanaill, S. Carew, P. Barralon, N. Noury, D. Lyons, and G. Lyons. “A review of approaches to mobility telemonitoring of the elderly in their living environment”, in Annals Biomedical Engineering, vol. 34(4), pp. 547–563, 2006. Peter Leijdekkers, Valerie Gay and Elaine Lawrence. “Smart Homecare System for Health Tele-monitoring”, in 1st International Conference on the Digital Society, vol. 0, pp. 3, 2007. H. Lee, K. Park, B. Lee, J. Choi, R. Elmasri. “Issues in data fusion for healthcare monitoring”, in 1st International Conference on Pervasive Technologies Related To Assistive Environments, vol. 282, pp. 1–8, 2008. W. Chung, S. Bhardwaj, A. Punvar, D. Lee and R Myllylae. “A fusion health monitoring using ECG and accelerometer sensors for elderly persons at home”, in International Conference of the IEEE Engineering in Medicine and Biology Society, pp. 3818-3821, 2007. M. Marschollek and et al. “Multimodal home monitoring of elderly people--first results from the lass study”, in 21st International Conference on Advanced Information Networking and Applications Workshops, pp. 815–819, Washington, DC, USA, 2007. W. Pentney, A. M. Popescu, S. Wang, H. Kautz, and M. Philipose. “Sensor-based understanding of daily life via large-scale use of common sense”, in Proceedings of American Association for Artificial Intelligence, Boston, USA, 2006. D. Mion, W. Oigman, and F. Nobre. “MAPA: Monitorização Ambulatorial da Pressão Arterial”, Atheneu RJ, 3rd ed., 2004. T. Choudhury, S. Consolvo, B. Harrison, J. Hightower, A. LaMarca, L. LeGrand, A. Rahimi, A. Rea, G. Bordello, B. Hemingway, P. Klasnja, K. Koscher, J. A. Landay, J. Lester, D. Wyatt and D. Haehnel. “The mobile sensing platform: An embedded activity recognition system”, in Pervasive Computing, IEEE, vol. 7(2), pp. 32–41, 2008. SenseWear BMS Components. http://www.sensewear.com, 2009. B. Ziebart, D. Roth, R. Campbell and A. Dey. “Learning Automation Policies for Pervasive Computing Environments”, in 2nd International Conference on Autonomic Computing, pp. 193–203, Seattle, USA, 2005. Brazilian Society of Cardiology. “IV Guideline for Ambulatory Blood Pressure Monitoring. II Guideline for Home Blood Pressure Monitoring”, in Arquivos Brasileiros de Cardiolologia, vol. 85 (Supl II):1–18, 2005. R. Agrawal and R. Srikant. “Fast algorithms for mining association rules in large databases”, in 20th International Conference on Very Large Data Bases, pp. 487–499, San Francisco, CA, USA, 1994. G. Yang and X. Hu. “Multi-Sensor Fusion”, in Body Sensor Networks, Springer-Verlag, pp. 239–285, 2006.