50
30 20
•
10
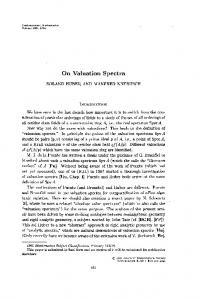
O-r~--~--~--~~--~--~ o 0.5 1 1.5 2 2.5 NORMALIZED INTENSITY [a. u.] FIG. 8. Intensity distribution oflines between 0 and - 120 GHz: Upper trace: In the Qbranch ofthe 1~ I~ band in C. ~. The two peaks result from the Iines of the two overlapping bands which are indicated in the figure. Lower trace: Of lines located to the blue of the rotationJess origin of the 14~ I~ band. Only Iines ofthe 14~ 16~ 17~ band contribute. Note the change in scale for the vertical axis. For explanation ofthe intensity scale (horizontal axis) see the text.
39855.893 (8)
1100
f
Eexc = 2492 cm- 1
40
n
I -30
14 1 0 16 10 17 10
f
f
I
f
f
f
f
I 0
f
f
f
f
I
cm- 1
f
f f f I [GHz) 10
FIG. 9. Part ofthe Doppler-free two-photon spectrum ofthe Qbranch ofthe 14~ band in C.D•. The rotationless origin
Voo
is marked by an arrow.
J. ehern. Phys., Vol. 89, No. 8, 15 October 1988 Downloaded 09 Oct 2008 to 129.187.254.47. Redistribution subject to AIP license or copyright; see http://jcp.aip.org/jcp/copyright.jsp
Sieber, Riedle, and Neusser: Rotationalline spectra. I
4. t4~ band In C,O.
50-
The line spectrum ofthe blue edge ofthe Qbraneh ofthe 14~ band in C 6 D 6 is shown in Fig. 9. The rotationless origin V oo is located at 39855.893 (8) em -I two-photon energy and the final 141 state is at an excess energy of 1567 em -I. There the density of states is 4 1Iem - I. In the investigated spectral range (0 to - 120 GHz) nearly no perturbations were found and every line was assigned. 3S The analysis leads to the rotational eonstants shown in Table I. No remarkable interfering eontributions from another neighbored band are present, as can be seen by inspeetion ofthe range to the blue of the rotationless origin. In Fig. 10 the eorresponding line intensity distribution is shown and the data are given in Table 11. The line intensity distribution is peaked near 1 a.u. and displays asymmetrie shape. This is in line with the nonperturbed character ofthis band found from the detailed spectroseopie analysis.
4629
= 1567 cm- 1
Ul
~40-
... ..
H
...J \.J..
30-
o CI: UJ
20-
co ~ 10-
...... .. . • ..•. ••..........•
•
z
-'---
O~----'I----~I-----~I~~I~""
o
0.5
1
1.5
2
2.5
NORMALIZED INTENSITY [a. u .] FIG. 10. Intensity distribution oflines between 0 and - 120 GHz: in the Q branch ofthe 14~ band in C6 D 6 • For explanation ofthe intensity scale see the text.
5. Summary for weakly perturbed bands
D. Llne Intenslty distribution of strongly perturbed bands
In this section we have shown that the normalized line intensity distribution has a partieular shape for nonperturbed or weakly perturbed bands. For the selected part of the rotational eontour (blue edge of the Q branch) it displays a symmetrie peak with a maximum whose position is the same for the various totally symmetrie two-photon bands under eonsideration. The number of lines is rapidly decreasing for smaller intensities. Due to the high dynamie range in our experiment, the statistics are good enough to even separate the contributions from overlapping bands. For the weakly perturbed bands studied so far, the eharaeteristie intensity distribution of unperturbed bands was found also for this eomplex situation.
In the preceding section bands at relatively small excess energy with low density of background states « 18 11 em -1) have been investigated. Now we would like to study two bands at somewhat higher excess energy. Efforts have been made to analyze the rotational strueture of these bands but an assignment of the rotational lines is, if at a11, only possible for a few lines. Obviously, these bands are strongly perturbed and it is of interest to investigate whether the intensity distribution of these bands differs from that of the nonperturbed bands discussed in the preceding section. Progression bands of two of the fundamental bands de-
40414.08(10)
1100
I I -30
I
I
I
I
I
I
I
I
I I -20
I
I
I
I
I
I
I
I
I I -10
I
I
I
I
I
I
I
I
I 0
I
I
cm- 1
I I I I [GHz] 10
FIG. 11. Part ofthe Doppler-free two-photon spectrum ofthe Qbranch ofthe 14~ l~ 16: band in C6~'
J. ehern. Phys., Vol. 89, No. 8, 15 October 1988 Downloaded 09 Oct 2008 to 129.187.254.47. Redistribution subject to AIP license or copyright; see http://jcp.aip.org/jcp/copyright.jsp
4630
Sieber, Riedle, and Neusser: Rotationalline spectra. I
scribed and analyzed above have been selected. In the progression band one quantum of the totally symmetric C-C stretch vibration VI (923 cm - I) is excited in addition to the fundamental vibration. 36 Since there is no change in the selection rules and only a small change in the rotational constants. the rotational structure is expected to be similar to that of the corresponding fundamental band. If no perturbations were present also the line intensity distribution should resemble that of the fundamental band.
300 100 50
30 IJ.J
Z H
...J
~
o
CI: IJ.J
t. t4~ t~ t6~ band In C.H.
Eexc
=
2727 cm- 1
..
• •
20
14101101611
10
..
O-r-----r-----r--~~~~~~~
300
ro 100
The rotationless origin V oo of the 14~ 1~ 16: band in C 6 H 6 is at a two-photon excitation energy of 40 414.08( 10) cm - 1 and the final 14 1 11 16 1 state is at an excess energy of 2727 cm - 1 with a total density of states of 32 l/cm - I . The measured blue edge of the Q branch of this band is shown in Fig. 11. To the blue ofthe rotationless origin there are only tiny contributions from the neighbored 14~ I~ 11: band. This is in agreement with the low resolution results of Sur et al. 28 who found that the ratio between the intensities of the 14~ 16: and the 14~ 11: bands is smaller than the corresponding ratio for the 14~ I~ 16: and 14~ I~ 11: bands. The band displays a complicated rotational structure. Somers et al. 34 could only analyze and assign part of the rotationalliJ?es and they concluded that in addition to the I-type doubling which is already present in the 14~ 16: fundamental band this band is strongly perturbed. In the upper part ofFig. 12 the line intensity distribution is shown. It results from the statistical analysis of 827 lines located in the selected frequency range ofO to - 120 GHz. This is about the same number of lines as observed in the 14~ 16: fundamental band. However, it has to be taken into account that about 30% of the lines in that case originate from the overlapping 14~ I q band. For the 14~ I~ 16: band no remarkable contributions from the 14~ I~ 11: band are present and the lines found in excess oftwice 277lines (see 14~ band) expected at most for the I-type doubling can only be ascribed to perturbations present in this band. This conclusion drawn from the total number oflines is strongly supported by the intensity distribution. It completely differs from the distributions of the weakly perturbed bands shown in the preceding section. There is no longer a maximum but instead the number of lines increases monotonically with decreasing intensity. In the lower part ofFig. 12 the normalized line intensity distribution for the frequency range 0 to + 35.75 GHz to the blue of the rotationless origin is shown. It reftects the small contribution from the overlapping very weak 14~ Ib 11: band (see above ). It is seen that these contributions may only affect the very low intensity part ( < 0.2 a. u.) of the intensity distribution in the range o to - 120 GHz. Hence, we conclude that the many small lines in the intensity range 0.2-1 are the result ofmany perturbations occurring in this band. This is in qualitative agreement with the strongly perturbed eharaeter of this band found from the detailed spectral analysis. 34
•• ••
40
Cf)
CsH s
•
~ z 50
• •
40 30 20
•
10
...~__~......- -__
O~~~--
o
~
1
~
2
~
NORMALIZED INTENSITY [a. u.] FIG. 12. Intensity distribution oflines between 0 and - 120 GHz: Upper trace: in the Qbranch ofthe 14,',1,',16: band in C6 H 6 • Lower trace: oflines located to the blue of the rotationless origin of the 14,',1,',16: band. Only Iines of the 14,',1,', 11: band contribute. Note the change in the scale of the vertical axis. For explanation ofthe intensity scale (horizontal axis) see the text.
2. t4~ t~ band In C.D.
Therotationless origin V oo ofthe 14~ 1~ band in C 6 D 6 is located at a two-photon energy of 40 733.84( 10) cm - 1 and the final 14 1 11 state has an excess energy of2445 cm - I. Even though the excess energy is smaller by 47 cm - 1 than that of the corresponding 14 111 state in C 6 H 6 the total density of background states is 60 l/cm - J and larger by a factor of 3. The blue edge ofthis band is shown in Fig. 13. To the blue of the rotationless origin it is seen that there is no remarkable contribution from the 14~ 1O~ band which is located 33.2 cm - J to the blue ofthe 14~ I~ band. We have not been able to analyze the rotational structure in Fig. 13 on the basis of a symmetrie rotor approximation. Only theJ = K lines which are the strongest lines in the isotropie Qbraneh seem to be in the neighborhood of the expected positions. We therefore concluded that this band is strongly perturbed due to couplings to the many background states. The line intensity distribution is shown in the upper part ofFig. 14. It results from the intensity statistics of74O lines which is a factor of 1.57 more than the total number oflines in the corresponding part of the fundamental band. The shape of the intensity distribution is quite different from the distribution ofthe 14~ fundamental band shown in Fig. 10. It displays no maximum at the intensity position (1 a.u.) expeeted for an unperturbed band. Instead, there is a monotonically increasing number of smaller lines. Only the very small
J. ehern. Phys., Vol. 89, No. 8, 15 October 1988 Downloaded 09 Oct 2008 to 129.187.254.47. Redistribution subject to AIP license or copyright; see http://jcp.aip.org/jcp/copyright.jsp
Sieber, Riedle, and Neusser: Rotationalline spectra. I
4631
Voo = 40733.84 (10)
U ~"-'
-II
I,J
I I -30
J I
I
~,
JllL 11 I1 IlJ !I UJ.l
III I
I
I
I
-10
-20
1 I
o
..J.
cm- 1
11.
I I I I [GHz] 10
FIG. 13. Part ofthe Ooppler-free two-photon speetrum ofthe Qbraneh in the 14~ l~ band in C.O •.
lines with an intensity smaller than 0.1 a. u. can be ascribed to the small contributions from the overlapping 14b band. This can be seen from a comparison of the upper part with the lower part in Fig. 14 which displays the intensity distri-
1m
300
C6D6
100 50
•
40 30 w 20
10
i..1...
0
0
=
2445 cm- 1
• 14 ....... • ..... • • •
• •• ••
Z
....J
..•
•••
cn H
E exc
1
1 01 0
300 w co 100 ~ :::> 50 z
CI:
bution oflines in the frequency range 0 to + 44.7 GHz to the blue of the rotationless origin, where only the 14b 1 band is present. The large number of low intensity lines and the increased total number of lines is expected for a strongly perturbed band. In Table 11, all experimental results and the theoretical results are summarized. It is interesting to see that the total counting rate varies for the different bands as they have been measured under different experimental conditions (laser power, etc.). The perfect theoretical simulation ofthe unperturbed bands is demonstrated by the good agreement of line numbers found in the frequency range under investigation for the experimental and the theoretical 14b spectrum of C 6 H 6 • The two bands 14b Ib 161 in C 6 H 6 and 14b 1b in C6 D 6 with the highest density of states (32 and 60 1/cm - I) displaya principally different line intensity distribution ''p''. Unperturbed bands have a peaked intensity distribution with one maximum ("rn") or two maxima ("2m") if two unperturbed bands are overlapping.
m
40 30
•
IV. SUMMARY AND CONCLUSION
20 10
o
0.5 1 1.5 2 2.5 NORMALIZED INTENSITY [a. u .]
FIG. 14. Intensity distribution oflines between 0 and - 120 GHz: Upper traee: In the Q braneh of the 14~ l~ band in C. 0 •. Lower trace: Of lines located to the blue ofthe rotationless origin ofthe 14~ l~ band. Only lines of the 14~ l~ band contribute. Note the change in the seale ofthe vertieal axis. For explanation of the intensity seale (horizontal axis) see the text.
Doppler-free two-photon spectroscopy provides complete1y resolved rotationalline spectra of vibronic bands of large polyatomic molecules. This makes the same precision in spectroscopy feasible which hitherto has only been possible for much smaller systems. 4 More important, a completely new situation arises which is typical for large systems with many vibrational degrees of freedom rather than for small molecules. In a large polyatomic system optically accessible light states with large Franck-Condon factors are embedded in a manifold of dark background states whose number is strongly increasing with excess energy. These background
J. ehern. Phys., Vol. 89, No. 8,15 October 1988 Downloaded 09 Oct 2008 to 129.187.254.47. Redistribution subject to AIP license or copyright; see http://jcp.aip.org/jcp/copyright.jsp
4632
Sieber, Riedle, and Neusser: Rotationalline spectra. I
states are sometimes coupled to the light states by short range higher order Coriolis and/or anharmonic couplings. They produce perturbations in the rotationalline spectrum of the light states. The degree of perturbance is expected to increase with the number of background states, i.e., with increasing vibrational excess energy. In this work we presented several completely resolved line spectra of vibronic bands at different excess energies in the SI state ofbenzene. The bands are perturbed to a different degree and assignment of the rotational structure is not always possible. For this reason a statistical procedure has been applied to the line spectra and the intensity distribution of the lines has been investigated. It is found that there is a strong correlation between the degree of perturbation and the shape ofthe line intensity distribution. Intensity distributions of weakly perturbed bands differ strongly from that of perturbed bands. It is concluded that line intensity distributions are a powerful tool for statistical spectroscopy. In particular, on the basis of a line intensity distribution, adecision can be made whether a complicated assignment procedure is reasonable for a band under investigation. Beyond that, it is interesting to discuss whether conc1usions on the regular or irregular character of a spectrum can be drawn from the line intensity distributions presented in this work. The usual way to obtain information on this property is a statistics ofline spacings. For an irregular spectrum a Wigner distribution and for a regular spectrum a Poisson distribution is expected. 7 ,8 This type of statistical analysis cannot be applied to the spectra of this work since the spectrum contains many rotational sequence bands. This is due to the population of several thousands of ground state rotationallevels at room temperature. The level spacing statistics would always lead to a Poisson distribution irrespective of the regularity or irregularity of the spectrum. A different situation is present for the line intensity statistics. For an irregular spectrum, a Porter Thomas37 distribution is expected. In order to obtain information on the degree ofirregularity, the line intensity distributions have to be compared with the theoretically predicted distribution. The theoretical procedure to investigate this question will be discussed in the subsequent part 11 of this work.
ACKNOWLEDGMENTS The authors are indebted to Professor Schlag for his permanent interest. They would like to thank Professor Levine for stimulatjng discussions and U. Schubert for performing part of the measurements. Financial support from the Deutsche Forschungsgemeinschaft is greatfully acknowledged. H.S. would like to thank the Hanns-Seidel-Stiftung for graduate support.
'For a review, see C. S. Parmenter, Faraday Discuss. Chem. Soc. 75, 7 (1983). 2E. Riedle, H. J. Neusser, and E. W. Schlag, J. Chem. Phys. 75,4231 (1981). 3E. Riedle and H. J. Neusser, J. Chem. Phys. 80, 4686 (1984). 4H. J. Neusser and E. Riedle, Comments At. Mol. Phys. 19, 331 (1987). SE. Riedle, H. Stepp, and H. J. Neusser, Chem. Phys. LeU. 110, 452 (1984). 6U. Schubert, F. Giesemann, E. Riedle, and H. J. Neusser (in preparation). 7R. D. Levine, Adv. Chem. Phys. 70, 53 (1987). 8Th. Zimmermann, L. S. Cederbaum, H.-D. Meyer, and H. Köppei, J. Phys. Chem. 91, 4446 (1987). 9H. L. Dai, C. L. Korpa, J. L. Kinsey, and R. W. Field, J. Chem. Phys. 82, 1688 (1985). 10J. P. Pique, Y. Chen, R. W. Field, and J. L. Kinsey, Phys. Rev. Leu. 58, 475 (1987). llE. Abramson, R. W. Field, D. Imre, K. K. Innes, and J. L. Kinsey, J. Chem. Phys. SO, 2298 ( 1984 ); 83, 453 ( 1985); R. L. Sundberg, E. Abramson, J. L. Kinsey, and R. W. Field, ibid. 83, 466 (1985). 12G. Persch, E. Mehdizadeh, W. Demtröder, Th. Zimmermann, H. Köppei, and L. S. Cederbaum, Ber. Bunsenges. Phys. Chem. 92, 312 (1988); Th. Zimmermann, H. Köppei, L. S. Cederbaum, G. Persch, and W. Demtröder, Phys. Rev. LeU. 61, 3 (1988). l3S. L. Coy, K. K. Lehmann, and F. C. DeLucia, J. Chem. Phys. 85, 4297 ( 1986); K. K. Lehmann and S. L. Coy, ibid. 83, 3290 ( 1985). 14E. P. Peyroula, R. Jost, M. Lombardi, and P. Dupre, Chem. Phys. 102, 417 (1986). ISD. R. Guyer, W. F. Polik, and C. B. Moore, J. Chem. Phys. 84, 6519 (1986). 16J. Kommandeur, L. W. Meerts, Y. M. Engel, and R. D. Levine, J. Chem. Phys. 88, 6810 (1988). 17L. Leviandier, M. Lombardi, R. Jost, andJ. P. Pique, Phys. Rev. Leu. 56, 2449 ( 1986); R. Jost and M. Lombardi, Lect. Notes Phys. 263, 72 ( 1986). 18J. H. Callomon, J. E. Parkin, and R. Lopez-Delgado, Chem. Phys. LeU. 13, 125 (1972). '~. Schubert, E. Riedle, H. J. Neusser, and E. W. Schlag, J. Chem. Phys. 84,6182 (1986). 2OW. Dietz and S. F. Fischer, J. Chem. Phys. 87, 249 (1987). 21y. M. Engel and R. D. Levine, J. Chem. Phys. 89, 4633 (1988). 22L. S. Vasilenko, V. P. Chebotayev, and A. V. Shishaev, JETP Leu. 12, 113 (1970). 2~. W. Hänsch and B. Couillaud, Opt. Commun. 35, 441 (1980). 24S. Gerstenkorn and P. Luc, Atlas du Spectre d 'Absorption de la Moleeule d'Iode (CNRS, Paris 1978). 2SS. Gerstenkorn and P. Luc, Rev. Phys. Appl. 14,791 (1979). 26L. Wunsch, F. Metz, H. J. Neusser, and E. W. Schlag, J. Chem. Phys. 66, 386 (1977). 27F. Metz, W. E. Howard, L. Wunsch, H. J. Neusser, and E. W. Schlag, Proc. R. Soc. London Ser. A 363,381 (1978). 28A. Sur, J. Knee, and P. Johnson, J. Chem. Phys. 77, 654 (1982). 2~. A. Stephenson, P. L. Radloft", and S. A. Rice, J. Chem. Phys 81, 1060 (1984). 3~. J. Robey and E. W. Schlag, J. Chem. Phys. 67, 2775 (1977). 31E. B. Wilson, Jr., J. C. Decius, and P. C. Cross, Molecular Vibrations (00ver, New York, 1980), p. ISS. 32E. Riedle, H. Sieber, and H. J. Neusser (in preparation). 33U. Schubert, E. Riedle, and H. J. Neusser, J. Chem. Phys. 84, 5326 (1986). 34Doppler-free spectra ofthe 14ö 16[ and 14ö lö 16[ band were measured in our laboratory and analyzed by L. Somers and J. H. Callomon (manuscript in preparation). 3sE. Riedle, Dissertation, TU München, 1984. 36J. H. Callomon, T. M. Dunn, and I. Mills, Philos. Trans. R. Soc. London Ser. A 259, 499 (1966). 37C. E. Porter and R. G. Thomas, Phys. Rev. 104, 483 (1956).
J. ehern. Phys., Vol. 89, No. 8, 15 October 1988 Downloaded 09 Oct 2008 to 129.187.254.47. Redistribution subject to AIP license or copyright; see http://jcp.aip.org/jcp/copyright.jsp