The task trial times are smaller in a simple fish-tank like desktop environment than in a more ... ical for exploring the structure of molecules: one atom se-.
IPT & EGVE Workshop (2005) R. Blach, E. Kjems (Editors)
Interacting with Molecular Structures: User Performance versus System Complexity R. van Liere1,3 , J.-B.O.S. Martens2 , A.J.F. Kok3 and M.H.A.V. van Tienen3 1 Center for Mathematics and Computer Science, CWI, Amsterdam Department of Industrial Design, Eindhoven University of Technology Department of Mathematics and Computer Science, Eindhoven University of Technology 2
3
Abstract Effective interaction in a virtual environment requires that the user can adequately judge the spatial relationships between the objects in a 3D scene. In order to accomplish adequate depth perception, existing virtual environments create useful perceptual cues through stereoscopy, motion parallax and (active or passive) haptic feedback. Specific hardware, such as high-end monitors with stereoscopic glasses, head-mounted tracking and mirrors are required to accomplish this. Many potential VR users however refuse to wear cumbersome devices and to adjust to an imposed work environment, especially for longer periods of time. It is therefore important to quantify the repercussions of dropping one or more of the above technologies. These repercussions are likely to depend on the application area, so that comparisons should be performed on tasks that are important and/or occur frequently in the application field of interest. In this paper, we report on a formal experiment in which the effects of different hardware components on the speed and accuracy of three-dimensional (3D) interaction tasks are established. The tasks that have been selected for the experiment are inspired by interactions and complexities, as they typically occur when exploring molecular structures. From the experimental data, we develop linear regression models to predict the speed and accuracy of the interaction tasks. Our findings show that hardware supported depth cues have a significant positive effect on task speed and accuracy, while software supported depth cues, such as shadows and perspective cues, have a negative effect on trial time. The task trial times are smaller in a simple fish-tank like desktop environment than in a more complex co-location enabled environment, sometimes at the cost of reduced accuracy. Categories and Subject Descriptors (according to ACM CCS): I.3.6 [Computer Graphics.]: Methodology and Techniques.Interaction Techniques I.3.7 [Computer Graphics.]: Three-Dimensional Graphics and Realism.Virtual Reality;
1. Introduction A key challenge facing designers of virtual environments is how to effectively interact with objects in 3D virtual space. In order to enable users to effectively locate and manipulate the objects in such a space, it is especially important to depict the spatial relationships between these objects, in particular with respect to depth. The visual cues that allow humans to perceive depth have been extensively documented in the perception and computer graphics literature, see e.g. [Kel93, WFG92]. The use of these cues, and their influence on the performance of interactive tasks also remains an ongoing c The Eurographics Association 2005.
topic of research in the VR community, [ABW93, BB97]. One problem with providing users with a range of depth cues is that the implementation of many of these cues requires cumbersome and special-purpose hardware. For example, providing active stereoscopic viewing requires the user to wear shutter glasses, providing motion parallax requires a sensor for tracking head positions, and providing solutions to problems caused by convergence/accommodation would even require an eye tracking device. Before deciding on such technologies, it is important for designers of virtual environments to understand the trade-offs involved. Indeed, the benefits of various depth cues come at a cost, both in
R. van Liere & J.-B.O.S. Martens & A. Kok & M. van Tienen / Interacting with Molecular Structures
Monitor
Camera Camera
Mirror
Monitor
VFP
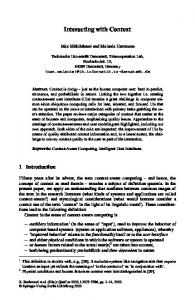
Figure 1: The Personal Space Station (left) and the Personal Action Space (right). The top row shows a schematic view of each system, the bottom row shows the prototypes used in the experiments.
terms of required hardware components and in terms of required user adjustment. Convincing (i.e., quantitative) arguments are therefore needed to weigh the pros and cons in any specific situation. The motivation of our study is to understand these tradeoffs in more detail for specific application scenarios. We have chosen structural biology as the application area, since the feedback that we have received from biologists in the past is that virtual reality techniques offer great potential for perceiving structure [LLM∗ 02]. However, almost all biologists refuse to wear the cumbersome VR equipment that is usually required today and most would prefer a VR environment that can be placed on their desktop, i.e., that would integrate well within their current work environment. This situation where potentially interesting technology is nev-
ertheless not well accepted has motivated us to set up a formal experiment that can provide more quantitative arguments for the discussion. More specifically, we selected three application-specific 3D interaction tasks that are typical for exploring the structure of molecules: one atom selection task, and two steering tasks. We studied the performance with which these tasks could be executed in two different desktop environments: a co-located mirror-based virtual reality environment and a more traditional fish-tank virtual environment. The tasks were also evaluated under conditions of varying depth cue information. More specifically, we compared depth cues that require hardware support to implement (shutter glasses for active stereoscopic rendering, head tracking for motion parallax) and depth cues that can be mimicked by software rendering alone (shadows and perspective cues). c The Eurographics Association 2005.
R. van Liere & J.-B.O.S. Martens & A. Kok & M. van Tienen / Interacting with Molecular Structures
The paper is organized as follows. In the next Section we provide a short description of the Personal Space Station and Personal Action Space. These are the two desktop environments that we have used in our study. In Sections 3 and 4, we describe the formal experimental study and analyze the data, respectively. Finally, the experimental findings are summarized and directions for future research are explored. 2. Personal Space Station and Personal Action Space From an apparatus point of view, there are three aspects that need to be distinguished when classifying and comparing virtual environments; i.e. the tracking of the 3D interaction elements used as input, the display of the 3D virtual information, and the application software that links the observed inputs to the displayed outputs. In this study we compare two VEs that share the same tracking and application layer, and that differ only in the output layer. In this way, it becomes possible to asses the effect of the output layer on the user interactions. 2.1. Tracking Both VEs aim at two-handed interaction in a 3D personal space that is within hands reach. Input devices, such as a pen for point selections and a cube to orient 3D models, allow users to manipulate 3D virtual objects. Input devices are tagged with infrared-reflecting markers, and are tracked in 3D by means of calibrated infrared stereo cameras, [LM03]. The tracking software can compute the pose of each device at approximately 30 times a second. The end-to-end latencies caused by the optical tracker are approximately 50-60 milliseconds, and the tracking accuracy is within 1 millimeter at the center of the interaction space. This accuracy gradually decreases near the corners of the workspace. The advantages of optical tracking are that it allows for simultaneous tracking of multiple wireless input devices, and is not susceptible to electromagnetic interference. The obvious disadvantage is that of occlusion; i.e. hands manipulating the input devices may block the line-of-sight of a camera, resulting in a (temporary) loss of the position and orientation of a device. Our experience with many different subjects is that they do require some explanation of this system characteristic, but that they quickly adjust their behavior to minimize such problems. 2.2. The Personal Space Station (PSS) The Personal Space Station (PSS), shown in the left panel of Figure 1, is a near-field VR system, [ML02]. Manipulation of virtual data is performed behind a mirror on which stereoscopic images of the 3D scene are reflected. The user’s head is tracked to ensure perspectively correct images, which is required to create the sensation of co-location between the physical interaction devices and the virtual objects that they control. c The Eurographics Association 2005.
The mirror reflects the display surface of the CRT monitor into a virtual focus plane (VFP) in front of the user (see schematic in figure 1). If co-located interaction is desired, then virtual objects should be drawn in the vicinity of the virtual focus plane. Drawing objects far away from the focus plane (e.g. too close to the user’s eyes) will result in accommodation-vergence problems which may lead to viewing problems such as blurred vision or fusion difficulties. As a rule of thumb, the monitor and mirror should be positioned in such a way that the virtual focus plane is located very close to where the interaction takes place, hence accommodation-vergence problems will be minimized. The PSS in our experiments is equipped with a 22’ CRT monitor which provides 1280x1024 pixels at 120Hz. For stereoscopic viewing, CrystalEyes shutter glasses are used. The pose of the user’s head is sampled at 60 Hz with a Logitech acoustical tracker. The monitor and mirror are positioned so that interaction can be performed comfortably; i.e. within arms reach and with elbows on the desktop. The PSS is similar to other mirror-based co-located systems as proposed by Schmandt, [Sch83]. The main difference is that most systems use a force feedback device, e.g. [WSS99, AW04], whereas we use multiple passive haptic feedback devices. 2.3. The Personal Action Space (PAS) The Personal Action Space (PAS), shown in the right panel of Figure 1, is a fish-tank desktop system. Manipulation of virtual data is performed in an interaction space above the desktop surface. A vertical display surface is placed in front of the user onto which stereoscopic images are drawn. The size of the display can vary from large (e.g. a projector) to small (e.g. a desktop monitor). The user’s head is tracked to ensure perspectively correct images. In the case of the PAS, virtual objects are also drawn in the vicinity of the virtual focus plane. Interaction is performed in front of the monitor and is not co-located. The PAS in our experiments is equipped with a 22’ CRT monitor which provides 1280x1024 pixels at 120Hz. For stereoscopic viewing, CrystalEyes shutter glasses are used. The pose of the user’s head is sampled at 60 Hz with a Logitech acoustical tracker. The monitor is positioned at approximately 75 cm from the user’s head. The interaction space was a 60x60x50 cm volume aligned with the table top and centered with the monitor. The interaction space was positioned such that interaction could be performed within the user’s arms reach. A 1-1 mapping was used to map the interaction space onto the visual space; i.e. 1 cm displacement of the physical input device corresponded to 1 cm displacement of its virtual representation. The PAS is similar to other fish-tank like systems as proposed by Ware, [WAB93]. The main difference is the usage
R. van Liere & J.-B.O.S. Martens & A. Kok & M. van Tienen / Interacting with Molecular Structures
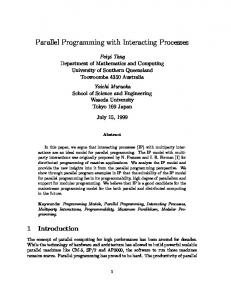
Figure 2: Visualization of the molecule without (left) and with colored shadows and stage (right).
of multiple passive haptic feedback devices, instead of mechanical or electromagnetic tracked interaction elements. 2.4. Visual Molecular Dynamics Interface Visual Molecular Dynamics (VMD) is a widely used molecular visualization program for displaying, animating, and analyzing large bio-molecular systems using 3D graphics and scripting [HDS96]. We have extended VMD to include the optically tracked interaction elements. Furthermore, we have included the option of showing the shadows of the molecules and the interaction elements on a planar stage positioned somewhere in the scene. The modified version of VMD hence allows 3D interaction with molecules. All experiments used the same visualization of a complex molecule, see Figure 2. The molecule, Chloroperoxidase from the fungus curvularia inaequalis [MW96], was provided to us by our collegues from the University of Amsterdam, who also suggested many interactive tasks on the structure. The molecule is visualized as a combination of ribbon and cartoon representations: the backbone as a blue ribbon, the beta sheets as yellow arrows and the alpha-helices as red spirals. The molecule was drawn such that the size was 20 cm on the display surface. The molecule is visualized at a fixed (center) position, while its orientation can be controlled by means of an interaction cube. A pen is used as selection/steering device. The tip size of the virtual pen can be varied to control the level of difficulty of the tasks. 3. Experiments 3.1. Conditions The following experimental conditions were tested: 1. PSS versus PAS The PSS provides users with access to virtual information by positioning the user’s hands within the virtual environment. The 3D interaction elements are co-located
with the virtual information they manipulate. For the PSS used in the experiments, the mirror is opaque. Hence, the user has only kinesthetic awareness of the interaction elements. The PAS promotes the idea of using interaction devices for manipulating objects in virtual environment that is observed from the outside. The 3D interaction elements are remote from the virtual information they manipulate. The user can observe the interaction elements and the hands. 2. Presence (H) or absence (nH) of hardware-supported depth cues Hardware supported depth cues include stereoscopic viewing and motion parallax. In order to accomplish stereo rendering, subjects need to wear shutter glasses. Motion parallax is provided by direct coupling of a head tracker with the camera position within VMD. Moving the head changes the view on the molecule. 3. Presence (S) or absence (nS) of software-supported depth cues Software-supported depth cues include a stage and projected shadows. The stage consists of a checkerboard at the bottom of the virtual environment. It serves as reference frame for the interaction space and should enhance depth perception. The stage was drawn such that the size was 60x60 cm on the display surface. For shadows A virtual light source is positioned above the molecule, and colored shadows were computed and displayed on the stage, see Figure 2. Shadows of the input devices are also drawn. Combining the H/nH condition with the S/nS condition leads to four conditions to be tested for each of the two systems (PSS/PAS). In all conditions, three levels of difficulty are created by varying the radius of the tip of the selection pen. The following three radii are used: 2, 3.5 and 5 millimeter. 3.2. Tasks We designed three different tasks with distinguishing characteristics. c The Eurographics Association 2005.
R. van Liere & J.-B.O.S. Martens & A. Kok & M. van Tienen / Interacting with Molecular Structures
Selection task The goal in the selection task is to select atoms in the molecule.
PAS. All subjects were experienced computer users (students).
At the start of a trial one alpha helix (red spiral in the visualization) is highlighted by displaying two green spheres with a radius of 3 millimeter at both ends of the helix. Timing starts when a subject touches one of these spheres with the pen, upon which the selected sphere disappears. The subject now has to select the other sphere as fast as possible. When selected the second sphere disappears, time is recorded, and a new trial starts.
Each subject performed all three tasks in all four conditions. The order of task was fixed: selection - helix - sheet. The order in which the subjects went through the four conditions (nH/nS, H/nS, nH/S, H/S) was randomized across subjects.
Only four of the helices in our molecule are used, resulting in distances between points to be selected from 8.3 to 10.1 centimeters. These four helices combined with the three levels of difficulty result in twelve trials (in semi-random order). Sheet steering task The goal of the sheet steering task is to trace a curved path within the molecule. At the start of a trial in this task one beta sheet (yellow arrow in the visualization) is highlighted by displaying two green spheres with a radius of 3 millimeter at both ends of the sheet. Timing starts when the subject touches one of these spheres, upon which the selected sphere disappears. The subject now has to trace a path over the beta sheet to the other end point, as accurately as possible. This means that at all times, the tip of the pen should stay in touch with the yellow arrow. As beta sheets are not planar, the path to be followed is not a straight line, but contains one or more curves. When the sphere at the other end of the beta sheet is selected, it disappears, time is recorded, and a new trial starts. Only four of the beta sheets in our molecule are used, resulting in (curved) path lengths varying from 4.3 to 5.6 centimeters. These four sheets combined with three levels of difficulty result in twelve trials (in semi-random order). Helix steering task The goal of the helix steering task is to trace a straight path within the molecule. At the start of a trial, one alpha helix is highlighted using the same mechanism as in the case of the selection task. Timing starts when the subject touches the sphere at one of the ends of the helix, upon which the selected sphere disappears. The subject now has to trace a path through the helix to the other end point, as accurately as possible. This means that at all times, the tip of the pen should stay completely within the red spiral. When the second sphere is selected, it disappears, time is recorded, and a new trial starts. The same four helices as in the case of the selection task are used. These four helices combined with three levels of difficulty result in twelve trials (in semi-random order). 3.3. Subjects Twenty subjects participated in the experiment. Ten subjects performed the experiments with the PSS and ten with the c The Eurographics Association 2005.
3.4. Procedure Before the actual experiment started, subjects were instructed about what they were expected to do during the experiment. Subjects were shown how they could rotate the molecule and how they could use the pen to make selections. On indication that they knew how to manipulate the pen and rotate the molecule, a training session was started. In this session all three tasks were performed, and, whenever needed, instructions were provided on how to best perform the tasks. During the training session, the subject could explore how to perform the tasks most conveniently. After the training session, the three tasks were performed in all four conditions. At the start of a task, the user was instructed whether to do the task as fast as possible (selection task) or as accurate as possible (helix and sheet steering tasks). Times for each trial (time between selection of first and second sphere) within a task were recorded. In addition, for steering tasks, we have defined an accuracy measure as the average error between the target and the pen during the trial. For the sheet steering task, the average error is defined as the average Euclidian distance between the surface of the sphere on the pen tip and the closest point on the beta sheet. In case of the helix steering task, average error is defined as the Euclidian distance between the point on the surface of the sphere on the pen tip that is furthest removed from the axis of the helix to the (cylindrical) outer surface of the helix (this distance is hence zero if the sphere is within the helix). 4. Results In each of the three experiments (i.e., point selection, and sheet and helix steering), we collected 960 trials. Ten subjects performed the experiments on the PSS, while ten other subjects performed identical experiments on the PAS. The 48 trials of a single subjects consisted of 4 sets of 12 trials. The 4 sets corresponded to the four possible combinations of hardware-supported depth cues (stereo and head tracking) and software-supported depth cues (shadows and perspective). The 12 trials within a set contained 4 interaction tasks for each of the three different tip sizes (of 2, 3.5 and 5 mm). This tip size was the major factor influencing the difficulty of the task. The experimental data for different tip sizes will therefore be analyzed separately. Statistical analysis of the time duration T revealed that
R. van Liere & J.-B.O.S. Martens & A. Kok & M. van Tienen / Interacting with Molecular Structures Selection task - time 3 2.5
Time (in sec)
2 1.5 1 0.5 0 PSS-nH/nS PSS-H/nS PSS-nH/S
PSS-H/S PAS-nH/nS PAS-H/nS PAS-nH/S
PAS-H/S
Sheet task - time 5
4
Time (in sec)
log T could be approximated well by a Gaussian distribution for all tasks, in all conditions. From the estimated standard deviation of log T a 95% confidence interval could be constructed for the average log T , using the t-distribution [DS01]. The average values and the confidence intervals on log T were subsequently mapped to duration T to allow for an easy interpretation of the results. The top panel of figure 3 summarizes the results for the "selection" task. One can observe 8 clusters of three data points, with 95% uncertainty intervals for the estimated means. The 4 leftmost clusters correspond to the 4 different combinations of depth cues in the PSS, while the 4 rightmost clusters correspond to similar combinations in the PAS. The three data points within a cluster are for the different tip sizes. The tip sizes of 2, 3.5 and 5 mm are represented by the leftmost, middle and rightmost points in a cluster, respectively. Corresponding plots for the "sheet" steering task and the "helix" steering task can be found in the other panels of figure 3.
3
2
1
The effect of the different factors on the task trial times can most easily be described by a linear regression model. More specifically, it was established that the following model
0
PSS-nH/nS PSS-H/nS
PSS-nH/S
PSS-H/S
PAS-nH/nS PAS-H/nS
PAS-nH/S
PAS-H/S
PAS-nH/S
PAS-H/S
Helix task - time 7 6
log T = log To + log fH · H + log fS · S + log fM · M (1)
or equivalently,
Time (in sec)
+ log fHS · HS,
5 4 3 2 1
H
S
M
T = To · ( fH ) · ( fS ) · ( fM ) · ( fHS )
HS
,
(2)
provided a good description for the trial times for all three different tip sizes. The parameters in this model are defined as follows: • To is the average duration in the PSS condition without any depth cues, • fH is the trial time reduction factor resulting from hardware-supported depth cues, • fS is the trial time reduction factor resulting from software-supported depth cues, • fM is the reduction factor caused by moving from the PSS to the PAS, • fHS describes the interaction between both kinds of depth cues, • H is 1 in case of hardware-supported depth cues (H), 0 otherwise (nH) • S is 1 in case of software-supported depth cues (S), 0 otherwise (nS) • M is 1 in case of the PAS, and 0 in case of the PSS. We did not only estimate the regression variables themselves but also their 95 % confidence intervals (indicated by [low,high] in the tables). The results are summarized in table 1 for the "selection", "sheet" and "helix" experiments, respectively.
0
PSS-nH/nS PSS-H/nS
PSS-nH/S
PSS-H/S
PAS-nH/nS PAS-H/nS
Figure 3: Average trial times across subjects, with 95% confidence intervals, for the three tasks: selection (top), sheet steering (middle) and helix steering (bottom). The independent variable indicated along the abscissa encodes the 8 different experimental conditions that were created by varying between two systems (PSS versus PAS), and by controlling hardware (yes (H) or no (nH)) and software (yes (S) or no (nS)) depth cues. For each of these 8 conditions there are 3 data points, corresponding to the three different pen tip sizes of 2, 3.5 and 5mm (from left to right).
In case of the "selection" and the "sheet" experiment, the interaction task becomes easier as the tip size increases, and the corresponding trial time (To ) hence decreases with tip size. In case of the "helix" task, increasing tip sizes result in a more difficult task. Somewhat unexpectedly, varying tip size has however little or no effect on the duration of the interaction in the "helix" experiment. As expected, we obtain a significant effect of hardware-supported depth cues in all cases. The reduction factor f H varies between 0.77 and 0.90. Only in a few cases do we observe a (slightly) significant effect of software-supported depth cues. In case of significant effects, c The Eurographics Association 2005.
R. van Liere & J.-B.O.S. Martens & A. Kok & M. van Tienen / Interacting with Molecular Structures
It was established that the following model
Sheet task - error 2.5
Error (in mm)
2
log D = log Do + log dH · H + log dM · M + log dHSM · HSM,
1.5
1
(3)
or equivalently,
0.5
0 PSS-nH/nS PSS-H/nS PSS-nH/S
PSS-H/S PAS-nH/nS PAS-H/nS PAS-nH/S
PAS-H/S
Helix task - error
3.5
Error (in mm)
3 2.5 2 1.5 1 0.5 PSS-H/S PAS-nH/nS PAS-H/nS PAS-nH/S
PAS-H/S
Figure 4: Average error across subjects, with 95% confidence intervals, for the two steering tasks with the sheet (top) and the helix (bottom). The coding of the independent conditions is identical to that in figure 3.
the reduction factor f S is however larger than 1, indicating that such depth cues increase rather than decrease the duration of the interaction. In cases where f HS is significantly different from 1, it is also greater than 1. This demonstrates that software-supported depth cues are even more harmful when used in combination with hardware-supported depth cues than in cases where such cues are absent. Finally, there is also a significant difference between the PSS and the PAS systems for the steering tasks, where the reduction factor f M varies between 0.77 and 0.83. It is well known that people can trade time versus accuracy in an interaction task (as is for instance expressed in the familiar Fitts’ law). Therefore, in order to better understand the performance of subjects within the different interaction tasks, we need to also analyze this accuracy. Since there is as yet no widely accepted metric for measuring the accuracy for 3D interaction tasks, we have adopted as accuracy measure the average error (D) between the virtual pen tip and the target. Statistical analysis of the average error D revealed that log D could be more closely approximated by a Gaussian distribution than D itself. The average values and the 95% confidence intervals on log D were mapped to error D to allow for an easy interpretation of the results. Figure 4 summarizes the results for the "sheet" and the "helix" steering task, respectively. c The Eurographics Association 2005.
(4)
provides a good description for the accuracy measure for all three different tip sizes. The parameters in this model are defined as follows:
4
0 PSS-nH/nS PSS-H/nS PSS-nH/S
D = Do · (dH )H · (dM )M · (dHSM )HSM ,
• Do is the average error in the PSS condition without any depth cues, • dH is the error reduction factor resulting from hardwaresupported depth cues, • dM is the error reduction factor caused by moving from the PSS to the PAS, • dHSM describes the interaction between both kinds of depth cues on the PAS, We did not only estimate the regression variables themselves but also their 95 % confidence intervals. The results are summarized in table 2 for the "sheet" and "helix" experiments, respectively. In case of the "sheet" experiment, the interaction task becomes easier as the tip size increases, and the corresponding error (Do ) hence decreases with tip size. In case of the "helix" task, increasing tip sizes result in a more difficult task. As expected, we obtain a significant effect of hardwaresupported depth cues in all cases. The reduction factor dH varies between 0.21 and 0.83. There is also a significant difference between the PSS and the PAS systems for most of the interaction tasks. The reduction factor dM varies between 1.28 and 7.76, which illustrates that the accuracy is significantly less in the PAS than in the PSS. Note that there was no primary effect of software-supported depth cues (S) on the accuracy. In order to visualize the trade-off between trial time and accuracy, we have plotted one against the other in Figure 5 for the condition that only hardware-supported depth cues are provided (H/nS). Points in the plot represent the relation between time and accuracy with their confidence intervals (open boxed points are data taken from the PSS, diagonal crossed points are data taken from the PAS). The three different points on a single solid line correspond to the three different pen tip sizes. Solid lines connecting corresponding points show the relation between speed and accuracy within one environment. Dashed lines connecting corresponding points show the relation between speed and accuracy for a fixed pen tip size but across environments. Especially in the sheet task (left plot), the PAS (without co-location) seems to invite a faster interaction with a lower accuracy. The helix task
R. van Liere & J.-B.O.S. Martens & A. Kok & M. van Tienen / Interacting with Molecular Structures
hardware components and in terms of required user adjustment. It is therefore important to quantify the repercussions of dropping one or more of the above hardware technologies. In this paper, we have reported on a formal experiment in which the effects of different hardware components on the speed and accuracy of three-dimensional (3D) interaction tasks with molecular structures are established. We selected three application-specific 3D interaction tasks that are typical for exploring the structure of molecules: a point selection task (atom picking), a curved path tracing task (sheet steering), and a straight path tracing task (helix steering). From the experimental data, we have developed linear regression models to predict the speed and accuracy for the three interaction tasks.
Sheet task - error vs time (log scale) 0.2 0
Log error (in mm)
-0.2 -0.4 -0.6 -0.8 -1 -1.2
0.3
0.35
0.4 0.45 0.5 Log time (in sec)
0.55
0.6
Helix task - error vs time (log scale) 0.5
Log error (in mm)
0
-0.5
-1
-1.5
-2
0.4
0.45
0.5 0.55 0.6 Log time (in sec)
0.65
0.7
Figure 5: Trial time versus average error characteristics for three levels of difficulty. Points in the plot represent the relation between time and accuracy, the 95% confidence intervals are also shown. The PAS (leftmost curves diagonal crossed points) and the PSS (rightmost curves with open box points) is given, under the condition of only hardwaresupported depth cues (H/nS). The two figures relate to the sheet task (top) and the helix task (bottom).
seems to be more compelling, in the sense that the obtained accuracies are comparable in both systems. Despite this, the PAS system is still significantly faster than the PSS system. 5. Discussion and Conclusions Effective interaction in a virtual environment requires that the user can adequately judge the spatial relationships between the objects in a 3D scene. However, the benefits of various depth cues come at a cost, both in terms of required
We now discuss the most important conclusions from the experiments, and hypothesize about the possible causes of the effects that are observed: • As expected, the hardware-supported depth cues (stereoscopic viewing, motion parallax) contribute significantly to task performance. The related reduction factors, f H in table 1 and dH in table 2, indicate that hardware stereo and head tracking can reduce trial times by a factor of up to 25% and improve accuracy by a factor of 20% for steering tasks. This is compatible, both qualitatively and quantitatively, to the results reported by Arsenault and Ware for a tapping task with a high index of difficulty, [AW04]. In this study, we have not examined the relative importance of stereo and head tracking. • Surprisingly, the software-supported depth cues (shadows and perspective viewing) do not contribute to speed and accuracy ( f S > 1.0 and f HS > 1.0 in table 1 whenever significant). The reason for this may be related with the findings of Hubona, who state that many shadows have negative impact on task performance compared with only small number of shadows, [HWSB99]. In the future we plan to simplify the shadow rendering, so that only shadows of the relevant objects, such as device, target objects, and molecular backbone representations, are projected. There might also be perceptual and cognitive reasons why the software-supported depth cues are not effective. Perceptually, it is not possible to keep both the target molecule and the depth cues (such as the shadows) within foveal vision, so that the shadows will be perceived with low accuracy while focusing on the molecule (an often-used relationship between visual acuity a, in arcmin, and eccentricity e, in degrees of visual angle, is: a = 0.23·e+0.7, which implies a reduction in acuity from 0.7 arcmin to 1.85 arcmin for the 5 degree separation that is typical for our experimental set-up). Also cognitively, the focus of attention that determines which part of the visual field is analyzed in detail, also needs to shift back and forth between the active area in the molecule and the background, where the software-supported depth cues are c The Eurographics Association 2005.
R. van Liere & J.-B.O.S. Martens & A. Kok & M. van Tienen / Interacting with Molecular Structures
projected. This switching obviously requires time and effort that the subjects may not be willing to invest. • Users in the fish-tank like environment (PAS) performed no worse than users in the co-located environment (PSS) for steering tasks. Figure 5 shows that, for the sheet task, trial time is shorter in the PAS at the cost of reduced accuracy. For the helix task, PAS is faster without loss of accuracy. One potential advantage of the PAS over the PSS is the fact that the users can adopt a more comfortable position with their arms. In the case of the PAS, the interaction space can be positioned in a way that users can place their arms so that they rest comfortably on the table, and hence provide a stable reference frame for the molecular interaction. In the co-located PSS setup, on the other hand, the interaction space is fixed around the virtual focus plane (see diagrams in figure 1). In this case, users will have to stretch out their arms to reach sufficiently far behind the mirror, which may create more tension on the muscles in the upper arms and neck. This not only creates a less comfortable position, but may also result in a less stable reference frame during the interaction. The design of the PSS does allow the virtual focus plane to be repositioned for individual users, but this would require a time consuming calibration of the interaction and visual spaces. In the future we plan to examine the tracking data gathered during the experiments to see if there is indeed more instability in the position of the molecule during pen movements in case of the PSS than in case of the PAS. References [ABW93] A RTHUR K., B OOTH K., WARE C.: Evaluating 3D task performance for fish tank virtual worlds. ACM Transactions on Information Systems 11, 3 (July 1993), 239–265. [AW04] A RSENAULT R., WARE C.: The importance of stereo and eye-coupled perspective for eye-hand coordination in fish tank vr. Presence 13, 5 (2004), 549–559. [BB97] B ORITZ J., B OOTH K. S.: A study of interactive 3D point location in a computer simulated virtual environment. In ACM Symposium on Virtual Reality Software and Technology (1997), pp. 181–187. [DS01] D RAPER N., S MITH H.: Applied Regression Analysis. John Wiley and Sons, 2001. [HDS96] H UMPHREY W., DALKE A., S CHULTEN K.: Vmd - visual molecular dynamics. Journal of Molecular Graphics 14, 1 (1996), 3–38. [HWSB99] H UBONA G., W HEELER P., S HIRAH G., B RANDT M.: The relative contributions of stereo, lighting, and background scenes in promoting 3d depth visualization. ACM Transactions on Computer-Human Interaction 6, 3 (July 1999), 214–242. c The Eurographics Association 2005.
[Kel93] K ELSEY C.: The Perception of Visual Information. Springer-Verlag, 1993, ch. Detection of visual information, pp. 30–51. [LLM∗ 02]
L IERE R., L EEUW W., M ULDER J., V ER P., V ISSER A., M ANDERS E., D RIEL R.: Virtual reality in biological microscopic imaging. In Proceedings of the IEEE International Symposium on Biomedical Imaging 2002 (2002). SCHURE
[LM03] L IERE R., M ULDER J.: Optical tracking using projective invariant marker pattern properties. In Proceedings of the IEEE Virtual Reality Conference 2003 (2003), pp. 191–198. [ML02] M ULDER J., L IERE R.: The personal space station: Bringing interaction within reach. In VRIC 2002 Conference Proceedings (2002), pp. 73–81. [MW96] M ESSERSCHMIDT A., W EVER R.: X-ray structure of a vanadium-containing enzyme: Chloroperoxidae from the fungus curvularia inaequalis. Biochemistry 93, 1 (January 1996), 392–396. [Sch83] S CHMANDT C.: Spatial input/display correspondence in a stereoscopic computer graphic work station. Computer Graphics 17, 3 (1983), 253–261. [WAB93] WARE C., A RTHUR K., B OOTH K.: Fish tank virtual reality. In INTERCHI ’93 Conference Proceedings (1993), Ashlund S., Mullet K., Henderson A., Hollnagel E.„ White T., (Eds.), pp. 37–42. [WFG92] WANGER L., F ERWERDA J., G REENBERG D.: Perceiving spatial relationships in computer-generated images. IEEE Computer Graphics and Applications 12, 3 (1992), 44–58. [WSS99] W IEGAND T., S CHLOERB D., S ACHTLER W.: Virtual workbench: Near field virtual environment system with applications. Presence 8, 5 (1999), 492–519.
R. van Liere & J.-B.O.S. Martens & A. Kok & M. van Tienen / Interacting with Molecular Structures
select 2.0 mm estimate low high 3.5 mm estimate low high 5.0 mm estimate low high sheet 2.0 mm estimate low high 3.5 mm estimate low high 5.0 mm estimate low high helix 2.0 mm estimate low high 3.5 mm estimate low high 5.0 mm estimate low high
To
fH
fS
fHS
fM
2.06 1.87 2.27
0.765 0.678 0.864
1.020 0.904 1.152
1.305 1.099 1.550
1.104 1.014 1.205
1.84 1.67 2.02
0.817 0.724 0.922
1.058 0.938 1.194
1.151 0.971 1.365
1.044 0.959 1.137
1.71 1.57 1.86 To
0.841 0.755 0.937 fH
1.040 0.934 1.158 fS
1.211 1.040 1.410 fHS
1.008 0.934 1.087 fM
4.24 3.86 4.65
0.815 0.725 0.917
1.046 0.930 1.177
1.186 1.004 1.402
0.785 0.722 0.853
3.55 3.26 3.85
0.901 0.811 1.002
1.159 1.043 1.288
1.007 0.868 1.170
0.774 0.718 0.834
3.14 2.85 3.46 To
0.869 0.768 0.983 fH
1.149 1.015 1.299 fS
1.088 0.914 1.295 fHS
0.803 0.736 0.876 fM
4.80 4.33 5.31
0.819 0.720 0.934
1.206 1.060 1.372
1.009 0.841 1.211
0.825 0.753 0.904
4.94 4.48 5.45
0.775 0.685 0.878
1.096 0.968 1.241
1.100 0.923 1.310
0.805 0.737 0.879
4.82 4.29 5.42
0.777 0.670 0.900
1.080 0.931 1.251
1.191 0.967 1.468
0.800 0.721 0.888
sheet 2.0 mm estimate low high 3.5 mm estimate low high 5.0 mm estimate low high helix 2.0 mm estimate low high 3.5 mm estimate low high 5.0 mm estimate low high
Do
dH
dM
dHSM
1.02 0.85 1.23
0.828 0.659 1.040
1.547 1.231 1.945
1.336 0.920 1.941
0.55 0.39 0.76
0.532 0.354 0.799
1.278 0.850 1.920
2.034 1.046 3.956
0.04 0.02 0.09 Do
0.254 0.081 0.789 dH
4.542 1.458 14.148 dM
0.492 0.077 3.143 dHSM
0.20 0.08 0.46
0.211 0.075 0.593
7.756 1.433 41.982
0.945 0.336 2.658
1.16 0.77 1.75
0.478 0.290 0.787
3.595 1.592 8.122
0.747 0.453 1.230
2.78 2.28 3.39
0.626 0.491 0.797
2.103 1.417 3.122
0.880 0.691 1.121
Table 2: Estimated regression parameters for average error, following equations (3) and (4). The 95% confidence intervals for the parameter estimates are indicated by [low,high]. The two tables correspond to the sheet steering task (top) and the helix steering task (bottom). The three separate rows within a table correspond to the three indices of difficulty, resulting from pen tip sizes equal to 2, 3.5 and 5 mm, respectively.
Table 1: Estimated regression parameters for trial times, following equations (1) and (2). The 95% confidence intervals for the parameter estimates are indicated by [low,high]. The three tables correspond to the selection task (top), the sheet steering task (middle), and the helix steering task (bottom). The three separate rows within a table correspond to the three indices of difficulty, resulting from pen tip sizes equal to 2, 3.5 and 5 mm, respectively.
c The Eurographics Association 2005.