S C I E N C E ’ S C O M PA S S Hansen et al. (1) present beautiful high-resolution transmission electron microscopy (TEM) images obtained in the presence of reactant gases. These images help explain how this important catalytic promoter works. Key to their success is the use of in situ, high-resolution TEM and the correlation of this structural information with kinetic data. The authors show that conventional ex situ TEM (where the sample is studied in high vacuum) fails miserably in this respect because the surface structure of the catalyst is completely different in vacuum. In the absence of reactant gases, the barium phase does not appear to wet the catalytic Ru particles, which are instead blanketed by several layers of the boron nitride support. When the reactant gases are present at moderate pressure, this boron nitride blanket becomes unstable and disappears, being replaced by an oxygen-containing monolayer surface phase of barium. This structure helps to explain how the Ba promoter enhances the activity of the Ru. The authors argue convincingly that promotion must be due to an electronic effect of the surface Ba phase on the nearby surface Ru sites. Such an electronic mechanism was proposed previously to explain promotion of catalysts by alkali and alkaline earth elements (3, 7) and is supported by theoretical studies (6, 7). However, it was inconsistent with the surface structure observed with ex situ TEM. In thus clarifying the
role of the Ba promoter, Hansen et al. solve an important problem in catalysis and reveal how others may be tackled. The study highlights the importance of in situ catalyst characterization for understanding catalytic processes. Others have demonstrated the importance of in situ electron microscopy (8), although not with the atomic resolution achieved by Hansen et al. (1), who followed the pioneering approach of Gai and Boyes (9, 10). Many seminal advances in understanding catalysts were made with ex situ surface characterization tools, including important contributions from ex situ TEM to our understanding of ammonia synthesis (5) and other catalytic reactions (11, 12). These studies were successful because some details of the catalyst structure did not change upon removal of the reactant gases. However, this will not generally be the case. Just as silver converts from metallic Ag to solid Ag2O as the oxygen pressure above it increases, so too can we expect that the species present on a catalyst’s surface convert between different phases as the pressure of the reactants increases. Such phases can only be characterized with in situ surface characterization. Many surface characterization tools now allow in situ characterization (that is, in the presence of reactant gases and at high temperatures) (13, 14). Besides the beautiful TEM example discussed above, exciting results have appeared recently using in situ scanning tunneling microscopy,
sum frequency generation, and infrared spectroscopy (15–19). This promises exciting advances in the next few years in our understanding of catalysis. I look forward to the day when we can continue to improve catalysts while routinely working in the confidence provided by in situ surface characterization. References 1. T. W. Hansen et al., Science 294, 1508 (2001). 2. R. Schloegl, in Handbook of Heterogeneous Catalysis, vol. 4, G. Ertl, H. Knözinger, J. Weitkamp, Eds. (VCH, Weinheim, Germany, 1997), pp. 1697–1746. 3. G. Ertl, S. B. Lee, M. Weiss, Surf. Sci. 114, 527 (1982). 4. G. A. Somorjai, N. Materer, Top. Catal. 1, 215 (1994). 5. G. Weinberg et al. , Appl. Catal. A Gen. 163, 83 (1997). 6. N. D. Lang, S. Holloway, J. K. Norskov, Surf. Sci. 150, 24 (1985). 7. H. P. Bonzel, A. M. Bradshaw, G. Ertl, Eds., Physics and Chemistry of Alkali Metal Adsorption (Elsevier Science, Amsterdam, 1989). 8. N. M. Rodriguez, S. G. Oh, R. A. DallaBetta, R. T. K. Baker, J. Catal. 157, 676 (1995). 9. E. D. Boyes, P. L. Gai, Ultramicroscopy 67, 219 (1997). 10. P. L. Gai, Adv. Mater. 10, 1259 (1998). 11. A. K. Datye, in Handbook of Heterogeneous Catalysis, vol. 3, G. Ertl, H. Knözinger, J. Weitkamp, Eds. (VCH, Weinheim, Germany, 1997), pp. 493–512. 12. A. K. Datye et al ., Appl. Catal. A Gen. 198, 179 (2000). 13. N. I. Jaeger, Science 293, 1601 (2001). 14. Special issue on in situ surface characterization of catalysts, Top. Catal. 15 (no. 1) (2001). 15. A. Kolmakov, D. W. Goodman, Surf. Sci. 490, L597 (2001). 16. C. Sachs, M. Hildebrand, S. Volkening, J. Wintterlin, G. Ertl, Science 293, 1635 (2001). 17. K. B. Rider, K. S. Hwang, M. Salmeron, G. A. Somorjai, Phys. Rev. Lett. 86, 4330 (2001). 18. T. Dellwig, G. Rupprechter, H. Unterhalt, H. J. Freund, Phys. Rev. Lett. 85, 776 (2000). 19. K. R. McCrea, G. A. Somorjai, J. Mol. Catal. A Chem. 163, 43 (2000).
PERSPECTIVES: GEOLOGY
Interactions Between Ridges and Plumes Jean-Paul Montagner and Jeroen Ritsema
hen geological surveys were limited to continents, geological studies aimed to understand objects such as mountain ranges and sedimentary basins. Plate tectonics provides a well-established theory of volcanism at mid-ocean ridges and subduction zone regions, and is intimately related to largescale convection in Earth’s mantle. In contrast, mantle plumes, which may give rise to intraplate volcanism, have remained enigmatic geological objects. It remains unclear how plumes are formed and
W
1472
J.-P. Montagner is in the Department of Seismology, Institute of Physics of the Globe, Paris 75252, France. E-mail:
[email protected] J. Ritsema is in the Seismological Laboratory, California Institute of Technology, Pasadena, CA 91105, USA.
whether they act independently from plate tectonics. Earth scientists may learn about the role of plumes in mantle dynamics by studying their interactions with the lithosphere and crust below ridges and the way in which they perturb flow patterns in the uppermost mantle (1). The mantle plume model was first proposed by Morgan (2) to explain the systematic northwesterly age progression of volcanoes of the Hawaiian-Emperor chain (3). Morgan defined the mantle plume as a temperature anomaly below the overriding plate, but laboratory experimentalists and computer modelers soon gave the plumes a well-defined shape. They envision plumes to consist of narrow tails (plume conduits) and mushroom heads (plume heads) that ascend from a low-vis-
16 NOVEMBER 2001
VOL 294
SCIENCE
cosity thermal boundary or the transition zone layer (possibly the core-mantle boundary) in the deep mantle. Plumes transport less than 10% of the total heat from the deep mantle, but their role in geological and biological processes at Earth’s surface may be very important. Continental breakup, flood basalt eruptions, mid-ocean ridge formation, and extinction of species may be the result of plume heads impinging upon Earth’s lithosphere (4–7). Some Earth scientists even claim that plume tectonics might be as fundamental as plate tectonics (8). Others relate continental breakup and intraplate volcanism entirely to preexisting weaknesses in oceanic plates and continents and do not see a role for deep mantle plumes (9). In these “nonplume” models, edge-driven convection (10) is invoked to explain the formation of flood basalts provinces and intraplate volcanism at African and Atlantic hot spots (11). Detections of plumes in geophysical and geochemical data are controversial and trigger vigorous debates. However, measurements of interactions between a plume and a ridge can help to discriminate between plume and nonplume scenarios. Many hot
www.sciencemag.org
Downloaded from www.sciencemag.org on November 30, 2007
65 64 63 62 61 60 59 58 57 56 55 54 53 52 51 50 49 48 47 46 45 44 43 42 41 40 39 38 37 36 35 34 33 32 31 30 29 28 27 26 25 24 23 22 21 20 19 18 17 16 15 14 13 12 11 10 9 8 7 6 5 4 3 2 1
0˚
330˚
0˚
0 100 200
Depth (km)
300 400 500 600 700 800 -5%
900
δVS
+5%
1000 0
10 20 30 40 50 60 70 80 90 100 110 120 130 140 150 160 170 180 190 200
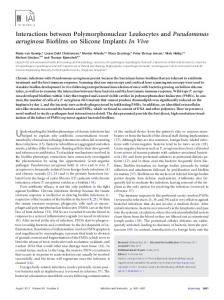
Distance along Mid-Atlantic Ridge ( ) Beneath the Mid-Atlantic Ridge. Modeled (18) shear velocities (bottom) along a cross section along the Mid-Atlantic Ridge from the South Atlantic to the Arctic Ocean (top). Circles on the ridge (green line) mark 10° intervals. Triangles mark hot spots. Low shear velocities relative to the global average are represented by shades of red, with an intensity proportional to the magnitude of the anomaly. These anomalies mainly correspond to elevated temperatures with respect to the ambient mantle. Low seismic velocity anomalies beneath the ridge and hot spots in the Atlantic Ocean are confined to the upper 150 km of the mantle (dashed line), with the exception of Iceland.
spots—such as Iceland, the Azores, and Tristan in the mid-Atlantic—are located on or close to a mid-ocean ridge; the plume beneath Hawaii now lies in the middle of the Pacific Plate but may have interacted strongly with a ridge early in its evolution (12). The earliest studies of ridge-plume interactions demonstrated that a plume and a ridge can interact over distances of more than 1000 km (13, 14). In the classical source-sink model (14), plume and ridge interact via a sublithospheric channel; as the plume (or ridge) migrates, the ridge is fed through this channel. Since the first numerical modeling of plume-ridge interaction dynamics (15), the latest simulations consider a radially expanding and pulsating plume model and allow for plume flux estimates (16). They are able to explain, for instance, the V-shaped gravity anomalies over the Reykjanes Ridge. To understand whether plumes take an active or passive role and how they interact with mid-ocean ridges and lithosphere far away from plate boundaries, we need to know the depth extent of mantle upwelling beneath hot spots. Seismological analyses
help to provide the answer because melt production, crustal thickness, and sublithospheric flow all leave a seismic signature. Models of seismic anisotropy can be used to infer the flow geometry in Earth’s interior because the fast axis of olivine (a key mantle mineral) tends to align in the flow direction (17). Mapping the three-dimensional isotropic seismic velocity structure of plumes at depth remains a challenging task, however (18). Plume conduits may be very narrow (100 km) and cannot easily be detected. In addition, temperature and vertical alignment of olivine crystals have opposite effects on vertical seismic waves. To date, most seismic models are isotropic, but a first attempt (1) to relate seismic anisotropy to plume-ridge interactions looks very promising. A recent global-scale tomographic model (see the figure) (19) suggests that low seismic velocity anomalies beneath the Mid-Atlantic Ridge and hot spots in the Atlantic Ocean are confined to the upper 150 km of the mantle, with the exception of Iceland. Low velocities beneath Iceland extend well into the upper mantle transition zone. A comparable anomaly is seen in high-res-
www.sciencemag.org
SCIENCE
VOL 294
olution regional tomographic models (20). Global models of seismic anisotropy (21) still lack the resolution required for precise mapping of flow patterns around plumes, but Gaherty (1) was able to derive an average model of radial anisotropy for the MidAtlantic Ridge south of Iceland. Assuming that deformation does not occur under water-rich conditions (22), his model suggests vertical flow below the shallowest (