distraction and concentration (i) in connection with common experience of expectation of recognition and (ii) in connection with recent T-maze experiments on ...
Proc. Nadl. Acad. Sci. USA Vol. 87, pp. 7110-7114, September 1990 Neurobiology
Interactions of neural networks: Models for distraction and concentration (neuronal group interaction/projection/attention/neural computing)
Lipo WANG AND JOHN Rosst Department of Chemistry, Stanford University, Stanford, CA 94305
Contributed by John Ross, June 2, 1990
ABSTRACT We present a model of neural group interactions, which are projections from one neural network (network B) of McCulloch-Pitts neurons connected via a Hebbian rule, to another network (network A) of the same structure. We ffrst consider the case in which the projecting network B is in a pattern different from the initial attracting state of network A. A critical projecting strength A, is found such that for A below this value there exists a noise threshold HA corresponding to each A. For the case where A < A, and the noise level or < 0rA, there are two possible retrievals, with different probabilities: the initial attracting state of network A and the projecting pattern. If A < Ac and a > qA, stable states of network A disappear. In the case A > A,, network A is pulled out of its initial basin of attraction and into that of the projecting pattern. This analysis provides a model for distraction. Secondorder interactions reduce the distraction. When the projecting network B is in the same pattern as the initial attracting state of network A, the projection acts as an external reinforcement, which enables network A to retrieve in highly noisy conditions. Sharp noise thresholds for nonzero retrievals are shown to be eliminated by the projection. Higher-order connectivity improves the retrieval ability of the network. The second case serves as a model of concentration. We discuss the model of distraction and concentration (i) in connection with common experience of expectation of recognition and (ii) in connection with recent T-maze experiments on infant rats; finally, we suggest a refined version of the Bruner-Potter experiment to test our prediction of the disappearance of hysteresis.
interactions. The studies of Sections 2 and 3 are discussed in Section 4 to show that they may serve as models of distraction and concentration. In particular, the recent T-maze experiments on infant rats and the Bruner-Potter experiment are discussed in light of our results. The work presented here constitutes a few illustrative examples of interactions among neural networks. Many variations are conceivable, involving more than two groups, different connections, strengths of connections, and noise levels. 2. Interaction of a Neuronal Group with Another Group, Case i: A Model for Distraction
Consider network A, which consists of N McCulloch-Pitts neurons (7). The state of the ith neuron is represented by Si, which takes the value -1 when it is quiescent and +1 when it is firing at a rapid rate. In our discussion, we use a synchronous updating algorithm [as in the Little model (8); see also refs. 9-12]. We let p patterns be stored in the neural network via the Hebbian learning rule (13, 14). Explicitly, the dynamics of the system is given by the following: Si(t + 1) = sign[hi(t)], where hi(t) = Xj, TijSj(t) + qi; Sj(t) represents the state of thej neuron at time t; sign(x) = -1 for negative x and sign(x) = +1 for positive x; Tij = (1/N)XP,=1S1S1 are the Hebbian synaptic efficacies, S1L is the uth stored pattern, and p is the number of patterns stored. Here we also include a background random Gaussian noise qi with a mean zero and a standard deviation o'O to take into account the presence of noise (temperature). Neural noise in physiological systems may be attributed to spontaneous neural firing and the statistical variation in the number of vesicles containing neurotransmitters-e.g., acetylcholine-released at the synaptic junctions (15-18). (For experimental evidence that supports a Gaussian noise distribution, see, e.g., ref. 17, p. 21.) Suppose that the initial state of the network is set in the neighborhood of pattern S1; i.e., ml(0) = max{mJL(O)IJ = 1, 2, ... , p}, where mM(t) = (1/N)SA-S(t) is the overlap between the state of the system at time t and the gth pattern. Let there be another identical neural network B, which has settled down to another stored pattern, S2. Suppose that there exists a one-to-one projection from network B to network A-that is, we consider a local field in network A hi(t) = 21jlTijSj(t) + AS? + qi, where A is the strength of the projection. We rewrite the total signal in the following form
1. Introduction
Theories of neural networks provide models of elements of brain functions, such as pattern recognition and memory, models for computation devices, and studies of collective properties of nonlinear components. (For recent reviews/ books on neural networks, see, e.g., refs. 1-6.) In the present paper, we focus on interactions among groups of neurons; in particular, the projection of one neural network onto another. For simplicity, we assume that the two networks have the same structure. We consider that the projecting network (network B) is initially in a stationary state and the other network (network A) is initially in the vicinity of (i) a different state (Section 2) and (ii) the same state as B (Section 3). Each neuron in network B projects a field, which is proportional to its own local field, onto the corresponding neuron in network A. Thus, the projection influences the process of internal evolution of network A, for which a statistical dynamics is developed in Section 2 for case i, a model of distraction; and in Section 3 for case ii, a model for concentration. Synaptic noise is incorporated in our formulations, as well as the effects of higher-order neuronal
hi(t) = m1(t)S! + [m2(t) + A]S? + X.
[1]
The first two terms are proportional to the overlaps of the system with pattern S1 and S2, respectively. The last term qI' consists of external noise ,qj and interferences from patterns s2, S3, . .. , SP. Following Hopfield (14), we assume the
The publication costs of this article were defrayed in part by page charge payment. This article must therefore be hereby marked "advertisement" in accordance with 18 U.S.C. §1734 solely to indicate this fact.
tTo whom reprint requests should be addressed.
7110
Proc. Natl. Acad. Sci. USA 87 (1990)
Neurobiology: Wang and Ross stored memories to be completely uncorrelated. They are represented by random vectors SA, each of whose components takes the values +1 and -1 with equal probability. Hence there exists an up-down, or S to -S. symmetry. The probability distributions of interferences are therefore symmetric with respect to zero. As a first approximation, we assume that interferences have an identical and timeindependent Gaussian distribution (9) with a standard deviation oa. (The calculations of the actual distributions of the interferences will be the subject of another report.) This approximation becomes exact when many synapses are disconnected randomly (19). Inclusion of synaptic dilution introduces rescaling in both the noise level and the projecting strength; however, the dynamic equations remain unchanged. The mathematical details are omitted. After averaging over all configurations of stored patterns, as well as the external noise, we obtain the following dynamic equations in the first case of our model: 1 1)d (m{(t +
2
=
414m'(t)
second cycle of updating and remains so in the rest of the evolving process. In summary,
(m2(t)) > (m1(t)) for t - 2, iff A > Ac -m1(0) - m2(0), [5] and, similarly,
(m2(t)) < (m1(t)) for t 2 1, iff A 0rA, there are no nonzero fixed points. Our noise threshold AA is projection dependent. In the absence of a projection-i.e., A = 0, and for d = N/2 (orthogonal patterns), VA takes the known result (2/Xr)/2 (9, 11). 0A decreases as A increases and approaches zero as A approaches 1. In the case A 2 Ac, we have shown that the network turns closer to S2 than S1 after the second cycle of updating (see Eq. 5). From then on, S1 no longer plays any special role in the evolving process. We therefore conclude that
(m(OO)) = (ml(o)) = 0, if A > Ac_
[13]
where u = 3, 4, . . ,p. In summary, the limiting behavior of network A in case i can be described as follows. For A 2 Ac, there is one retrieval-i.e., (m'(oo)) = 0 and (m2(o))> 0. For A < Ac, there exist two possibilities: (i) for or < 0-A, there are two retrievals with (m'(oo)) > (m2(oo)) > 0, (ii) for o > o-A, there are no retrievals-i.e., (m1(oo)) = (m2(oo)) = 0. In the above analysis, we have assumed that there exist only pair-wise-i.e., first-order-interactions within each neural network. Several experiments have shown evidence for nonlinear, multiplicative neuronal interactions (20-22). We now include a second-order interaction (11, 12, 23) in the model presented above, with an input for the ith neuron hi(t) = 1i7-jlTijSj(t) + Y2 Yj'k=1TijkSj(t)Sk(t) + AS? + ip. The coefficients yi and y2 measure the relative strengths of first-order and second-order interactions, and Tijk = (1/ N2) 1SA StS£. The rest of the analysis is similar to that of the first-order interaction. Dynamic equations for (m1(t)) and (m2(t)) can be derived but their expressions are omitted here. We find that they can no longer be decoupled with respect to S1 and S2 after inclusion of second-order interaction, and we have to resort to numerical methods to find the final overlaps of the system with patterns S1 and S2. We also find a different critical strength of influence: ,
All = 'yAc + y2{[ml(0)]2- [m2(0)]2}.
[14]
Compared to the case of first-order interaction, we find that A' > A , if yi = 1 and y2 > 0. In other words, the critical strength is enhanced by second-order interaction: It is more difficult to pull network A out of a basin of attraction in the presence of the second-order interaction. Hence, the higher connectivity introduced via second-order interaction resists
distraction and therefore improves the retrieval performance of the network. 3. Interaction of a Neuronal Group with Another Group, Case a: A Model for Concentration In this section, we consider the case where the external influence reinforces the internal processes. We still assume that network A is initially in the vicinity of pattern S1, but we let network B settle down to the same pattern S'. As discussed in the previous section, this situation can also happen after two updating cycles if network A is initially close to a pattern that is different from the projecting pattern but the projecting strength is above the critical value. Such a projection results in a nonzero retrieval in network A even in the case in which the noise level in network A is so high that the network does not evolve to SI in the absence of any outside influence. By arguments similar to those in Section 2, we obtain
(m(t + 1)) = 1 - 21{Tylm(t) + y2[m(t)]2 + A}.
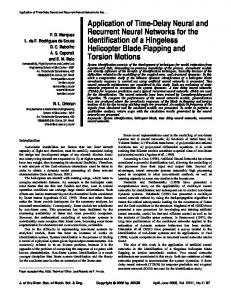
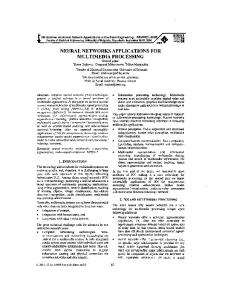
Here we have omitted the superscripts 1-e.g., m(t) denotes the overlap between the projecting pattern and the state of network A at time t. Let us first consider the linear case, where yT = 1 and T2 = 0. In Fig. 2 we plot the average final overlap as a function of noise level. As shown in Fig. 2, there exist nonzero stationary states for Eq. 15, for any noise level, as long as A > 0. Thus, sharp noise thresholds (9, 11) are eliminated by a nonzero projection. The results of the final average overlap with second-order interaction are presented in Fig. 3. Second-order interactions (y2 > 0) enhance the effect of concentration and therefore improve the retrieval performance of the network. Again, there are no sharp noise thresholds. In the absence of a projection-i.e., A = 0-second-order interaction introduces hysteresis (11). We see from Fig. 3 that hysteresis persists at small projections, with the singularity being smoothed by a nonzero A (see curve b in Fig. 3 with A = 0.03). For a given set of Ty and y2, there exists a Aks such that for A > Acs there is no hysteresis-i.e., see curve c in Fig. 3 with A = Acs = 0.108 and curve d with A = 0.18 > Acs in the case yi = T2 = 1. A three-dimensional diagram of (m(oo)) vs. A and oa reveals a cusp catastrophe formed by Acs and the corresponding acs. This three-dimensional diagram, as well as detailed derivations of Ac, and -cs as functions of Ty and T2 are omitted. Our results show that for a given yi, both Acs and o-, increase monotonously as T2 increases.
00 A
8%-0.50
E
FIG. 2. Average overlap be-
tween the final state of network A and the projecting pattern as a
function of noise level a- at different projection strengths: a, A = 0; b, A = 0.03; c, A = 0.19; d, A = 0.27, in the case where the projec-
1.20 0c
[15]
1.60
tion reinforces the processes of evolution in network A. Only firstorder interaction is included.
Neurobiology: Wan'and Ross
9 E
Proc. Natl. Acad. Sci. USA 87 (1990)
7113
0.50
CT
4. Discussion
In this section, we discuss the issues of distraction and concentration in relation to our model. Distraction and concentration are opposite ways of directing one's attention. According to Webster's New World Dictionary (24), attention is the act of focusing one's mind on a subject: to concentrate is to direct one's thoughts or efforts, or to fix one's attention, whereas to distract is to draw one's attention away in another direction. As long as a person is awake, there is the ability to direct attention to specific aspects of the mental environment. Furthermore, the degree of attention can change remarkably from (i) almost no attention to anything to (ii) broad attention to almost everything, with the possibility of (iii) intense attention to one thing of particular interest. Much research has been done on the attention mechanism (see, e.g., refs. 25-30), in particular on its physiology, but the basic mechanisms by which the brain accomplishes its diverse acts of attention remain largely unknown. There are clues that a subportion of the brain called the posterior parietal cortex, which is generally referred to as area 5 and area 7, plays a major role in directing attention (25, 29, 30), whereas other parts of the brain-for instance, the basal ganglia and the cerebellum-are more important for execution of an action. "Anticipatory sets" represent a physiological organization in the brain that facilitates processes of expectancy, especially in the field of conditioned response (31). The neural counterparts and derivatives of the psychological expectancies are thought to lie at the interface between the sensory and motor systems of the brain, exert their influences on these domains (32), and conceivably play a role in such mental processes as selective attention, anticipation, and motivation (31, 32). In the models discussed in the text, we considered a neural system consisting of networks A and B. Suppose that network A is the decision-making network-e.g., it is connected to a motor system. We also assume that B evolves much faster than A so that when A and B are exposed to the same (sensory) input, B immediately reaches a stable state S*. Let network B serve the purpose of directing the attention of network A, through a projection, to pattern S*, or in a broader sense, a decision, of a particular interest according to past experiences. We assume that S is the pattern to be recognized, or the correct decision to be made, and S may be either different from or the same as S*. Hence networks A and B, in a highly simplified model, assume roles analogous to the cerebellum and the posterior parietal cortex, respec-
FIG. 3. Same as in Fig. 2, with second-order interaction included (Yi = Y2 = 1). Curves a (A = 0) and b (A = 0.03) show hysteresis, whereas curve d (A = 0.19) does not. Curve c (A = AcS = 0.108) is the cusp point. Dashed lines in a and b are unstable. For comparison, the overlap for V2 = A = 0 is also shown (dot-dashed line).
tively. Pattern S * plays the role of the expectation of the system. In the first case that we considered in Section 2, the projecting pattern is different from the pattern to be recognized-i.e., S* # S; the influence from B to A is incorrect. We use this case to model distraction. The attention of the system is distracted toward pattern S*, which is different from the pattern S to be recognized. As shown by our results, the chance of making the correct pattern recognition is decreased by the distraction modeled by a projection from network B. If the projection strength A is below a critical value A, and the noise level of is below a threshold CA, our results predict that there exists a certain probability for network A to retrieve the projecting pattern S *, although the probability to retrieve S is greater. When A < Ac and a > oHA, there are no retrievals. The noise threshold VA decreases as the strength of the projection A increases, which indicates that the retrieval ability of the system decreases with increasing distraction. If the projection strength is equal or above the critical value Ac, the retrieval of network A is most likely to be the distracting pattern S *, whereas the probability of retrieving pattern S vanishes. When the input is too "fuzzy," which is represented by a small initial overlap between the state of network A and the pattern to be recognized, we know that Ac is also small (see Eq. 4), and hence a small A (>Ac) suffices for network A to retrieve S*. In the second case considered in Section 3, where S* = S, the influence from network B to A is the correct one for recognition of S. The probability of making the correct recognition is enhanced by the influence of B, and this is our model for concentration. As predicted by our results, successful recognition is possible above a normal noise threshold with the help of the projection of B on A. Concentration of attention may enable one to retrieve a pattern when the noise level is high-for instance, the recognition of an object in inadequate luminance. Consider the following simple example. Jim is asked to recognize a photograph of Harold (pattern S discussed above). However, the noise level in the photograph is rather high, perhaps due to underexposure and poor focusing, which makes the recognition difficult. Jim barely knows Harold, and the photograph reminds him of his good friend Bill (pattern S*, and S* 5 S). It is then very likely for Jim to conclude that the person in the photograph is Bill. On the other hand, ifJim is asked to recognize an unclear photograph of Bill, Jim's expectation will undoubtedly improve his chance of making a correct recognition. Interesting experiments have been reported (33-36) on how expectancies of infant rats can influence their perfor-
7114
Neurobiology: Wang and Ross
mance. In these studies, infant rats were trained to find the correct goal box in a simple T maze after deprivation treatments. The reward for the rats after successfully approaching the correct goal box was either the opportunity to suckle or to obtain milk in the absence of the mother (33, 34). The performances of the rats were found to be in the following decreasing order: (i) preweanling rats with reward to suckle, or to obtain milk in the presence of maternal odors (the so-called shavings effect; cf. ref. 34), (ii) weanling rats with milk alone, and (iii) preweanling rats with milk alone. These results suggest (36) that preweanling rats deprived of nutrients and placed in the training environment, having never obtained nutrients from any source other than the mother, have an expectancy that their nutritional needs will be met by locating and approaching the mother. In the language of our theory, the correct "pattern" S to be recognized, which represents the fact in the above three experimental situations, is "milk is available in the goal box," no matter whether the mother is present or not. The expectancies of the rats vary in these three cases. In experiment i, either the mother or maternal odors are present and the preweanling rats think that the mother is in the goal box. Hence the expectancy, which is represented by pattern S*, is also "milk is available in the goal box"-i.e., S = S* (concentration). In this case, the probability that the rats find the correct goal box is therefore enhanced by the expectancy and the performance is the best. However, in experiment iii, the absence of the mother and maternal odors implies to the preweanling rats the absence of milk; therefore the expectancy in this case is "milk is not available in the goal box"-i.e., S # S* (distraction). Since the rats are in the preweanling stage, we anticipate the expectancy, a distraction, to be large (A3 large).
The distraction reduces the chance of reaching the correct goal box and the performance is the worst. After the infant rats have acquired early weaning experience, as in experiment ii, the association between mother and nutrients becomes weakened. In this stage, the expectancy is still S* = "milk is not available in the goal box" $ S, but the distraction is less in ii than in iii, and hence A2 < A3. The performance in ii is therefore intermediate between i and iii. Note that A2 and A3 must be below the critical value, since the performance ability of the rats is not yet completely lost. We now suggest an experiment to check the cusp catastrophe predicted in the model. Bruner and Potter (37) have shown evidence for hysteresis in an experiment in which human subjects were tested on recognition performance, while patterns were gradually focused and defocused. Our results show that there exists a cusp point of projecting strength and noise level, at or above which there is no hysteresis. It is reasonable to assume that the strength of the projection is proportional to the intensity of the memory. If the Bruner-Potter experiment on the visual system is performed with patterns of different interest to the subject, our results predict that hysteresis will be reduced or even disappear for those patterns that are strongly memorized by the subject. Similar experiments can also be performed with other sensory systems: for instance, in the case of the auditory system, our results imply that there will be little or no hysteresis in recognition of a subject's favorite music. In the absence of neural group interactions, sharp noise thresholds and a stiff hysteresis curve were predicted theoretically in ref. 11. However, as further explained in ref. 11, the thresholds are not expected to be as sharp as shown in figure 1 of ref. 11, due to statistical fluctuations in a finite size system and variability of the subjects. Our present study shows that the sharp noise thresholds and the stiff corner in the hysteresis curve (11) may be completely smeared out when strong interactions between neuronal groups are present.
Proc. Natl. Acad. Sci. USA 87 (1990) It is a pleasure to thank Gregory J. Smith for a very informative discussion on the T-maze experiments. Many helpful conversations with E. E. Pichler and W. Vance are also gratefully acknowledged. This work was supported in part by the National Science Foundation. 1. Domany, E. (1988) J. Stat. Phys. 51, 743-775. 2. Crick, F. (1989) Nature (London) 337, 129-132. 3. Sompolinsky, H. (1988) Phys. Today 41, 70-80. 4. Nauta, W. J. H. & Feirtag, M. (1979) in The Brain (Freeman, San Francisco), pp. 40-53. 5. Edelman, G. M. (1987) Neural Darwinism (Basic Books, New York). 6. McClelland, J. L., Rumelhart, D. E. & PDP Research Group (1986) Parallel Distributed Processing (Massachusetts Institute of Technology, Cambridge, MA). 7. McCulloch, W. S. & Pitts, W. (1943) Bull. Math. Biophys. 5, 115-133. 8. Little, W. A. (1974) Math. Biosci. 19, 101-120. 9. Kinzel, W. (1985) Z. Phys. B60, 205-213. 10. Amit, D. J., Gutfreund, H. & Sompolinsky, H. (1985) Phys. Rev. A 32, 1007-1018. 11. Keeler, J. D., Pichler, E. E. & Ross, J. (1989) Proc. Natl. Acad. Sci. USA 86, 1712-1716. 12. Wang, L. & Ross, J. (1990) Proc. Natl. Acad. Sci. USA 87, 988-992. 13. Hebb, D. 0. (1949) The Organization ofBehavior (Wiley, New York), p. 44. 14. Hopfield, J. J. (1982) Proc. Natl. Acad. Sci. USA 79, 25542558. 15. Shaw, G. L. & Vasudevan, R. (1974) Math. Biosci. 21, 207-218. 16. Sejnowski, T. J. (1981) in Parallel Models ofAssociative Memory, eds. Hinton, G. & Anderson, J. (Lowrence Erlbaum Associates, Hillsdale, NJ), pp. 189-212. 17. Abeles, M. (1982) Local Cortical Circuits (Springer, New
York).
18. Carpenter, R. H. S. (1984) Neurophysiology (University Park
Press, Baltimore). 19. Derrida, B., Gardner, E. & Zippelius, A. (1987) Europhys. Lett. 4, 167-173. 20. Kandel, E. R. & Tauc, L. (1965)J. Physiol. (London) 181, 1-27. 21. Roney, K. J., Scheibel, A. B. & Shaw, G. L. (1979) Brain Res. Rev. 1, 225-271. 22. Shaw, G. L., Harth, E. & Scheibel, A. B. (1982) Exp. Neurol. 77, 324-358. 23. Peretto, P. & Niez, J. J. (1986) Biol. Cybern. 54, 53-63. 24. Neufeldt, V. & Guralnik, D. B., eds. (1988) Webster's New World Dictionary (Webster's New World, New York). 25. Stein, J. F. (1985) in Functions of the Brain, ed. Coen, C. W. (Clarendon, Oxford), pp. 67-97. 26. Bushnell, M. C., Duncan, G. H. & Lund, J. P. (1987) in Higher Brain Functions: Recent Explorations ofthe Brain's Emergent Properties, ed. Wise, S. P. (Wiley, New York), pp. 211-237. 27. Desmedt, J. E., ed. (1977) Attention, Voluntary Contraction and Event-Related Cerebral Potentials (S. Karger, New York). 28. Desmedt, J. E., ed. (1979) Cognitive Components in Cerebral Event-Related Potential and Selective Attention (Karger, New York). 29. Heilman, K. M., Watson, R. T., Valenstein, E. & Goldberg, M. E. (1987) in Higher Functions of the Brain, eds. Mountcastle, V. B., Plum, F. & Geiger, S. R. (Am. Physiol. Soc., Bethesda, MD), Part 1, pp. 461-481. 30. Anderson, R. A. (1987) in Higher Functions of the Brain, eds. Mountcastle, V. B., Plum, F. & Geiger, S. R. (Am. Physiol. Soc., Bethesda, MD), Part 2, pp. 483-518. 31. Sperry, R. W. (1955) Br. J. Anim. Behav. 3, 41-44. 32. Thompson, R. (1984) in Neuropsychology of Memory, eds. Squire, L. R. & Butters, N. (Guilford, New York), pp. 408416. 33. Blass, E. M., Kenny, J. T., Stoloff, M., Bruno, J. P., Teicher, M. H. & Hall, W. G. (1979) in Ontogeny of Learning and Memory, eds. Spear, N. E. & Campbell, B. A. (Erlbaum Assoc., Hillsdale, NJ), pp. 39-56. 34. Smith, G. J. & Spear, N. E. (1978) Science 202, 327-329. 35. Smith, G. J. & Bogomolny, A. (1983) Dev. Psych. 16, 119-128. 36. Smith, G. J. & Croft, E. R. (1985) Behav. Neural Biol. 43, 250-259. 37. Bruner, J. S. & Potter, M. C. (1964) Science 144, 424-425.