interactive blackboard as a teaching tool. A conceptual computerized ..... noted that students ranked the new system as being easier to ask questions in (3.86), ...
Interactive Blackboard Software Visualizing Students' Feedback - Toward “i-room”: Classroom Computerization SATO, Kouki* YANAGISAWA, Masayoshi** AKAHORI, Kanji* *Dept. of Human System Science, Graduate School of Decision Sciences and Technology, Tokyo Institute of Technology, Japan **Faculty of Human Sciences, Toyo Eiwa University, Japan Abstract
(Streitz et al., 2001) is an interactive world where the daily life components of every day life such as walls, chairs and tables based are being modeled with the aim to produce an interactive environment for the user. Similarly the “Classroom 2000” project (Abowd, 1999) attempting to develop computerized classroom components including such as the interactive blackboard and other means designed to capture classroom activity. They are almost only hard ware development and their evaluations were not conducted very much. Although the concepts of an interactive blackboard and classroom computerization are seen appealing and useful there are a number of serious disadvantages associated with their development and subsequent use. A primary concern focuses on how difficult and troublesome it would be to actually operate these interactive environments. Greiffenhagen (2000) shows that an interactive blackboard may not be effective for education by his participation research in mathematics education within a school. He proposes to give functions to support interactions between a teacher and students to an interactive blackboard. There have however been a number of studies conducted that offer the interactive classroom a number of promising results. For example, in a study conducted by Nakayama et al (2001) students’ real time feedback to a teachers PC using cellular phones was collected in class using a “response analyzer” (Fujita 1969). The results of this study found that it was beneficial for feedback to be displayed not only on a teacher’s but also directly in front of a classroom. From a cultural perspective, the development of an interactive forum that would allow discussion between the teacher and students would be a useful teaching tool in countries such as Japan. In Japan, classroom culture is such that students do not feel comfortable openly asking a question to either teachers or to their peers. The implementation of an interactive classroom would it is hoped promote “question asking” behavior from the students by allowing them to post their questions, comments and suggestions anonymously. Within this study we attempted to investigate whether visualizing real-time students’ feedback on an interactive blackboard in front of a classroom would support teacher-student interactions within a class. Moreover this system would also allow students to be actively involved in the feedback and discussion process and so it is hoped that this tool would support and promote student-student interactions.
This paper explores the issues surrounding the use of an interactive blackboard as a teaching tool. A conceptual computerized learning environment termed “i-room” is proposed as a future technology deliverable, its objective being to provide students and teacher with the means to interact with each other in real time in a variety of ways. Some of the concepts within the “i-room” were used to develop an interactive blackboard that allowed subjects to issue real time feedback, comments, ideas and suggestions using either a web browser or a cellular phone. A class was conducted to evaluate effectiveness of the system. Results revealed almost a student evaluated that the feedback functions was effective and the class was interactive when compared with a traditional class. But subject feedback suggests that there are a number of problems namely the real time feedback causes confusion.
1.
Introduction
An interactive blackboard describes a large touch-panel computerized display that uses the traditional “blackboard” concept for displaying information and is designed for group teaching/presentation environments such as classrooms. The interactive blackboard primarily differs from the traditional blackboard in that it allows all users that are connected to the blackboard via their PC to contribute to a lesson or presentation by using their PC. These contributions can either be written as text or presented as drawn diagrams and sent to the interactive blackboard for all users to see and comment on. The user can use various PC applications such as web browser, word processor or presentation software to display this information in. LiveBoard (Elrod et al., 1992) was the first ever commercially produced interactive blackboard and is used in small office meetings (Pedersen et al., 1993). More recently a pen input interface and an interactive blackboard designed for educational settings called “IdeaBoard” has been developed (Otsuki et al. 2001). Although the concept of an interactive blackboard seems ideal for a setting such as a classroom or lecture theatre the problem at present however, centers upon the lack of suitable educational software on the market to support teaching activities. Recently the concept of the interactive blackboard has been taken a step further by researchers who are attempting to create interactive classrooms. “i-LAND”
0-7695-1509-6/02 $17.00 © 2002 IEEE
823
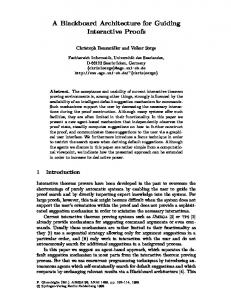
There is a large touch-panel display in front of a classroom. It can generate virtual reality in whole of classroom. The display changes each subject mode by clicking it.
Displaying purpose of class and direction of teacher
Video Camera for TV conference Sub window: displaying tools of each subject
Unclear points of students are blinking.
Seating list: displaying each student’s screen Students to attend in distance place
Question cards: displaying students’ questions as cards
Menu to change display mode On students’ desks, displaying same screen of a front display Students can input questions to each display.
Figure 1: Sketch of the “i-room” Concept
2. Objectives 2.1.
described in the conceptual design of the “i-room” and to evaluate them in terms of their usability and their psychological impact on users. We implemented a number of means by which students would be about to interact during a presentation with an interactive board and would be able to visualize their feedback in real time. In order to evaluate this class a presentation on the subject of this paper was given with students testing and evaluating the developed software and their feelings to learning in an interactive environment. Suffice to say not all the functions identified in the initial conceptual design of the “i-room” were incorporated into the developed primarily as much of the hardware for this type of product does not at present exist. Instead this study sought to develop and test the type of software (Classroom OS) that could be used in this interactive learning environment.
The “i-room” concept
The “i-room” is a conceptual idea of how a computerized classroom could be constructed in the future. In this concept, we have attempted to expand the functions of classroom components such as a blackboard, desks and bulletin boards. The aim of this concept would be to promote interaction between teacher-students and students -students within a class. The “i-room” is operated using management software called “Classroom Operating System”. Figure 1 is a sketch of the “i-room” concept. The “i-room” has the following main characteristics; ž A teacher can show various educational contents by touch-panel operations. And the teacher can draw characters, marks and figures freely. ž Students’ attention such as unclear points, doubt points or interesting points is visualized in the screen. ž Students can send messages text or diagrams from their computerized desks to the screen. ž Both teacher and students can customize their computerized classroom contents depending on their classroom activities. ž The system works in real time and is able to allow a variety of different media formats to be displayed on the screen. ž In the future, the “i-room” could be re -modeled into a virtual classroom by connecting all users to a network and installing a virtual-teacher agent.
2.2.
3. 3.1.
Software Development System configuration
The development and implementation of this system were aimed at the producing a demo product that could be viewed over the Internet (WWW). Figure 2 shows the system configuration assumed within this study. Feedback information was collected by a web server and kept in a database. Students were able to send their feedback in real time by either sending feedback from a client PC by accessing a web page or by sending an e-mail using a cellular phone. The interactive blackboard was the projected image of the teachers PC screen. The blackboard was connected to the teacher’s PC by a pen input device. The teacher’s PC was configured to regularly refresh the web page for the blackboard and therefore displayed feedback in real-time.
Objectives of this study
The aim of this study was to develop a prototype system that would allow us to realize some of the functions
824
difficult they can vote on the subjects level of difficulty with the “Difficulty Gauge” being raised depending on students’ votes. (6) Speed Meter If students feel a teacher is speaking too fast or covering the material too quickly students can let the teacher know this by sending the “Speed Meter” a vote. (7) Sleep (Level of Interest) Gauge If students feel “sleepy” (it means “not interesting”), they can register their opinion by sending the “Sleep Gauge” a vote. “Sleep Gauge” affects a cultural factor of Japan. In Japan, many students often sleep in a class because they feel the class is not interesting. So this gauge means a number of students who feel the class is not very interesting.
Input Device Students’ PC
Projector
Web Server
Cellular Phone (for Students) Figure 2: System Configuration
3.2.
Feedback visualization
4.
Figure 3 shows a display of the interactive blackboard. Contents Display
4.1.
Utility Buttons
Keyword Vote Chat Window
4.2.
Speed Meter Sleep Gauge
Objectives
The purpose of this study was to try and validate the effectiveness of 7 kinds of feedback visualization. We also sought to examine if anything about the learning environment would change with the introduction of an interactive blackboard. Moreover we were interested in asking subjects to compare their learning experiences in traditional classroom environments with their experiences in the interactive one.
Question Card
Difficulty Gauge
Evaluation
Method
Subjects as students were 23 university students. Subjects were randomly divided into three groups. Each group was assigned a different means of sending feedback; (1) 6 students sending feedback by using a web browser, (2) 7 students sending feedback by using a cellular phone, (3) 10 students were unable to send to comment on the class but could only view the feedback. The author of this paper acted as the teacher and the subject of this class was a presentation and discussion of the developed software. A “mimio” pen input device was used as an input device in this class (Virtual Ink Corporation, 2001-2002). The presentation and discussion was for 45 minutes with subjects being able to comment using their particular media in real time during this session. Subjects were issued with a questionnaire of following 7 questions with 5-point scale ratings; (1) Rate the perceived use of each feedback functions (1=used least often, 5=used most often). (2) Rate the perceived effectiveness and usefulness of sending feedback and having it visualized (1=least effective, 5=most effective). (3) Rate the perceived to understand contents about both the experimental class and a traditional class (1=least understood, 5=most understood). (4) Rate the perceived easiness to ask a question about both the experimental class and a traditional class (1=least easy, 5=most easy). (5) Rate the perceived to contribute about both the
Again Lamp
Figure 3: Display of Blackboard A teacher could show educational contents through the use of the “Utility Buttons” and “Contents Display”. For interaction support, 7 kinds of feedback visualization were implemented in this study. (1) Question Card Students can send questions, opinions or comments to a teacher. These questions are kept in a corner of the blackboard as cards. The teacher can pick up them at anytime in a class. (2) Keyword Vote Students can post unclear or difficult keywords. Students can vote on mentioned keywords too. Posting keywords and their number of votes are displayed on the blackboard. (3) Chat Window Students can send short comments to a teacher. That is students can “chat” to the teacher. Sent comments are displayed on the blackboard in a time-series order. (4) Again Lamp If students miss something the teacher has said, shown or demonstrated students can push the “Again Lamp” key and the lamp on the blackboard is turned on. (5) Difficulty Gauge If students feel the subject matter being covered is
825
experimental class and a traditional class (1=least contributed, 5=most contributed). (6) Rate the perceived interactive to a teacher about both the experimental class and a traditional class (1=least interactive, 5=most interactive). (7) Rate the perceived to concentrate about both the experimental class and a traditional class (1=least concentrated, 5=most concentrated). And subjects wrote free comments about the class and feedback functions. A number of other measures were also recorded such as a log of feedback sent to the blackboard during the study, the study was taped and subjects were interviewed at the end of the presentation.
Result
Figure 4 shows a picture of the experimental class.
Figure 4: Picture of the Experimental Class Figure 5 shows the results of question-1, about the frequency of sent feedback. Figure 6 shows the results of question-2, about the perceived effectiveness of feedback functions. From the results we can see that the “Chat Window” was most frequently used and evaluated as most effective. The students in group-1 sent feedback more frequently when compared to students in group-2. The students in group-2 evaluated the “Again Lamp”, “Difficulty Meter”, “Speed Meter” and “Sleep Meter” as least effective. Figure 7 shows the results of questionnaire that asked students to compare a traditional class on questions 3-7 to the class using our developed system. The results of our analysis revealed there were significant differences in
From the logs and the results of the questionnaire it can be seen that the “Chat Window” was most frequently used by subjects and that the “Question Card” was evaluated very useful by a large number of subjects. The “Speed Meter” was also found to be used during the course of this study with subjects indicating that the presentation should be delivered at a slower pace. The students in group-1 sent feedback more frequently than students in group-2. It considered because a cellular phone were bad 5
Group-1 Group-2
3 2 1 1
2
3 4 5 Kind of Feedback
6
7
1. Question Card 2. Keyword Vote 3. Chat Window 4. Again Lamp 5. Difficulty Gauge 6. Speed Meter 7. Sleep Gauge
4 3 2
3.71
4.14
1 Traditional
System
Point (Average)
Point (Average)
5
5 4 3 2 1
3.86 2.50 Traditional
System
2
1
2
4 3
1
4
5
6
7
Figure 6: Perceived Effectiveness of Each Function
5
2
3
Kind of Feedback
More to Contribute Class Point (Average)
Ease to Ask a Question
1. Question Card 2. Keyword Vote 3. Chat Window 4. Again Lamp 5. Difficulty Gauge 6. Speed Meter 7. Sleep Gauge
3
1
Figure 5: Frequency of Use for Each Function Ease to Understand Class
Group-1 Group-2 Group-3
4
2.57 Traditional
3.18 System
5 4 3 2 1
2.55 Traditional
Figure 7: Comparison with a traditional class
826
More to Concentrate
More to Interact
3.43 System
Point (Average)
4
Discussion
Point (Average)
Point (Average)
5
4.4.
Point (Average)
4.3.
students’ perceptions on their behavior in traditional and the newly developed system. ž The Ease with which to ask a Question There was a significant difference in students assessment of the traditional class and the new system [t(19)=3.857, p=0.001]. By looking at the means it can be noted that students ranked the new system as being easier to ask questions in (3.86), when compared to a traditional class (2.50). ž Contribution of Questions to a Class There was a significant difference in students asses sment of the traditional class and the new system [t(20)=3.005, p=0.007]. By looking at the means it can be noted that students ranked the new system as resulting in more questions being contributed in (3.18), when compared to a traditional class (2.57). ž Interactivity with Teacher during a Class There was a significant difference in students assessment of the traditional class and the new system [t(19)=3.866, p=0.01]. By looking at the means it can be noted that students ranked the new system as resulting in more interactivity with a teacher (3.43), when compared to a traditional class (2.55). Although no other significant differences were found in our data set it should be noted that on question-7 the “ability to concentrate” the means reveal that on average students found the traditional class as an environment that allows for more concentrating when compared to the new system. This is an interesting finding and warrants further investigation.
5 4 3
4.00
2 1 Traditional
3.38 System
user-friendliness about key inputs. The students in group-2 evaluated “Again Lamp”, “Difficulty Meter”, “Speed Meter” and “Sleep Meter” less effectiveness. It is considered because feedback sent from a cellular phone affects the front display more backwardly than feedback sent from a web browser. Some of the subjects in group-3 reported feeling they were unable to issue oral comments during the course of the presentation in the free comments. From observing taped footage of the class it was easy to observe how the level of interaction was increased if students felt able to issue live electronic feedback and comments to the teacher. It was also noted how certain students that are typically quiet during research seminars were quite active in the class and participated using “Question Card” or “Chat Window” functions frequently. There was however a number of problems associated with the interactivity in this presentation. Firstly one student commented that the “feedback functions within the interactive environment would allow malicious students to either pose time-wasting questions or would be used in some way to disrupt the class”. This finding appears to be supported by the video footage of the study were it is noted that there were times when bulk feedback was received by the teacher and that this resulted in the teachers’ presentation becoming confused. Similarly when bulk feedback was sent to the board it was also noted that students understanding of the presented material seemed to be negatively affected.
5.
interactions and results in students taking a more active, verbally enquiring and discursive role within the classroom-a feature not typically seen in a Japanese classroom. The question this observation raises is whether a system like this, if developed and implemented could with time facilitate an attitudinal change in teacher-student and student-teacher interactions within Japanese classroom culture. If one allows a student to feel comfortable asking questions, allowing the student to actively engage and critique the teacher, materials and subject matter; could this result in students being able to do this without the aid of an interactive device in the future?
6.
Future Works
For future studies the following are recommended: (1) Feedback visualization is often dependant on a number of factors so any produced software would have to allow the teacher to customize the feedback contents depending on the conditions and characteristics of a class and students. (2) The authors think that this system would be most effective in large-scale teaching establishments, such as Universities, where students are unable to enter into a discussion with a teacher.
References [1] Abowd, G. B. (1999): “Classroom2000: An experiment with the instrumentation of a living educational environment”, IBM System Journal, Vol. 38, pp. 508-530 [2] Elrod, S., R. Bruce, R. Gold, D. Goldberg, F. Halasz, W. Janssen, D. Lee, K. McCall, E. Pedersen, K. Pier, J. Tang, and B. Welch (1992): “Liveboard: A large interactive display supporting group meetings, presentations, and remote collaboration”, Proceedings of CHI’92, pp. 599–607 [3] Fujita, H. (1969): “Theoretical Investigation on the Response Analyzer for Group Education”, Trans IECE, Vol. 25-C, No. 12, pp. 820-821 [4] Greiffenhagen, C. (2000): “Interactive Whiteboards in Mathematics Education: Possibilities and Dangers”, WGA (11) The Use of Technology in Mathematics Education, The 9th International Congress on Mathematical Education, http://web.comlab.ox.ac.uk/oucl/work/christian.greiffenhagen/pub/icme9 [5] Nakayama, M., Y. Morimoto, K. Akahori, Y. Shimizu (2001): “Development of the Distance education support system by using a cellular phone”, Proceedings of the 17th National Conference of JET, pp. 49-50, In Japanese [6] Otsuki, Y., H. Bandoh, N. Kato, M. Nakagawa (2001): “Development of an interactive electronic whiteboard system with multiple electronic pens for educational applications”, Proceedings of ICCE2001, Vol. 3, pp. 1438-1445 [7] Pedersen, E. R., K. McCall, T. P. Moran, and F. G. Halasz (1993): “Tivoli: An electronic whiteboard for informal workgroup meetings”, Proceedings of INTERCHI’93, pp. 391–398 [8] Streitz, N. A., P. Tandler, C. Müller-Tomfelde, S. Konomi (2001): “Roomware: Towards the Next Generation of Human-Computer Interaction based on an Integrated Design of Real and Virtual Worlds”, Human-Computer Interaction in the New Millennium, J. Carroll (Ed.), Addison-Wesley, pp. 553-578 [9] Virtual Ink Corporation (2001-2002): “Virtual Ink | mimio | turning your whiteboard into a digital whiteboard in seconds”, http://www.mimio.com/
Conclusion
In this paper the concept of an interactive, computerized classroom called “i-room” was proposed with its main function being to promote teacher and student interactions. A prototype piece of software based on some of the “i-room” key concepts was subsequently developed. The main interactive tool in this environment was an interactive blackboard enabled students to visualize the teachers presentation and students’ feedback in real time during a class. Subjects were asked to compare this software and teaching methods with a traditional class, the main results found were; (1) Students found it easier to make comments, questions, suggestions and issue remarks more easily. (2) Students tended to feel that they could contribute to the class. (3) Students tended to feel that they were closely associated to the teacher. The results have also however highlighted that not although feedback visualization has a number of positive attributes it has its own unique problems associated with its use in formal educational settings. For example feedback was seen to interrupt the presentation and at certain points confuse both the teacher and the students participating in this class. Although a number of problems were found with the developed software from a cultural perspective the observation of “typically quiet students” participating during the presentation signals a significant finding. This finding suggests that by allowing students to covertly interact with a teacher promotes student-teacher
827