... of 180 degree vertical and 360 degree horizontal at intersections of the road ..... A participant is asked to ârecall' yesterday by recreating yesterday's schedule.
INTERACTIVE COMPUTER EXPERIMENTS IN VIRTUAL REALITY: ISSUES AND PROSPECTS1 Amy Tan, Harry Timmermans and Bauke de Vries
Eindhoven University of Technology Urban Planning and Design Systems Group PO Box 513 5600 Eindhoven The Netherlands Abstract. We discuss here on how to employ virtual reality in setting up interactive computer experiments as a means to probe the attitudes, motivations, reasoning and principles underlying travel decision-making. Modeling travel patterns has remained a difficult problem in urban planning recently made even more complex by transportation modelers’ attempts to incorporate aspects of human decision making in a traffic demand forecast methodology. There is a need for experimental methods to elicit and not to simply hold constant many factors related to decisions. The importance of choice as processes rather than an event implies the need for tracking, gaming-simulation, and experimentation. Virtual reality promises greater possibilities of achieving these objectives. However, a corresponding added dimension of difficulty is added to the design of this relatively new approach of interactive experiments in transport research. As the emphasis is on the internal psychological processes that people utilize to anticipate or rehearse what will eventually be their behavior in moving through an environment, we are basing our design of the human memory prosthesis on research findings and insights derived from studies about how humans behave in the recall of everyday activities. Issues of designing a practical virtual reality system and prospects of more in-depth investigation of respondents’ behavior in the new medium will be expanded.
INTRODUCTION Travel behavior, like many other phenomena relating to human behaviors and decision-making, is a dynamic process. In particular, it has been recognized that travel behavior is complex arising out of the interplay of one’s personal and household characteristics, his/her perception of the environment, the situational conditions and constraints, transportation system properties and policies. Hanson and Burnett [1] defined complex behavior as opposed to simple behavior because travel patterns are sequences of events instead of a single observable event. They point out that it is the inherent multidimensionality of an individual’s daily travel pattern that poses a challenge to any researcher wanting to capture their full complexity in any measurement devices. Brög and Erl [2] suggested that a chain of “objective circumstances – personal perception – subjective situation – individual decision – behavior” must be reenacted to understand behavior. When it comes to monitoring the effects of transport policy measures, we want not only to observe what people did in response to the policy, but also why they did so. In order to obtain information about the processes by which households adapt to change and to identify the possible outcomes of change, Jones et al [3] advocated the need for a methodological approach to examine the dynamics of change. The diary framework is essentially static; it can provide a basis for discussing historical change. Over the last years, surveys using electronic diaries have been carried out[4] [5], in combination with GPS data studies [6] and recently with instrumented vehicle studies [7]. However, it still does not enable simultaneous observation of responses to change. It still remains a major challenge today to develop a better understanding of the dynamic aspects of travel behavior. SP methods has contributed to this area by offering the capability to study behaviors that occur infrequently or are otherwise to observe, and the ability to control co-varying factors, and to distinguish between genuine change as opposed to random variation in behavior [8]. 1
Paper presented at the Annual Meeting of the Transportation Research Board, January 2001, Committee A1C04 Traveler Behavior and Values, Session on Alternative Approaches to Modeling Activity Behavior.
To further probe into the behavioral mechanism underlying motivations for travel requires a change in the method of data collection. The shift is towards interactive measurement, which can take several forms. A review on the state-of-the-art interactive travel survey methods can be found in Jones [9]. Different gaming strategies and experimental simulations have been employed to help explain travel decision-making. The Household Travel Simulator (HATS) [10] has been demonstrated to have positive influence on the data collected by tapping on interactive interviewing with the aid of visual diagrams. It was possible in HATS to elicit insights not previously expected or immediately obvious. Interactivity proves to be successful in eliciting behavioral outcomes or constraints or both. Lee-Gosselin [11] classified 4 approaches to Stated Response techniques (see Table 1) according to whether the constraints and behavioral outcomes were mostly given or mostly elicited. All 4 approaches use interactive methods; in all SPro, most ST and SA, and some SP approaches. He recommended that the more complex the linkages between constraints, the more you move towards SA and SPro, in order to observe accommodating and adaptive behaviors to changes in constraints. Indeed, insights gained from the use of sophisticated interactive techniques of this type are likely to assist with many aspects of policy and planning.
CONSTRAINTS (expressed as attributes of: personal/household/social/spatial/supply, etc) Mostly given Most elicited
Mostly given
(focus = tradeoff, utility)
“Given the levels of attributes in these alternatives, which would you prefer: [A] ……? [B] ..…? Etc ….?”
STATED ADAPTATION Mostly elicited
BEHAVIORAL OUTCOMES
STATED PREFERENCE
STATED TOLERANCE (focus = limits of acceptability, and threshold for change) “Under what circumstances could you imagine yourself doing: [r1] …..? [r2] ……? Etc …..”
STATED PROSPECT
(focus = reactive and trail behavior; problem-solving rules)
(focus = learning process, information seeking; the imaging, formation and testing of choice sets; metadecisions)
“What would do differently if you were faced with the following specific constraints: [detailed scenario]”
“Under what circumstances would you be likely to change your travel behavior and how would you go about it […broard context]”
Table 1: A taxonomy of stated response survey approaches [11]
Computers have allowed greater customization of the SP-contexts presented in the developments of SP experimental design procedures [12]. Although interactive methods are gaining ground, at this stage it is yet to be ascertained what aspects in the design of an interactive computer experimental instrument must be established (bearing in mind the implementation, respondent comprehension, and interest) in order to obtain the results that the researcher sets out to achieve. For instance, one has to consider the instrument effects associated with wording, layout, use of color, etc, and information effects associated with the type and amount of supporting contextual information given to respondents before or during the interview (e.g. textual versus static graphic versus animated graphic) especially in the case of studies of new mode. Axhausen [13] expanded on the issue of the computer-supported role-playing in travel behavior analysis. He stressed that “the development of a playing machine should be in parallel with the development of its content to avoid problems experienced by the ‘Activity Approach’, where the ‘script’ is far advance of the means to animate it.” Previous examples of using computers to augment travel survey can be found in three main areas: Computer-Assisted Self/Telephone Interviewing (CASI/ CATI), Internet administration, and more recently in interactive geocoding [14].
This paper discusses the prospects and issues of conducting experiments in Virtual Reality where observations of travel behavior of participants can be made when constraints are modified. We conjecture that the constraints that can be best represented in Virtual Reality are those that can be experienced by the participants; for example, changes in their (virtual) physical environment. Virtual Reality and several ways to represent the physical environment in VR are described in the following sections. Examples of VR experiments relevant to travel behavior are also discussed. We then proposed to base the experiments in the context of measuring activity-scheduling behavior. Activity scheduling behavior has been identified as a good indicator of the realistic representation of behavior in travel demand modeling [Bhat and Koppelman]. Furthermore, Doherty [15] pointed out that “observed travel patterns are really the result of unobserved and underlying activity scheduling decision process”; “occurring over many time horizons with significant levels of revision and continued pre-planning during the execution stage.” We expect to be able to collect information on activity-scheduling as it should happen in reality. Theories of scheduling behavior can be found in Ettema et al [16] and Albatross [17] while an activity scheduling process approach to understanding travel behavior is elaborated by Doherty [15]. WHAT IS VIRTUAL REALITY? “Virtual Reality is a way for humans to visualize, manipulate and interact with computers and extremely complex data. The visualization part refers to the computer generating visual, auditory or other sensual outputs to the user of a world within the computer. This world may be a CAD model, a scientific simulation, or a view into a database. The user can interact with the world and directly manipulate objects within the world. Some worlds are animated by other processes, perhaps physical simulations, or simple animation scripts. Interaction with the virtual world, at least with near real time control of the viewpoint, in my opinion, is a critical test for a 'virtual reality'.” (Jerry Isdale, VR News) The first appearance of virtual environments exists as text-based multi-user domains / dimension / dungeon (or commonly known as MUDs), an environment where multiple people may be logged on and interacting with one another. Each user takes control of a computerized persona / avatar / incarnation / character. You can walk around, chat with other characters, explore dangerous monsterinfested areas, solve puzzles, and even create your very own rooms, descriptions and items. [18] Although the initial motivation of MUD environments is for gaming, the application of MUDs have spilled over into research such as in areas of education and communication. We want to establish that the combination of an interview with visual display in an interactive survey procedure with built-in checks results in quite realistic responses so we will not explore the text-only virtual environment method. We examined two commonly known virtual, computer-based, urban representations incorporating interactive elements: Panoramic VR, and 3D modeling. The level of sophistication can range from the simple desktop systems (displays 3D scenes upon the flat screen of a monitor) to more complex immersive systems (e.g CAVE or Head Mounted Device) where the user is made part of the virtual environment [19]. We intent to assess each in turn, as a research secondary task, to determine the possible impacts diverse built virtual urban environment have on the design of a travel behavior measurement device. 3d-Modeling Using 3D modeling, which is a geometry-based method of modeling a city ‘s architecture, can prove to be a daunting task. The process is extremely labor-intensive typically involving surveying the site, locating and digitizing building plans and converting CAD data, made more complicated if they are not already available. Another shortcoming, although minor, is the noticeably computer-generated renderings. At this juncture, one must consider that the necessary resources of time and effort of this method outweighs the results. Efforts to model the appearance and dynamics of the real world from photographs have received increased interest in computer graphics. Debevec et al [20] introduced a hybrid geometry-and image-based approach that combines photogrammetric modeling to derive 3D structures from 2D photographs, model-based stereo algorithm which recovers precisely how the real scene differs from the derived structure, and view dependent texture mapping which produces images by compositing multiple views of the scene. Using the new approach promises benefits of convenience, accuracy, and realism in creating large-scale freely navigable virtual environments. Options to navigating through the city are being considered and include creating a world where users virtually walk, cycle, drive, or be a passenger in a bus or train. Examples of such worlds exist in military training at the Virtual Environments, Modeling, and Simulation research program in the
department of Computer and Information Sciences and Operations, Naval Postgraduate School, Montery, California. (http://web.nps.navy.mil/~code09/profiles.html). Another project investigating navigation in natural and virtual environments can be found at the Max- Plank-Institute for Biological Cybernetics, Tübingen, Germany. (http://www.mpik-tueb.mpg.de). The building of Virtual Türbingen was motivated by the interest in the capability of humans to navigate through known and unknown environments. Many 3D city models have been built but few have the level of representation that we feel supports the possibility of enabling a participant to travel in the environment as she/he would in real life. The challenge we face is to establish what level of representation is adequate. At UCLA, the Urban Simulation team is in the process of creating a virtual model of the entire Los Angeles basin and to great detail (http://www.aud.ucla.edu/proj/usim.htm). Transit related applications for the virtual Los Angeles have also included traffic management and predictions besides the modeling, display and evaluation of alternative environments. The difference between such a model and the system proposed in this paper is that we are interested in recording the responses of the participants when they experience hypothetical changes as they happen in their urban environments and the adjustments that they will make. Having complete (or near complete replica) model of the city is good but what is more important is that the environment can be dynamic where suitable relevant scenarios are presented to the respondent at the right time. To handle this in a more manageable way, we turned to panoramic virtual realities. Panoramic VRs
For some time now, 360 degree panoramic photography has proven to be a very popular representation of environments. With basic equipment (digital cameras, tripod and a panoramic stitching software) it is possible to obtain remarkable results quickly and quite easily. Examples of urban environments created using this method can be found for numerous cities, specifically the virtual cities of Utrecht and Rotterdam in Holland (http://www.frankdata.com), and Vancouver, BC, Canada (http://www.virtvancom) allows the virtual traveler to move up and down streets. We have made improvements to this technique by adding a few more features. The proposed panoramic VR will have a full spherical view of 180 degree vertical and 360 degree horizontal at intersections of the road network at every 30 - 50 m intervals, resources permitting. The virtual traveler will experience the environment at life-size in stereo. S/he can move from location to location by activating indicators (such as “hotspots”) in the direction of travel. To introduce dynamism into the panoramic virtual environment, incorporating the concept of Petri-nets [21] was concluded to be effective and practical to implement. A Petri-net has three basic entities: transitions, tokens, and places. The appropriate panoramic VRs (of which there can be many versions according to time-of-day, weekday/weekend, etc.) can be uploaded when a transition is fired. A transition is fired when its input places contains one or more tokens. Tokens can contain the information about the behavior of the traveler. In a timed Petrinet tokens carry a time stamp. Applications of Virtual Reality are many and varied. Two examples have already mentioned above; training of military personnel at Naval Postgraduate School, Montery, California, research into wayfinding at the Max- Plank-Institute for Biological Cybernetics, Tübingen, Germany, and traffic management and predictions at UCLA. In the arena of transportation, more examples of applicable Virtual Reality technologies can be found in studies of driver behavior and driver training at the Center for Environmental and Traffic Psychology (COV) in Groningen (The Netherlands), intelligent vehicle development at Netherlands Organisation for Applied Scientific Research (TNO, The Netherlands). Interested readers should refer to http://www.inrets.fr/ur/sara/Pg_simus_e.html where projects at many universities and several major car companies such as BMW, Fiat, and Renault are listed. PROSPECTS OF VIRTUAL REALITY Virtual Reality has no difficulty in conjuring up in most peoples’ minds the concept of gaming simulations. It is in itself a stimulating experience yet it is a less threatening environment because respondents are less self-conscious than in an in-depth interview. Individuals respond better when they are under less pressure, have more time to consider their views, and may be prompted to consider viewpoints or express opinions that may not emerge so readily. Furthermore, we like to think that the novelty and dynamics of the virtual reality technology should be able to sustain interest and concentration throughout an interview lasting for several hours. The virtual environment provides a
means to define complex travel dependent variables more realistically, more rigorously and with a greater sensitivity to the geographic (space and time) information more than now is the case. Admittedly relevant properties of the urban environment as one set of possible determinants of behavior can be mirrored none better than in virtual environments. Virtual reality is especially strong in the manipulation of graphical content. The use of visual aids as a component of the tool can be considered a structuring mechanism. In particular, virtual reality enhances the participant’s experience of an environment by the means of immersion and explicitly cutting off external distractions. Although visual aids is an important component of interactivity, we want to point out that the use of a visual technique does not automatically make it an interactive measurement device – it is the responsiveness to the circumstances of the individual. Providing such a flexibility of this nature allows for adjustment of the exploration process through re-ordering the questions to make the experiment relevant to the respondent. There is opportunity to enhance the interview (probing process) to take account of the insights that emerges even during the course of the study. We want the respondents to identify the different dimensions of daily travel pattern: activities, time schedule of those activities, their geographical location, the modes and routes used to access those activities. We can also expect to elicit: household structure and decision rules, interpersonal linkages, personal preferences and priorities, perception of possible options and sources of information; and conduct real-time checks on the realism of anticipated responses. Verification and consistency checks of answers from respondents are easily handled in a computer-based survey. Elimination of three types of errors, namely logical errors, procedural errors and missing information, can dramatically improve the accuracy of the data collected. Creating virtual world puts at our disposal the ability to envision endless possible scenarios that evoke direct responses without causing major disruptions to normal operations. An example of a change in the environment is the building of a new shopping complex in a neighborhood that previously has none and the nearest one is a considerable distance away. This change and the assessment of the impact of change can be realized in the virtual world even before a single brick has been laid for the new building. In addition, the environment representation used in virtual reality can incorporates features of the activity framework including the deductive logic of the time-space format that aids in the comprehension of circumstances, acts as a (passive visual) prompt, and serves as an aide-memoire. An essential idea is to automatically collect contextual information about daily human activities and their characteristics, and to use this information to help the later recall of past activities. The importance of contextual information in assisting the recall of activities is well known in the human memory literature. The use of virtual reality technology supports human memory by increasing the ability to recall or retrieve information. There is also evidence that time-based contextual information is important in the way the various memories are structured [22]. Even with electronic means, such as electronic diaries, the main task of the respondents in filling out questionnaires and travel diaries is still reporting. The key element in this reporting process is the recall of all activities, and their associated aspects and details. Of interest and concern to us is how much more accurate and precise of the reporting of previous day(s) events can be achieved by enhancing the recall process in the virtual environment. The concept of wayfinding [23] expresses that recognition of locations closely approximates the way we deal with movement within familiar environments. In virtual reality, the flow patterns in the visual field alone are enough to indicate how a person is moving in the environment. The perception of the physical environment by individuals differs one from another by their experience and familiarity with the city. It is well known that people depend on their cognitive maps [24] in their daily traveling. Cognitive maps are not perfect representation of the physical environment but instead people have the tendency to leave out minor paths and details while overestimating / underestimating distances or travel times. Information about the environment has great impact on a person’s action plans. Activity scheduling decisions such as choosing locations, route choice and mode of transportation requires a certain amount of stored environmental information. In this aspect it would be interesting to study the influences an individual’s knowledge of the environment has on the activity scheduling process and hence the resulting travel pattern. Given objective constraints such as physical locations and existence of facilities, their opening hours, availability and suitability of transportation and the like,
participation in any kind of activity depends on the subjective constraints such as attitudes, values, habits, and social roles [25] [26] [27] [28]. There is consequently considerable value in observing if the activities of people change due to external environment (for example in the transportation system) or to internal factors. . Various factors used to explain behavior at different levels of aggregation ranging from personal characteristic at the individual level to the heritage and cultural influences at the societal level could be examined. The processes relevant to the understanding of travel behavior at different level of interaction between what are conventionally known as the supply and demand sides is highlighted in Figure 2 [29]. LEVEL OF INTERACTION
INDIVIDUAL
SMALL GROUP SOCIETAL
PROCESSES RELEVANT TO THE UNDERSTANDING OF TRAVEL BEHAVIOR Attitudes & personal values Information & perception of options Cognitive Theory Routine & habit formation Dynamic process/adaptation Social roles & role complexes Life cycle & changes in life-style Leadership/peer-group influences Social “regimen” Institutional constraints Cultural influences Heritage & “milieu”
Figure 2: Factors Thought to Influence Travel Behavior at Different Levels of Interaction
Computers are excellent in supporting a researcher in several ways. Commonly employed in computers are the visual interface tools. Not only do they make it easier to enter information by the facility of dragging and dropping objects (that represent activity types) on a time scale ruler/calendar, visual tools serve to engage the participants and by that invoke them to give more and detailed information. Furthermore, a “planning assistant” (an intelligent agent) can be programmed to call for necessary information as and when needed. With the available structural information provided by the participant at the start, the planning agent will be able to dynamically determine if the entries made by participants are admissible or not. An example of an invalid entry is when the starting time of one activity is earlier than the end time of the previous activity. Increased interactivity is established when the planning assistant prompts the participant because inaccurate data had been entered or information is missing. Both sound (conversations between participants and planning assistant) and visual cues will play an important role in ensuring that the participants are guided along in a systematic way to complete the experiments. At the University of Rochester, there is experience in efforts to build a conversationally proficient planning assistant in the TRAINS project [30]. A key part of that project is the construction of the TRAINS system, which provides the research platform for a wide range of issues in natural language understanding, mixed-initiative planning systems, and representing and reasoning about time, actions and events [31]. Depending on the habits of individuals the process of scheduling could be a natural or unnatural task since some people do not schedule their activities in advance. Suppose that the participant in question is in the habit of planning a schedule, it is assumed that the activity schedule is mentally executed at this stage. Whether an individual plans a detailed schedule or enters only significant or main activities, at least some of his/her intentions can be captured. It is important to note that the scheduling process does not stop at this stage but continues even during the execution of the schedule. An attempt to record the scheduling process in its natural form is described in iChase [32]. Schedule tracing via the iChase program covers both the pre-travel and post-travel stage but the execution of the travel itself remains to be studied. This is where the strength of virtual environments comes into play where the participants are able to step through his/her schedule as s/he had in reality. We borrow from the concept of creating personal avatars from the domains of cyber-worlds and virtual communities. This is a well-known practice in which people create synthetic versions of themselves that can then be “projected” into and participate as citizens of a virtual world
ISSUES Due to the complexity of setting up the experiment facility, it is likely that the participants involved in the experiment have to travel to the facility. This could be restrictive in the sense that less mobile persons may not be too keen to be involved. It would certainly be very difficult to schedule in whole households. It would also mean that a greater incentive is required to encourage participants to return for repeat experiments if necessary. As the participants are not likely to be expert users of virtual reality systems, care must be taken to enable navigation in the virtual world to be as plain and as natural as possible in order to minimize effects of information overload and coordination problems, in order to concentrate the major effort of the participant on completing the tasks at hand. The common tasks of travel and object selection / manipulation which are easily executed in real live are interaction techniques that have to be established based on the principles of virtual environment interaction which is still undergoing evaluation [33]. In real life, one would be walking, driving, or cycling on the selected mode of transport. The navigation devices of a steering wheel or treadmill or stationary bicycle are all available. Unfortunately, it would pose a practical inconvenience of having to switch from one device to the next. Virtual devices are alternatives but the level of realism would be reduced. It is established that proprioception (the ability to form a mental description of the dynamic spatial and relational disposition of our body and its parts, for example we can clap two hands together without looking) is important in VR experiences but this might have to be sacrificed in this juncture until virtual reality hardware can match all physical movements of human locomotion [34]. Users of VR systems are susceptible to problems of motion sickness introduced by the technology. For example, large immersive displays can envelope our field of vision and the conflict between the equilibrium signals provided by the vestibular systems and the motion cues from the visual system are thought to be the cause. Although not everyone suffers from it, we cannot ignore the effect it has and efforts are required to minimize adverse effects. The activity-based approach entails the collection of data regarding all activities both in-home and out-of-home pursued by individuals over the course of a day or multiple days. However, it is highly improbable that a participant will be expected to undergo an re-enactment in real time; the experiment will have to be carried out in compressed time. This is analogous to a “fast forward” experience. There is not a lot of information on this very neglected aspect of a virtual reality experience as it has always been the focus of researchers to understand interaction in real time. Employing virtual reality technology is an extremely expensive option at this point in time. It remains to be proven that it can be a cost-saving measurement device. PROCEDURE The experiment is structured along the lines of establishing the chain of “objective circumstances – personal perception – subjective situation – individual decision – behavior” and that the aspect of allowing for people to re-enact their behavior can be accomplished within a virtual environment. Pretest: Creating A Personal Virtual World The participant will be asked to provide profile information that can be used to generate a personal individual world. It can be anticipated that the “world” of an individual would not cover the whole city but a subset of it. Therefore, each participant will create an individual world that provides the indication as to the activities that he/she currently engages in and expects to engage in, the location s/he visits and will visit in the near future, and the individual’s applicable means of travel. This step attempts to capture the personal constraints, possibly including aspects of the concepts of “role” and “life style”. In the first instance, wherever possible, we will use residents of the urban area under study who are already familiar with the environment to some extent. It is the intention that participants undergo this step because through the necessity of creating their “virtual world” they consequently have an opportunity to feel involved with the experiment. This should also contribute towards our comprehension of the kind of environmental information used by the participants with regards to the activity scheduling. Much of the time participants will be guided but are free to choose from or ignore help lists provided.
“Lifestyle” Perception of Information & Options
Routines & Habits
Environment Cognitive Map
Attitudes & personal values
Figure 3: Creating Personal Virtual Worlds
Reenactment: “Executing The Schedule”
The schedule is then re-enacted by the participation of the participant in the virtual world. At this stage, the virtual world becomes populated with different elements such as objects of the environment, simulated traffic and pedestrians. A simulation run starts with the planned schedule and the participant will meet with “obstacles” in his/her way of achieving the plan due to the simulated environmental constraints and possibly unforeseen events. By establishing a representation of the consequences of choices, a participant is confronted with the implications of his/her decisions. Re-scheduling will be required in order to achieve the goal. However, re-scheduling may create other “obstacles” and a new situation arises which has to be overcome. Adjustments to new situations are manifested as rescheduling. The process of the participant arriving at an optimum (or acceptable) schedule will be one of iteration and adaptive learning (Figure 4). This is in coherence with the stated adaptation class of stated response approach, one of the four classes of interactive response data collection set down by Lee-Gosselin (Table 1 above). Behavioral outcomes are mostly elicited, given constraints expressed as personal, household, social, spatial attributes, etc. The focus is on reactive and trial behavior, problem solving, and decision rules. There is considerable potential to learn about the impact of non-travel decision on travel patterns and the assumptions that people make about their alternative travel options. Simulated Global World Scenarios, Obstacles, New Events, Policy Changes
Preliminary Schedule
Revised Schedule
Adjusted Schedule
Acceptable Schedule STOP
START
Reasoning, Decision making principles, Attitudes, Motivation Cognitive Environment
Fig 4: Adaptive Behavior
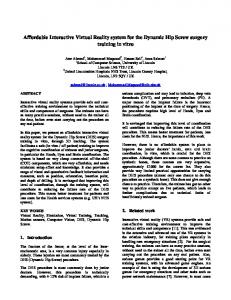
The participants can expect to carry out the experiment at two levels; they will be given the task of recalling the activities of yesterday and to “re-live” yesterday by “re-enactment” in a virtual environment. Participants are placed in front of a big screen (see Figure 5 for hardware system setup) where stereoscopic images of panoramas are projected, one for the left eye, and another for the right eye. The use of polarized glasses is necessary to perceive the stereoscopic viewing on the screen. Participants are asked to navigate through virtual environment created based on the profile information provided earlier. The participant is able to revisit the locations they were at and to remember the
activities they were engaged in, their start and end times, the transport mode used and the routes taken to arrive at the location, etc., all within the confines of a virtual environment. From this process of “reenactment” we expect that participants are better able to recall more detailed information of yesterday because of visual and audio cues. All additions, deletions, and modifications to the initial information given can be updated to reveal a “nearer to reality” report. The participants will be instructed to describe freely the thoughts that go through their minds at any time, to discuss the decisions they made, and to indicate what information they relied on. The experimenter has the function of encouraging this verbalization during the execution of the schedule. The proceedings of the whole conversation will be recorded on tape. As simulator sickness is a concern, participants will be given the choice to stop the experiment whenever signs of fatigue, for example when losing one’s orientation, occur frequently. While there is no strict time in which to complete the execution, we do not expect the session to last longer than 1 - 2 hours. The end product of this gaming session is a record of representations of modified spatial and temporal activity-travel patterns arising from the discrepancy between what is planned and what can be realized, and a linguistic mode of expressing decisions. The latter record forms the data towards transcribing a decision tree.
Figure 5: Hardware System Setup
Level 1 Recall and Reenactment 1.
A participant is asked to “recall’ yesterday by recreating yesterday’s schedule. By giving yesterday’s activity types, locations where they are conducted, transport mode used to get to locations, start and end times of each activity, and person(s) the activity was carried out with. Result recorded, initial schedule of yesterday.
2.
Participant “reenacts” yesterday by stepping through the day.
3.
“In-process” inclusion and deletion of information and other details provided by the participant are recorded. Final recalled yesterday’s schedule recorded.
Level 2 Change in the environment 4.
A simulated constraint is changed and reflected in the virtual environment. The new scenario is explained and highlighted to the participant.
5.
Based on yesterday’s schedule, the participant is requested to make revisions due to change. Basically, he/she is asked to answer what they would have to do differently due to the new situation.
6.
Final revisions to “original” yesterday’s schedule recorded as “new” yesterday’s schedule.
Posttest Finally, participants will be presented with a questionnaire regarding their experience in the virtual environment such as illness or discomfort while navigating the virtual environment. Data analysis
Examine results for Level 1 “Initial yesterday’s schedule” is compared with “Final recalled yesterday’s schedule”. Examine results for Level 2 “Original” yesterday’s schedule is compared with “New” yesterday’s schedule. The raw data of verbalized decision-making process is coded using a notation system and then transcribed into decision diagrams showing the decision structure and the links between decisions and the environmental information used. CONCLUDING REMARKS It is very desirous, if not essential, for the participants in the virtual environment to be able to travel anywhere and view the world from their viewpoint in a digitally accurate perspective. The important emphases are on the aid to recall and the re-enactment of one’s past activity schedule. Some aspect of simulating the actual physical action of walking, cycling, or driving creates the experience of movement. Behavior in the virtual environment can be monitored by an observing agent that collects information about the interactions amongst the various objects in the virtual world. Agent tools generating statistics about participants’ movement and choices, as well their response performance will be useful besides recording the number of inconsistencies and unaccounted time. We hope to infer from the experiential information “extracted“ from the participants their reasoning, attitudes, and motivation of decision-making in the context of activity scheduling. In other words, we are interested in deducing behavioral rules behind the actions and adaptations in response to changes. These rules can then be used to model traffic patterns and predict transport demand in a new area of interest. We cannot be for certain about the bias that is inevitably introduced with the use of a new instrument to understand travel decision-making. Again, based on the profile of the participant, presuggested schedules can be generated to assist the participant thereby cutting down time. However, whether manipulating suggested schedules versus starting a schedule from scratch would affect the decision making process is not clear and needs to be tested. Qualitative and quantitative analysis of the experiment in the aspects of wayfinding, tasks difficulty and realism, personal involvement and respondents’ burden, level of motivation to do the tasks, and respondents’ feedback should contribute towards future research into the design of interactive virtual world experiments. While we expect that using virtual reality in a survey instrument can potentially yield interesting results, we have to keep in mind that it is yet unknown that the extent of spatial understanding experienced in a virtual environment is accurate in the real world. REFERENCES 1.
Hanson, Susan and Burnett, K. Patricia. Understanding Complex Travel Behavior: Measurement Issues. In New Horizons in Travel-Behavior Research (Peter R. Stopher, Arnim H. Meburg, and Werner Brög, eds.), D.C. Heath, 1981, pp 207-230.
2.
3.
4.
5.
6.
7.
8. 9.
10. 11.
12.
13.
14.
15.
16. 17.
18. 19. 20.
21. 22. 23. 24. 25.
Brög, W., and Erl, E. Interactive Measurement Methods: Theoretical Bases and Practical Applications. In Transport Research Record 765, Transportation Research Board, National Research Council, Washington, D.C. 1980. Jones, P. M. Dix, M. C., Clarke, M. I., & et al. Supplementary Surveys: Investigating the Dynamics of Change. In Understanding Travel Behavior. Oxford Studies in Transport. Gower Publishing, 1983, pp 130-146. Ettema, D., Borgers, A., and Timmermans, H. P. J. Using Interactive Computer Experiments for Identifying Activity Scheduling Heuristics. In Proceedings of the 7th International Conference on Travel Behavior, Valle Nevado, Chile, July 1981. Kalfs, N. and Saris, W. E., New Data Collection Methods in Travel Surveys. In Activity-Based Approaches to Travel Analysis (Ettema, D. F. and Timmermans, H.J. P. eds.) Pergamon-Elsevier, 1997, pp 243-261. Draijer, G., Kalfs, N., and Perdok, J. Possible Application of Global Postitionin Systems (GPS) for Collecting Travel Data, Project Report. Transport Research Centre of the Ministry of Transport, Public Works, and Water Management, The Netherlands, 1998. Wolf, J., Guensler, R., Washington, S., and et al. The Use of Electronic Travel Diaries and Vehicle Instrumentation Packages in the Year2000 Altlanta Regional Household Travel Survey. In Proceedings of Personal Travel: The Long and Short of It. Transport Research Board, Washington DC, June, 1999. Wang, D. Borgers, A., Oppewal, H. and Timmermans, H.J.P. A Stated Choice Approach to Developing Multi-Facet Models of Activity Behavior. To appear in Transportation Research. Jones, Peter M. (1985) Interactive Travel Survey Methods: The State of-the-Art, In New Survey Methods in Transport, 2nd International Conference, Hungerford Hill, Australia 12-16 Sept, 1983, pp 99-127. Jones, P. M. ‘HATS’: a technique for investigating household decisions. In Environment and Planning A, 1979, Vol 11, pp 59-70. Lee-Gosselin, Martin E. H. Scope and Potential of Interactive Stated Response Data Collection Methods, In Conference on Household Travel Surveys: New Concepts and Research Needs, Irvine, California, March 12-15, 1995, pp115-133. Jones, P., Bradley, M., and Ampt, E. Forecasting Household Response to Policy Measures Using Computerised Activity-based Stated Preference Techniques. In Travel Behavior Research, Gower Press, 1989. Axhausen, Kay W. The Role of Computer-Generated Role Playing in Travel Behavior Analysis. Paper presented at the 23rd UTSG Annual Conference in Nottingham and at the 70th Transportation Research Board Meeting, Washington, DC 1991. Resources Systems Group, Inc. Computer-Based Intelligent Travel Survey System: CASI/Internet Travel Diaries with Interactive Geocoding, Final Project Report – SBIR Contract No. DTRS57-98C-00068. April 1999. Doherty, S. T., (2000) An Activity Scheduling Process Approach to Understanding Travel Behavior, 79th Transportation Research Board Meeting & Conference. Washington D. C., January 6-10, 2000 to appear in Transport Research Record. Ettema, D., Borgers, A., and Timmermans, H. J. P. Simulation Model of Activity Scheduling Behavior, Transportation Research Record, No. 1413, 1993, pp 1-11. Arentze, T., Hofman F., Mourik, H. van, and Timmermans, H. J. P. Albatross: A Multi-Agent Rule-Based Model of Activity Pattern Decisions. In 79th Transportation Research Board Meeting & Conference, Washington D. C., January 6-10, 2000 to appear in Transport Research Record. http://www.cybertown.com, http://www.holodesk.com, http://www.activeworlds.com. Vince, J. Essential Virtual Reality Fast. Springer-Verlag, London. 1998 Debevec, Paul E., Taylor, Camillo J., and Malik, Jitendra. Modeling and Rendering Architecture from Photographs. SIGGRAPH ’96 23rd International Conference on Computer Graphics and Interactive Techniques, New Orleans, Louisiana, USA, August 4-9, 1996. Peterson, James, L . Petri net theory and the modeling of systems. Englewood Cliffs : PrenticeHall, 1981. Tulving, Endel. Elements of Episodic Memory. Oxford University Press. 1983. Passini, Romedi. Wayfinding in Architecture, Van Nostran Reinhold Company Inc. 1984 Lynch, Kevin. The Image of the City. Cambridge, MA: MIT Press. Levin, Irwin, P. New Applications of Attitude-Measurement and Attitudinal Modeling Techniques in Transportation Research. In New Horizons in Travel-Behavior Research (Peter R. Stopher, Arnim H. Meburg, and Werner Brög, eds.), D.C. Heath, 1981, pp 171-188.
26. Bichon, John A. and Benwell, Mary. Travelers’ Attitudes and Judgements: Application of Fundamental Concepts of Psychology. In New Horizons in Travel-Behavior Research (Peter R. Stopher, Arnim H. Meburg, and Werner Brög, eds.), D.C. Heath, 1981, pp 189-203. 27. Tisher, Mary Lynn. Attitude Measurement: Psychometric Modeling. In New Horizons in TravelBehavior Research (Peter R. Stopher, Arnim H. Meburg, and Werner Brög, eds.), D.C. Heath, 1981, pp 111-138. 28. Havens, John J. New Approaches to Understanding Travel Behavior: Role, Life-Style, and Adaptation. In New Horizons in Travel-Behavior Research (Peter R. Stopher, Arnim H. Meburg, and Werner Brög, eds.), D.C. Heath, 1981, pp 269-287. 29. Hills, Peter J. and Mitchell, Christopher G. B. New Approaches to Understanding Travel Behavior. In New Horizons in Travel-Behavior Research (Peter R. Stopher, Arnim H. Meburg, and Werner Brög, eds.), D.C. Heath, 1981, pp 317-332. 30. Allen, J. F., Schubert, L. K., Ferguson, G., et al. The TRAINS Project: A case study in building a conversational planning agent, Journal of Experimental and Theoretical AI, 7, 1995, pp 7-48. 31. Allen, J. F., Ferguson, G., Miller, B., and Ringger, E. (1995) Spoken Dialogue and Interactive Planning, Proceedings of the ARPA Spoken Language Technology Workshop, Austin, Texas, January 1995. 32. Lee, Ming S. Doherty, Sean T., Sabetiashraf, R. et al. iCHASE: An Internet Computerized Household Activity Scheduling Elicitor Survey, 79th Transportation Research Board Meeting & Conference, Washington D. C., January 6-10, 2000 to appear in Transport Research Record. 33. Bouwman, D. A., Johnson, D. B., and Hodges, L. F. (1999) Testbed Evaluation of Virtual Environment Techniques, Proceedings of the ACM symposium on Virtual reality software and technology, December 20 - 22, 1999, pp 26 – 33. 34. Slater, M., Usoh, M., and Steed A. (1995) Taking Steps: The Influence of a Walking Technique on Presence in Virtual Reality, ACM Transactions on Computer-Human Interaction, Vol. 2, No.3 September 1995, pp 201-219.