Jan Broenink, Herman Roebbers, Johan Sunter, Peter Welch, and David Wood (Eds.) IOS Press, 2005. Interactive Computing with the. Minimum intrusion Grid ...
Communicating Process Architectures 2005 Jan Broenink, Herman Roebbers, Johan Sunter, Peter Welch, and David Wood (Eds.) IOS Press, 2005
261
Interactive Computing with the Minimum intrusion Grid (MiG) John Markus BJØRNDALEN a, Otto J ANSHUS a and Brian VINTER b a University of Tromsø, N-9037 Tromsø, Norway b University of Southern Denmark, Campusvej 55, DK-5230 Odense M, Denmark Abstract. Grid computing is finally starting to provide solutions for capacitycomputing, that is problem solving where there is a large number of independent tasks for execution. This paper describes the experiences with using Grid for capability computing, i.e. solving a single task efficiently. The chosen capability application is driving a very large display which requires enormous processing power due to its huge graphic resolution (7168 x 3072 pixels). Though we use an advanced Grid middleware, the conclusion is that new features are required to provide such coordinated calculations as the present application requires.
1. Introduction Grid computing promise endless computing power to all fields of science and is already being established as the primary tool for eScience. Applications run on Grid, however, are generally capacity class applications, i.e. applications that can trivially be divided into a large number of tasks without intercommunication or deadlines for termination. If Grid should really provide processing power for all kinds of applications it must also support capability class applications [1], e.g. support deadlines or intercommunication. In this paper we investigate the current performance of Grid when running a deadline-driven application, the rendering of very large images for a display wall. A display wall is a high-resolution computer display the size of a wall, with the combined resolution and other graphical capabilities of several common off-the-shelf display cards. The display wall features as a physical wall in a room with digital video sensors for calibration, gesture recognition, video-recording etc., and with multi-channel sound systems for audio input and output. The size and resolution are typically at 230 inches and 22 megapixels – an order of magnitude larger than a high-end 23-inch display. Creating the content for such a large high-resolution display, coordinating the individual computers to deliver coherent images, and moving the individual megapixel tiles to each computer for displaying are all challenges. In this paper we report on the use of a Grid-type computing resource to quickly create content for interactive use. 1.1 Capacity vs. Capability Computing High Performance Computing, HPC, is typically divided into two groups [1]: capacitycomputing and capability-computing. Capacity-computing targets solutions that are not feasible on an ordinary computer, e.g. ‘Grand Challenge Computing’. Tasks that are capability driven may be divided into three rough groups. The first group of problems requires so much memory that they only fit particular supercomputers. The computer that currently has the most shared memory is the NASA Colombia with 20TB of memory which is addressable from any processor in the machine. The second group of capability driven applications include those with such large computational
262
J.M. Bjørndalen et al. / Interactive Computing with the Minimum Intrusion Grid (MiG)
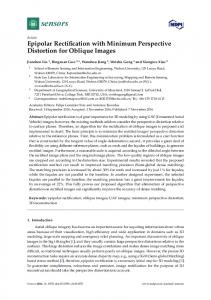
requirements that starting them on a PC would not make sense since waiting for faster computers would be faster. An example of this is shown in Figure 1, where a computation task that uses a current PC (Year 0) will take 10-years, but waiting a year, to benefit from faster computers, allows the total time to wait for a result to drop to just under 8 years, and in fact the best scenario is to wait three years which will allow a final result in just 5.5 years from Year 0. 100.00%
Remaining Work
Year 0 Year 1 Year 2 Year 3 Year 4
90.00% 80.00% 70.00% 60.00% 50.00% 40.00% 30.00% 20.00% 10.00% 0.00% 1
2
3
4
5
6
7
8
9
10
Year
Figure 1. The start time vs. end time of a fixed calculation when starting the computation immediately, or waiting to benefit from faster computers introduced later.
The third and final application group for capability computing is applications with a deadline. This can be hard deadlines, such as whether forecasting, or soft deadlines, such as applications that are meant for human interaction. An example of such an application is the process of planning cancer radiation therapy [1]. Capacity-computing, on the other hand, involve simpler tasks which typically can be executed on a PC; the only challenge is that there are a vast number of them. Such capacitydriven applications are common in science and are thus the driving motivation for many Grid projects. Examples of capacity-driven problems include parameter studies, Monte Carlo simulations and genetic algorithm design. 1.2 Grid Computing vs. Public Resource Computing Looking for examples of Grid computing, many people first think of Public Resource Computing (PRC). Popular PRC projects include SETI@Home and Folding@Home. A successful platform for PRC is the Berkeley BOINC project [2]. PRC computing is, like Grid computing, very well suited for capacity-computing. The main difference between Grid and PRC is that in Grid computing, the resources allow multiple users running arbitrary applications, while in PRC resources allow a specific server to submit input tasks (called work units) to a specific application on the resource, thus Grid computing is far more flexible than PRC when it comes to diverse use of the resources.
J.M. Bjørndalen et al. / Interactive Computing with the Minimum Intrusion Grid (MiG)
263
1.3 Grid for Capability Computing This paper seeks to investigate the possibilities for utilizing Grid for capability computing rather than only serving the current capacity-computing model. None of the current Grid middlewares support real-time or even deadline scheduling of tasks, which in essence makes capability computing on Grid very hard. It is our hope that we will expose a set of deficiencies in Grid with respect to capability computing which can then function as input for a process to introduce the required functions in order to enable Grid to handle capability computing. The motivating example will be graphics rendering for a very large display, described further in Section 2. The Grid we use for the experiments, Minimum intrusion Grid, is described in Section 3 and Section 4 describes the experiments while Section 5 analyses the results. 2. The Display Wall The display wall1 used in the experiments reported on in this paper is located at the University of Tromsø, Norway. The display wall use back-projection employing 28 off-theshelf projectors, each with a resolution of 1024 x 768 pixels. The projectors are physically tiled as a 7 x 4 matrix giving a combined resolution of 7168 x 3072 pixels (see Figure 8 for an image of the Display Wall). Separate display cards in separate display hosts drive each projector. The 28 tiles of the display are software coordinated over a COTS (commodity off-the-shelf) local area network to achieve the appearance of one large, high-resolution, seamless computer display. Each computer driving a projector executes a VNC (Virtual Network Computer) [4] client fetching a tile from a VNC server running on a remote computer. A 1-Gigabit Ethernet is used for interconnect. The compute resources for the display wall are physically located close to the display wall, but they are accessed through a Grid interface (MiG, see below) located on a computer at the University of Southern Denmark. File storage is also handled by the Grid interface, including the physical storage of the files. 3. Minimum intrusion Grid MiG [5] is a Grid middleware model and implementation designed with previous Grid middleware experiences in mind. In MiG central issues such as security, scalability, privacy, strong scheduling and fault tolerance are included by design. Other Grid middlewares tend to suffer from problems with at least one of those issues. The MiG model seeks to be non-intrusive in the sense that both users and resources should be able to join the Grid with a minimal initial effort and with little or no maintenance required. One way to obtain these features is keeping the required software installation to a functional minimum. The software that is required to run MiG includes only ‘need to have’ features, while any ‘nice to have’ features are completely optional. This design philosophy has been used, and reiterated, so stringently that in fact neither users nor resources are required to install any software that is MiG-specific. Another area where MiG strives to be non-intrusive is the communication with users and resources. Users in general and resources in particular can not be expected to have unrestricted network access in either direction. Therefore the MiG design enforces that all communication with resources and users should use only the most common protocols 1
Supported by the project “Advanced Scientific Equipment: Display Wall and Compute Cluster”, Norwegian Research Foundation (NFR project no. 155550/420)
264
J.M. Bjørndalen et al. / Interactive Computing with the Minimum Intrusion Grid (MiG)
known to be allowed even with severely restricted networking configurations. Furthermore resources should not be forced to run any additional network-listening daemons.
User
Resource
GRID
GRID
Resource
User User
GRID
Resource
Resource Figure 2. The abstract MiG model
Figure 2 depicts the way MiG separates the users and resources with a Grid layer, which users and resources securely access through one of a number of MiG servers. The MiG model resembles a classic client server model where clients are represented by either users or resources. The servers are represented by the Grid itself, which in the case of MiG is a set of actual computers, not simply a protocol for communicating between computers. Upon contacting Grid any client can request to either upload or download a file. Users in turn can additionally submit a file to the job queue while resources can request a job. Most of the actual functionality is located at the MiG servers, where it can be fully maintained and controlled by the MiG developers. Thus, in addition to minimizing the user and resource requirements, the Grid layer simplifies consistent deployment of new versions of the software. The security infrastructure relies on all entities: users, MiG-servers and resources, being identified by a signed certificate and a private key. The security model is based on sessions and as such requires no insecure transfers or storage of certificates or proxycertificates, as it is required with some Grid middlewares. Users communicate securely with the server by means of the HTTPS protocol using certificates for two-sided authentication and authorization. Server communication with the resources is slightly more complicated as it combines SSH and HTTPS communication to provide secure communication and the ability to remotely clean up after job executions. MiG jobs are described with mRSL, which is an acronym for minimal Resource Specification Language. mRSL is similar to other Resource Specification Languages, but keeps the philosophy of minimum intrusion, thus mRSL tries to hide as many aspects of Grid computing as possible from the user. To further hide the complexities of Grid computing from the user, MiG supplies every user with a Grid home directory where input and output files are stored. When a job makes a reference to a file, input or output, the location is simply given relative to the user’s home directory and thus all aspects of storage elements and transfer protocols are completely hidden from the user. The user can access her home directory through a web interface or through a set of simple MiG executables for use with scripting.
J.M. Bjørndalen et al. / Interactive Computing with the Minimum Intrusion Grid (MiG)
265
Job management and monitoring is very similar to file access so it is also done either through the web interface or with the MiG executables. Users simply submit jobs to the MiG server, which in turn handles everything from scheduling and job hand-out to input and output file management. An important aspect of this is that a job is not scheduled to a resource before the resource is ready to execute the job. Resources request jobs from the MiG server when they become ready. The MiG server then seeks to schedule a suitable job for execution at the resource. If one is found, the job, with input files, is immediately handed out to the resource. Otherwise the resource is told to wait and request a job again later. Upon completion of a job, the resource hands the result back to the MiG server which then makes the result available to the user through her home directory. Even though MiG is a new model, we have already implemented a stable single-server version. It relies on the Apache web server (http://httpd.apache.org/) as a basis for the web interface and further functionality is handled by a number of cgi-scripts communicating with a local MiG server process. We have decided to implement as much of the project as possible in Python (http://www.python.org/) since it provides a very clear syntax and a high level of abstraction, and it allows rapid development. 4. Experiments As an example application, we use POV-Ray [5] to render an image with full resolution for the display wall. Rendering the example chess2.pov file at the full 7168 x 3072 resolution required a small change to the POV-Ray control file to render at the correct aspect ratio. We compare the time it takes to render a single image using one cluster node in Tromsø with the time it takes to run on MiG using jobs with 1, 2, 4, 8, 16, 23, and 63 tasks. For the Grid benchmarks, we split the image into equal-size parts, and submit job description files describing the necessary parameters to each POV-Ray task. For the remainder of the paper, we use the term Job to describe the collection of tasks that produce the necessary fragments of an image to form the full image. Each task is submitted to MiG as a separate MiG job, but to avoid confusion, we will call these tasks. We use the +SR (Start Row) and +ER (End Row) parameters to POV-Ray to limit the number of rows each task should render. The partial images are downloaded to the client computer and combined. The execution time of the entire operation and of individual tasks are examined and compared to the sequential execution time. Also, we profile the application to examine MiGs limitations for near-interactive use, and to provide design input for MiG. 4.1 Methodology We measure the time from when the first task is submitted until the last image fragment is received and all fragments are combined into one file. We also measure the time it takes to download the individual image fragments. To profile the execution of our tasks in MiG, we use MiGs job status reporting facility. MiG provides a log that shows the time when each task is received by the MiG server, when the task is entered in the queue system, when the task is picked up and starts executing, and when the task finishes. This provides us with a tool to examine when each task was executed, how long it executed and to examine some of the overheads in MiG that may limit scalability.
266
J.M. Bjørndalen et al. / Interactive Computing with the Minimum Intrusion Grid (MiG)
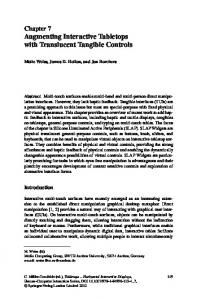
4.2 Hardware Twenty-three of the MiG nodes have POV-Ray 3.6 installed, which limit the scalability we can study in this paper. The 23 nodes are part of a larger 40-node Rocks [6] cluster, consisting of Dell Precision Workstation 370 nodes, each with a 3.2-GHz Intel Pentium 4 Prescott EMT64 and 2 GB RAM. The MiG client is a Dell Precision Workstation 360 with a 3.0-GHz Intel P4 Northwood processor with 2 GB RAM, running Debian Linux (Debian unstable). The client machine is connected to the department’s 100-MBit backbone Ethernet. The Rocks cluster is located in Tromsø, the MiG server is located in Denmark, and the client machine is located in Tromsø. 4.3 Skewed System Clocks in the Experiments Note that during our experiments, we found that the system clock in the MiG server was about 47 seconds slow (tasks were registered in the log 47 seconds before the client node sent them). Furthermore, the “finished” timestamps in the MiG status logs use the local clocks of the compute nodes, thus subtracting the “finished” timestamp from the “executing” timestamp produces an incorrect execution time for the experiments. To correct for this, we subtracted 47 seconds from the “finished” timestamp when calculating the execution times measured with the MiG status log facility. This did not significantly alter our results or conclusions, except in one place: in Figure 6, instead of observing that the first task finished a few seconds after the last task started executing (which was the original conclusion), we now have 3 tasks that finish before the last task starts executing. Thus, we are not guaranteed that we in fact are using 23 nodes in the cluster. The results have been verified through multiple runs that showed similar behavior, but only one set of experiments is reported on in this paper. Create image 9000 8000 7000 Seconds
6000 5000
Create image
4000 3000 2000 1000
23
63
ta sk s ta sk 16 s ta sk s 8 ta sk s 4 ta sk s 2 ta sk s 1 ta se sk qu en tia l
0
Figure 3. Total execution time from a client submits the first task until all results are received and combined into an image. The “sequential” time is the execution time of POV-Ray rendering the entire image on one of the cluster nodes without using MiG.
J.M. Bjørndalen et al. / Interactive Computing with the Minimum Intrusion Grid (MiG)
267
5. Results Rendering time on one of our cluster nodes without using MiG is 8169.37 seconds, or 2 hours, 16 minutes, 19.37 seconds. A speedup of 23 would reduce this to 355.17 seconds, or 5 minutes and 55.17 seconds. Figure 3 shows the total execution time of creating an image using MiG, including the time to submit the tasks, retrieve partial image files and combine the fragments. The graph shows that the minimum job execution time, at 23 tasks, is 754 seconds, or 12 minutes 34 seconds. This is fast enough to get a result image while attending a meeting. The speedup, however, is 10.84, which is less than linear. 5.1 Task Submission and Result Retrieval Overheads Part of the overhead when rendering with MiG, is the time necessary to send the tasks to the MiG server (task submission overhead), and the time to retrieve the image fragments to the client and combine them. Figure 4 shows the total execution time broken down into MiG task submission time, time spent waiting for and downloading results and the time spent combining the image fragments to a single image. Component times 3000 2500
Seconds
2000 combine Compute and recv
1500
Submit 1000 500 0 63 tasks
23 tasks
16 tasks
8 tasks
4 tasks
Figure 4. Component times.
Submitting tasks takes about 1 second per task. Compared to the total execution time of the rendering job, this is relatively small. The only overhead visible on the graphs is the task submission at 63 tasks where task submission takes 67 seconds out of a total of 1057 seconds. The overhead of transferring files from the MiG server to the client is partially hidden by transferring the files immediately when the client discovers them. The client retrieves a list of available files from the MiG server every 10 seconds. When the client discovers that an image fragment is available, the client immediately downloads the fragment. With 23 tasks, the fragment sizes are typically transferred in 4 to 5 seconds. Since the tasks do not finish at the same time, the download time of the last file is usually the only visible download overhead contributing to the total execution time for the job.
268
J.M. Bjørndalen et al. / Interactive Computing with the Minimum Intrusion Grid (MiG)
Combining the image fragments takes from 0.4 to 0.8 second for all variations of number of tasks. For up to 63 tasks, this doesn’t add enough overhead to significantly impact the scalability. In total, for the 23-fragment job that has the lowest execution time, the reported time shown in Figure 4 is 754 seconds. Removing the measured overheads (including the download time of the last fragment), we get a MiG execution time of 728 seconds, which would have given us a speedup of 11.22. 5.2 MiG Internal Overheads The major contribution to scalability in the system is clearly not the client side or the communication between the client and the server, so we investigate the internal overhead using the MiG job status log to profile the tasks. Figure 5 shows a timeline of the rendering job split into 4 tasks. Shown are: • • • •
receive time, the time it takes before a task is received (measured from when the first task was received); queue overhead – the time it takes from when the task was received until it is entered into the job queue; queue time – the time the task spends in the queue until it is executed and execution time – the execution time of the task. Timeline for 4 tasks
task003
task002 receive queue overhead queue exectime task001
task000
0
500
1000
1500
2000
2500
3000
Seconds from start
Figure 5. Timeline for 4 tasks. Queue time is not significant here. The timeline shows that the execution time of each part of the image varies by more than a factor 2.5.
The figure shows that the irregular execution time of POV-Ray on different parts of the image, which is a result of the varying computational complexity of each image fragment, is a major contribution to the scalability of the application. This pattern continues to be a problem at all problem sizes that we have studied. Note that the other times have no impact for this example.
J.M. Bjørndalen et al. / Interactive Computing with the Minimum Intrusion Grid (MiG)
269
Timeline for 23 tasks task022 task020 task018 task016 task014 receive
task012
queue overhead queue
task010
exectime
task008 task006 task004 task002 task000 0
100
200
300
400
500
600
700
Seconds from start
Figure 6. Timeline for 23 tasks. The first three tasks finished before the last three tasks started. Task execution time varies by a factor 3. Tasks also spend a significant amount of time in the job queue before execution starts.
At 23 tasks, equal to the number of worker hosts, the minimum execution time is 144 seconds, the average 354 seconds and the maximum 460 seconds. In Figure 6, we see that most tasks wait a minute or more before they start executing, contributing significantly to the computation time. What is worse, the task that starts latest is also the task that has the longest execution time; the most complex image fragment was scheduled last. This suggests a number of remedies to improve the scaling of the application using better task execution time balancing, better scheduling, and reduced overhead for the MiG queues. Better task execution time balancing would bring the execution time down to around 354 seconds for each of the 23 tasks, reducing the total time by 106 seconds, but both this and better scheduling would require knowledge of the computational complexity of each row of the image. We may be able to approximate this by first rendering the image at a lower resolution, recording the computation time of sections of the image, but we have not experimented with this. Reducing queue overhead in MiG would also improve the scheduling: the overhead of task submission and queue time for the task that finished last was in total 181 seconds: it took 20 seconds until the task was received by MiG, 1 second to queue the task, and the task waited 160 seconds in the queue before it started executing. A simple method of improving load balancing that often works in parallel applications is to divide the job into more tasks than we have workers. With 63 tasks, the execution time increases rather than decreases. Figure 7 shows that although the range of execution times is smaller than for 23 tasks (72 to 221 seconds vs. 144 to 354 for 23 tasks), new tasks are not immediately picked up by MiG workers, so much of the potential load balancing improvement is wasted in queue overheads.
270
J.M. Bjørndalen et al. / Interactive Computing with the Minimum Intrusion Grid (MiG)
Timeline for 63 tasks task060 task055 task050 task045 task040
receive queue overhead queue exectime
task035 task030 task025 task020 task015 task010 task005 task000 0
200
400
600
800
1000
Seconds from start
Figure 7. Timeline for 63 tasks. There are more tasks than workers, but we fail to benefit from a potentially better load balancing, in part because the workers do not pick up new jobs immediately.
5.3 MiG “Null Call” To examine the internal overhead in the job management system, we measured a simple job that only executed the unix “date” command. The execution time of this operation is recorded to be 40 seconds, while the queuing time was 1 second and the queue time was 0 seconds. 6. Discussion Using remote resources for rendering introduces two main overheads that need to be coped with: the time it takes to submit the rendering job to the remote server, and the time it takes to retrieve the results back to the node that requested the rendering. Task submission overhead did not significantly impact our jobs, but for jobs with a higher number of tasks or shorter tasks, the overhead should be reduced. One of the ways this can be improved is by introducing a “multi-task” job, which allows the user to submit multiple MiG jobs using a single job submission request. The result retrieval, in this case retrieving image fragments, is not a significant problem in the experiments we have run. The main reason for this is that the tasks do not finish at the same time. For the 23-task job, the first task is finished after 145 seconds, while the last task finishes after 641 seconds (shown as, respectively, the lowermost and topmost tasks in Figure 6), which allows nearly all of the fragments to be downloaded before the last task finishes. Figure 6 provides an explanation for the large difference in the task completion time. The first problem is seen in the upper left section of the figure, where the worker nodes are idle for a long time before the tasks start executing. Task submission overhead contributes to this, but the main reason for the idle time is that tasks spend a long time in the queue
J.M. Bjørndalen et al. / Interactive Computing with the Minimum Intrusion Grid (MiG)
271
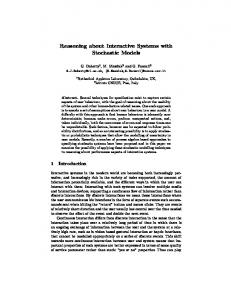
before a worker host picks them up. MiG workers pick up tasks by polling the server with a configurable number of seconds between each attempt. Reducing the polling period would reduce the idle time somewhat, at the cost of increasing the load of the server. Alternatively, a signalling mechanism would be useful, where a worker could keep up a connection to a local MiG server and wait for “task ready” signals. A signalling mechanism would also be useful for clients – our client code has to poll the server to determine when tasks have completed, and when files are ready to be retrieved. At the lower left side of Figure 6, we see the result of the load imbalance problem. This problem can be solved by a better partitioning of the image. To do this, we need to know where the computationally intensive parts of the image are. This, however, depends on the rendered image, and is not trivially known before attempting to render the image. To give an idea of the computational task at hand, Figure 8 shows a photograph of the final picture on the display wall.
Figure 8. The completed image. For size comparisons, note that the portable computer on the table is a 17inch notebook and that the display wall is about 3 meters from the table.
7. Related Work Grid Computing has been hyped for a number of years [8]. The most common Grid project is Globus [9] which has changed a lot since its beginning and is now moving towards a simple Web-service model. A fork from Globus revision 2 is NorduGrid ARC which sticks more closely to the original Grid computing model [10]. The only Grid to include PRC, except MiG, is Condor [11] which is an advanced model that includes dynamic process migration.
272
J.M. Bjørndalen et al. / Interactive Computing with the Minimum Intrusion Grid (MiG)
In [12], an approach to using a Grid to support interactive visualization based on the Grid Visualization Kernel (GVK) is described. Two models for using a Grid for interactive visualization are identified: (i)
local visualization: compute the results on the Grid, download the results, and compute the visualizations locally;
(ii) remote visualization: compute the results and the visualization on the Grid, download the finished visualization. gSlick [13] is a Grid-enabled collaborative scientific visualization environment based on the Globus toolkit (GTK). While GVK and gSlick are built on top of or as extensions to existing Grid models, MiG is a Grid. We have not built any environments specifically for visualization, but are using MiG directly to move data and tasks to the compute resources, and fetch the results afterwards. Thereby, we can provide performance data for the MiG grid model without extra overhead. It also demonstrates the flexibility of the MiG approach. Large format digital displays have traditionally been used for high-end applications in science and engineering. Examples include CAVE [14], InfinityWall[15], Princeton’s scalable display wall [16], the MIT DataWall, Stanford’s Interactive Mural [17], and the PowerWall at the University of Minnesota. 8. Conclusions In this paper we have introduced the problem of using a Grid for capability computing, and run an example of rendering a large image for experiments. The overall conclusion is that while performance improvements can be obtained using the Grid computing model there are still a number of features that need to be added or improved to represent a true alternative for capacity-computing. First of all a more convenient interface for retrieving results as soon as they are ready must be implemented. Secondly a strong prioritization mechanism must be implemented to ensure that deadline-driven applications are scheduled before capacity-driven applications. Finally it is evident that better tools for monitoring timing and performance of an application are needed to perform the kinds of experiments that we execute in this paper. 9. Future Work Follow-up on this work will be twofold: first we will add prioritization to MiG and introduce a simpler interface for having results delivered when ready. Once these improvements have been implemented we will rerun the experiments to verify their efficiency. Secondly, we will look into supporting capability computing that requires intercommunication. Since no existing Grid software support intercommunication, except a special Globus version of MPI, we will seek to introduce different intercommunication mechanisms and test capability computing on Grid with true intercommunication support.
J.M. Bjørndalen et al. / Interactive Computing with the Minimum Intrusion Grid (MiG)
273
References [1]
A. Natrajan, M. Humphrey, A. Grimshaw, Capacity and Capability Computing using Legion, ICCS 2001 May 28-30, LNCS 2073, p. 273, 2001.
[2] [3] [4]
http://www.irs.inms.nrc.ca/inms/irs/EGSnrc/EGSnrc.html http://boinc.berkeley.edu/
[5] [6] [7] [8] [9] [10] [11] [12] [13] [14] [15] [16] [17]
T. Richardson, Q. Stafford-Fraser, K.R. Wood and A. Hopper, Virtual Network Computing, IEEE Internet Computing, Vol.2 No.1 pp. 33-38, Jan/Feb 1998. B. Vinter, The Architecture of the Minimum Intrusion Grid, Proceedings of CPA 2005, pp. 189-201, IOS Press. September, 2005. www.povray.org http://www.rocksclusters.org/
M. Bernhardt, Grid Computing – Hype or Tripe?, GRID Today, December 6, 2004: vol. 3 no. 49. I. Foster and C. Kesselman, Globus: A Metacomputing Infrastructure Toolkit. Intl J. Supercomputer Applications, 11(2):115-128, 1997. O. Smirnova et al., The NorduGrid Architecture and Middleware for Scientific Applications, ICCS 2003, LNCS 2657, p. 264. P.M.A. Sloot et al. (Eds.) Springer-Verlag Berlin Heidelberg 2003. D. Thain, T. Tannenbaum, and M. Livny, Condor and the Grid, in Fran Berman, Anthony J.G. Hey, Geoffrey Fox, editors, Grid Computing: Making The Global Infrastructure a Reality, John Wiley, 2003. ISBN: 0-470-85319-0. D. Kranzlmüller, H. Rosmanith, P. Heinzlreiter, M. Polak, Interactive Virtual Reality on the Grid, in Proceedings of the Eighth IEEE International Symposium on Distributed Simulation and Real-Time Applications (DS-RT’04), pp. 152-158, October 2004 E.C. Wyatt, P. O’Leary, Interactive Poster: Grid-Enabled Collaborative Scientific Visualization Environment, in IEEE Visualization Proceedings of the Conference on Visualization, 2004 C. Cruz-Neira, D. J. Sandin , and T. A DeFanti. (1993). Surround-screen projection-based virtual reality: the design and implementation of the CAVE™. In Proceedings of Computer Graphics, Anaheim, CA, USA, (pp. 135-142). New York, NY, USA: ACM. M. Czernuszenko, D. Pape, D. Sandin, T. DeFanti, L. Dawe, and M. Brown. The ImmersaDesk and InfinityWall Projection-Based Virtual Reality Displays. In Computer Graphics, May 1997. R. Samanta, J. Zheng, T. Funkhouser, Kai Li, and Jaswinder Pal Singh. Load Balancing for MultiProjector Rendering Systems. SIGGRAPH/Eurographics Workshop on Graphics Hardware, Los Angeles, California – August 1999. G. Humphreys and P. Hanrahan, A Distributed Graphics System for Large Tiled Displays, Proceedings of IEEE Visualization ’99. and Graphics Arts III, 1998, pp 292-301.