Interactive Feature Specification for Simulation Data on Time-Varying Grids Helmut Doleisch1 Michael Mayer1 Martin Gasser1 Peter Priesching2 Helwig Hauser1 1
VRVis Research Center, Vienna, Austria∗ 2 AVL List GmbH, Graz, Austria†
Abstract SimVis is an interactive research implementation of a visual analysis scheme which we developed for the feature-based assessment of flow simulation data. It is based on the concept of multiple, linked views of different kinds, including views from information visualization such as adapted scatterplots and histograms. In this paper we present an extension to our interactive visual analysis framework, which allows to handle data resulting from CFD simulations which are based on timevarying grids. For interactive and efficient handling of such large data sets, several optimizations had to be realized in the system. Furthermore, we demonstrate the application of our visualization approach in the context of an industry-level application, namely the visual analysis of CFD data from the simulation of combustion in a specific diesel engine. Here we especially focus on the description of how researchers and engineers use the SimVis approach to successfully investigate concrete user questions.
1
Introduction
Recently, we see a reemergence of research in the field of flow visualization. One reason for this is related to impressive advances in computational hardware performance. These advances now allow researchers and practitioners to address problems such as the interactive visualization of three-dimensional and unsteady flow. Consequently, flow visualization regains increased attraction in the context of real-world applications. One interesting and recently very active application field for interactive visualization of unsteady flow data is the analysis of data from computational fluid dynamics (CFD) simulations. CFD simulation plays a major role in many different fields, including the automotive industry. When visualizing large, three-dimensional, and time-dependent data from CFD simulation, often feature extraction is used in single time steps, together with feature tracking over time to account for the temporal evolution of features over time. In another paper we give a detailed overview about a lot of related techniques [18]. Besides (semi-)automatic feature extraction, also a few frameworks for interactive feature specification were presented lately. Henze developed a technique to visualize and analyze time-dependent CFD data by using multiple, linked 2D plots showing data distributions of the multi-dimensional data together with the connectivity information with respect to the underlying simulation grid ∗ email:{Doleisch,Mayer,Gasser,Hauser}@VRVis.at, † email:
[email protected],
http://www.VRVis.at/ http://www.avl.com/
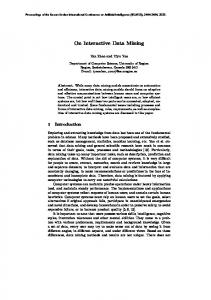
Figure 1: A sample SimVis scenario: simulated flow through a diesel particle filter (DPF) [8] is visualized – the flow is shown at the time of 35 secs. after simulation started. The user has reflected his interest in flow regions of heavy oxidation by interactively brushing data items which exhibit a lot of carbon-oxides in the scatterplot (lower left) and then refining this specification to only apply to hot regions (in the histogram, middle). The 3D view on the right shows a focus+context visualization of the DPF with the brushed data items highlighted in color (color shows velocity magnitudes). The upper left view provides a direct and numerical interface to the hierarchical brush definition.
in a framework called Linked Derived Spaces [15]. Gresh et al. presented a system called WEAVE [13], which combines methods from information visualization (InfoVis) and 3D scientific visualization (SciVis) to present multi-dimensional data from a heart analysis application. It allows to investigate data in its 3D context based on marking data items according to the distributions of different data attributes. In previous work [6, 5] we have developed a visualization framework for the interactive visual analysis of flow simulation data, called SimVis (see also section 2 for more details). We have shown that the combination of InfoVis and SciVis greatly supports the tasks of interactive exploration and analysis of large, multi-dimensional data sets in the field of the automotive industry. Recently the SimVis technology has been internationally awarded winning the first price at the IEEE Visualization Contest 2004 [22]. The application was an interactive analysis of a large, time-dependent data set resulting from simulating the hurricane Isabel (see also http://www.VRVis.at/SimVis/Isabel/ for more information). In this paper we present an extension to our interactive visual analysis framework, which allows to handle large amounts of data resulting from CFD simulations based on timevarying grids. Furthermore, we demonstrate the application of our visualization approach in the context of a real-world application, namely the visual analysis of CFD data from the simulation of combustion in a specific diesel engine.
2
Interactive Visual Analysis with SimVis
SimVis is a flexible framework for interactive visual analysis of large, multi-dimensional, and time-dependent data sets resulting from flow simulation (see also our previous
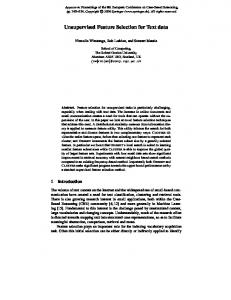
Figure 2: Combined 2D/3D scatterplot [17] used for specifying a feature represented by high values of the combustion reaction progress variable and non-zero mass fraction values of diesel vapor in the diesel engine application presented in section 5 of this paper.
works [6, 5, 8]). In SimVis multiple, rather well-known concepts from scientific visualization (SciVis) and information visualization (InfoVis) are combined to build a new featurebased visualization approach based on user-driven visual analysis. To achieve feature-based flow visualization for the purpose of data exploration and analysis, SimVis provides different kinds of InfoVis views (e.g., extended 2D/3D scatterplots [17], see also figure 2, time-dependent histograms, etc.) together with 3D SciVis views, as well as advanced interaction mechanisms to intuitively specify features in the flow data. Multiple, linked views (compare to Baldonado et al. [3]) of different kind are used to concurrently show different aspects of the flow data. In the visualization, the flow features are visually discriminated from the rest of the data in a focus+context (F+C) visualization style which is consistent in all linked views [14]. Figure 1 shows a typical multi-view setup for a visual analysis session with SimVis, data from a detailed case study about the design of a diesel exhaust system is analyzed [8]. For interactive feature specification, InfoVis views such as scatterplots, histograms, etc., are used in SimVis. The user chooses to visually represent selected data attributes within such a view – thereby gaining insight into selected relations within the data – and then
interactively brushes certain subsets of the data directly on screen (compare to linking and brushing works by Ward [23], Ahlberg [1], Buja et al. [4], Swayne et al. [20, 21], and others, and see scatterplot view of figure 1 for an example). The result of such a brushing operation is reintegrated within the data in the form of synthetic data attributes DOIi ∈ [0, 1], in the following called a degree of interest (DOI) attribution of the data (compare to Furnas [10]). The SimVis system offers interactive methods to specify features, for example through smooth brushing [6] (defining fractional DOI-values) as well as to logically combine brushes for the specification of complex features [5]. Brush attributes and their composition are explicitly represented in the system and can be interactively adjusted through a separate user interface (see left upper view in figure 1 for an example) as well as saved and reapplied to other data sets through the use of a feature definition language [5]. From collaboration with our industrial partners we know that interactive exploration and analysis of simulation data often follows one of three characteristic patterns. One type of exploration is to search for places in the 3D simulation where certain feature characteristics are present (feature localization). In the SimVis system the user can brush features in InfoVis views and concurrently localize the respective feature in the 4D (3D+time) flow domain. Additionally, users also investigate multi-dimensional data properties by specifying a feature in one InfoVis view and at the same time analyzing the DOI distribution with respect to other data attributes in additional InfoVis views. Furthermore, users often are interested in inspecting the values of selected data attributes with respect to certain spatial subsets of the flow domain. In the SimVis system the user can load spatial and temporal references of the data also into InfoVis views – brushing these kinds of data attributes yields features which are specified by their location in space and time. For feature-based flow visualization, SimVis provides 3D focus+context viewing of the flow data in the sense that flow features are visually emphasized in the 3D depiction through coloring and relatively high opacity [14]. For each 3D view one (fractional) DOI attribute DOIi is used to (smoothly) discriminate the visually enhanced focus from the rather transparent and grey-scale context (see right view in figure 1).
3
Handling CFD Data based on Time-Varying Grids
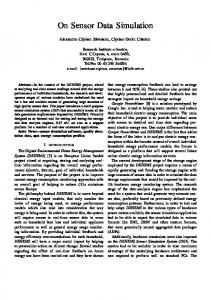
To allow for interactive visualization and analysis of simulation results from CFD simulation based on time varying grids, we had to extend the SimVis system to cope with time-varying grid geometries. In contrast to time-dependent simulation cases, where the computational grid is static, i.e., it stays the same for the entire time frame of the simulation, in many cases the underlying grid can also be time-varying, i.e., changing over time. Especially in the automotive industry, simulation often has to deal with moving parts, and accordingly the computational grids adapt their spatial layout over time. Figure 3 illustrates our concept of dealing with time-varying grid geometries. The data, that has to be dealt with, is divided in the temporal dimension into different topology zones by so-called rezone points. Rezone points consist of two key geometries at different resolutions and represent correspondence between zones of different grid topology. For each topology zone the topology of the underlying grid does not change, and linear interpolation is assumed for each grid position between two (topologically identical) grid layouts. Every
Rezone point
Key
Key
Topology zone
Rezone point
Key
Topology zone
Rezone point
Rezone point
Topology zone
Figure 3: Moving Meshes: Our concept for handling simulation data based on time-varying grids. topology zone consists of at least two key geometries, but can also include the definition of an arbitrary higher number of key geometries allowing piecewise linear interpolation of the different grid positions. When including data from time-varying grids into the SimVis system, the first challenge is to handle a different number of cells at different time steps. Especially in the 3D view, we not only have to deal with different numbers of cells but also with the fact, that cell positions change over time. Another challenge is that data set sizes of the grid geometries are generally a magnitude larger for data sets with time-varying geometry. In our case, not only the geometries at the rezone points are important, but rather cell positions for each available time step in the simulation result are needed to allow interactive viewing in 3D as well as loading spatial references into the InfoVis views. We interpolate cell positions for each time step during loading of the data, connectivity information can be retrieved from the rezone-point geometries.
4
Large Data Handling
As loading of such large data sets as mentioned above and handling them during visualization and interaction usually is not an easy task, optimized data access policies are very important. We currently visualize data sets with the SimVis system, which have about 100 time steps, 20–50 data attributes and 100,000 to 1,000,000 cells. File sizes of such data sets range from several hundred megabytes to a few gigabytes. The main extensions to the SimVis system for supporting an efficient handling of large data sets are outlined below. Further details are discussed in a separate technical report [12]. The first extension was to enable lazy loading (activating) of data. This is realized by following a Virtual Proxy pattern [11] for the implementation of the data attribute classes. Due to the fact that it is very expensive in terms of system resources to leave all data attributes activated, a caching algorithm based on a LRU (least recently used) queue has been implemented. Besides the memory management optimizations, performance optimizations have also been included in SimVis. The first version of the software was strictly single-threaded, resulting in a blocking behavior in certain cases as 90% of the computing time was spent in the calculation of DOI values and mouse interaction continuously triggered a recomputation of the DOI values. Our solution to maintain an interactive response of the user interface elements
Figure 4: Comparison of SSE and HT optimization for the DOI calculation. (without blocking), and thus to enable interactive changes of feature specifications, was to decouple the DOI computation from the user interface by using two threads. The DOI computation thread notifies the registered views after finishing the computation to update the viewing information accordingly. DOI computation time is additionally reduced by only recalculating parts of the DOI hierarchy, which are affected by recent user interactions. To further speed up computationally intensive processes, we also investigated two hardware-dependent features: Intel processors from the Pentium III upwards support a SIMD (Single Instruction, Multiple Data) instruction set (Streaming SIMD Extensions, SSE [19]), which allows performing calculations on four 32 bit float values simultaneously. It is possible to optimize the calculation of the DOI function based on this extension, since it packs 4 operations into one. On the other hand, the Pentium IV also supports hyperthreading technology (HT) [16] which offers thread-level parallelism, enabling multithreaded applications to make better use of CPU resources as compared to single-threaded applications. We tested both solutions for their suitability in the special case of calculating combinations of data coming from different large float arrays (as it is the case for the performance-critical parts of the DOI calculation). As a benchmark we used the following case: the minimum T-norm (logical AND) of arbitrary DOI values from two arrays with 50,000 entries each is calculated (similar to the combination of brushes in SimVis [5]). Figure 4 gives averaged results for multiple tests with the different setups (with and without SSE, with and without hyperthreading). Using (only) the SSE instruction set gives the maximum speed-up for our case. When adding hyperthreading (by using different threads for calculating parts of the combinations, for example), no further speed-up can be achieved. Compared to using only SSE extensions, the increased cache miss numbers due to using different threads even slow down computations significantly in most cases. We therefore optimized the calculation of the DOI function based on the SSE extensions. The reason for the near-optimal benchmark results for SSE (see figure 4) is presumably the linear layout of the data that fully exploits cache coherency and thus drives the CPU at full load. The visual analysis of the application presented below was carried out on a system consisting of the following components: a standard PC (Intel Pentium4, 2.8GHz, 2GB RAM, 2x 40GB HD, RAID 0 (Striped Set)) with a NVidia GeForceFX 5900 graphics card. The two data sets investigated during the analysis of this case are based on time-varying grids, each consisting of approximately 30,000 to 50,000 cells per time step with 44 attributes per cell. The temporal dimension in the cases described here is provided in terms of crank angles. Data for 92 different crank angles out of the whole time domain (180 to 540 deg CA, resembling to one half cycle of a four stroke diesel engine) was investigated
Figure 5: Visual analysis of the diesel engine FM538: geometrical layout (1) and underlying grid layout for the simulation of one time step (2); scatterplots showing the amounts of diesel vapor over time (3) and polar coordinates vs. time (4); amount of diesel vapor displayed on a sectional slice in focus in a linked 3D view (5).
during the analysis process. With these settings, loading all available time steps into a combined 2D/3D scatterplot (see figure 2), for example, requires handling and displaying of approximately 14.5 million points. It has to be mentioned, that due to the algorithmic optimizations discussed above, we are able to handle analysis sessions with multiple views for data sets even a magnitude larger than the ones presented here, while still providing full interactivity.
5
Results from the Visual Analysis of a Diesel Engine
To evaluate our extensions to the SimVis system with respect to large data handling and handling of simulation data based on time-varying grids, we investigated data coming from an industry-level application, namely the simulation of combustion processes in a diesel engine called FM538. We first briefly describe this diesel engine and afterwards discuss the investigation of one concrete question of engineers who work on the development of diesel engines at our industrial partner AVL List GmbH [2]. A more detailed discussion of this question as well as other important questions and results from a case study of interactive visual analysis of this application can be found in a longer technical report [7]. For retrieving this technical report, as well as for larger versions of the images as presented here, and for additional animation sequences, please refer to http://www.VRVis.at/vis/research/diesel-engine/.
5.1
Diesel Engine FM538
The FM538 is a single-cylinder diesel engine which is used by our industrial partner for research and development purposes (see figure 5(1)). The dimensions of the FM538 are that of a heavy duty engine as it is used in a truck. Figure 5(1) illustrates the geometrical layout of the diesel engine. The blue area represents
the calculation volume for the simulation. The injector (i) with eight nozzles lies aligned with the cylinder axis and the shape of the cylinder head is assumed flat. The geometry of the intake valve (v) leads to the generation of a strong swirl flow (flow around the cylinder axis) which consequently leads to a proper mixing of fuel and air as necessary for an effective combustion process. For simplifying the simulation (and the underlying grid geometry), the generation of swirl flow through the intake valves is replaced by the assumption of a solid body swirl as an initialization of the simulation at the moment of the intake valve closing. For the simulation rotational symmetry is exploited and only one of the eight injection nozzles is taken into account. The computational mesh therefore only covers a 45 degree cake of the combustion chamber. As the geometry of the cylinder head is assumed flat (the valve pockets in the piston are neglected), a compensation volume (c) is placed at the cylinder outside (see figure 5(2)). This is necessary to conserve the correct compression ratio in the combustion chamber, given by the volume at the Top Dead Center (TDC, time step of upmost position of the piston) divided by the volume at the Bottom Dead Center (BDC) of the moving piston. Another very important factor for the performance of the engine is the shape of the piston bowl (b). It is especially designed to conserve (or even increase) the swirl flow in the combustion chamber. A proper swirl flow behavior is needed for a proper mixture formation during the fuel injection, which here starts at 360 deg CA (TDC) and ends at 396.5 deg CA. Due to the high pressure and high temperature level in the combustion chamber at TDC the fuel mixture ignites and combustion starts usually at about 1-2 deg CA after the injection starts. During combustion pollutants (NOx ) and soot are generated. In the following, we analyze results of the simulation of this diesel engine from 360 to 540 deg CA (from the start of the diesel injection). We discuss the investigation of results from two different simulations of the same diesel engine for comparing different layouts. The two cases only differ with respect to the injection systems. The fuel spray at the nozzle outlet is cone-shaped. The experimentally determined cone angle depends on the geometry of the nozzle, the pressure of the fuel in the nozzle, and the pressure in the combustion chamber. For the injection system of the first case the opening angle of the cone is 20 degrees, for the second case the cone angle of the spray is only 10 degrees. The two simulation data sets corresponding to the two cases as described above each consist of six different topology zones. Three zones are representing the compression stroke (180 to 360 deg CA) (discussed in our longer technical report [7]), and three are used for the power stroke (360 to 540 deg CA). Through linear interpolation, the grid of the combustion chamber is stretched during the power stroke and has to be refined from time to time, to keep a useful grid geometry for the simulation. The simulation results of the here presented application have all been simulated using FIRE [9], AVL’s CFD software for combustion processes. In addition to regular flow attributes, like velocity, pressure, temperature, etc., in this diesel engine application also a spray module, which is modeling the fuel injection, and a combustion module are used. The combustion is simulated by oxidizing the fuel to carbon dioxide and water vapor. Additionally the generation of NOx and soot is calculated. With these modules the following additional data attributes are available as a result from the simulation process: Liquid den-
Figure 6: Investigating the processes of fuel injection and fuel–air mixture formation: Diesel vapour mass fraction values are mapped to color for regions exhibiting higher values of TKE and velocity. Comparison of results from case 1 (upper row) and case 2 (lower row) at 364, 368, and 372 deg CA.
sity and mass of spray, the combustion reaction progress variable, the mass fractions of CO, CO2 , diesel, H2 O, H2 , N2 , O2 , NOx and soot. The combustion reaction progress variable is a measure for the progress of the combustion process, defining how much fuel has already been burnt. If it reaches its maximum value of 1, all fuel ideally has been burnt. During real-world testing of diesel engines only some questions can be answered, like what is the overall pressure in the combustion chamber or how much soot is in the exhaust gas. Usually it is hard to analyze why something is happening. CFD simulation can help to gain more insight into the physical and chemical processes inside the combustion chamber. In the following we provide results from interactive visual analysis of the combustion progress in the diesel engine. Important questions during the analysis of the combustion phase include: Where are the regions, where fuel combustion remains incomplete and what are the reasons for this incomplete burning? How much soot is caused by the combustion process for a special setup, and what factors influence the amount of soot?
Figure 7: Mass fraction values of O2 for regions with high values of the combustion reaction progress variable and non-zero mass fraction values of diesel vapor. Data from case 1 (upper row) and case 2 (lower row) is compared for 396, 408, 418, and 540 deg CA.
5.2 Analysis of the Combustion Progress After a considerable amount of liquid fuel has evaporated (see figure 6 for results of investigating the processes of fuel injection and fuel–air mixture formation in a previous analysis step [7]), auto-ignition occurs which initializes the combustion process. It is also important to consider that the processes of mixture formation and combustion are running simultaneously (at least to a certain extent of time), and thus influence each other. At first we explore, how the fuel combustion progresses, and if there are regions, where not all fuel is burnt. In an extended 2D/3D scatterplot view we plot crank angle values (Xaxis) vs. mass fraction values of diesel vapor (Y-axis) vs. the combustion reaction progress variable (Z-axis) of data from case 1. The 3D scatterplot, together with the respective 2D views for all axis combinations, is shown in figure 2. It can be seen (e.g., from the lower left 2D scatterplot), that at the end of the simulation of case 1 (540 deg CA) not all fuel has been burnt completely. The same holds for the second case, if inspected in a similar view. For the analysis of where and why unburnt fuel remains at the end of the simulation, we interactively brush all data items having a mass fraction of diesel vapor above zero together with high values of the combustion reaction progress variable (see figure 2). This highlights all those regions where the combustion is almost finished. Figure 7 shows these regions in a F+C style of visualization for both simulation cases (top: case 1, bottom: case 2). Mass fraction values of O2 are used for coloring the focussed regions. In the visualization of the first shown time step (at 396 deg CA) both cases show a concentration of diesel vapor together with progressed combustion in the bowl of the chamber. The reason why the diesel vapor can not burn completely is that there is almost no oxygen in this region (visible through coloring the focus with respect to mass fraction values of O2 ). The result is an incomplete combustion of diesel vapor in the bowl for both cases. By comparing the results for the two cases, we notice, that for case 2 there is more unburned fuel in the bowl than for case 1, especially also at the end of the simulation. To analyze this fact, we investigate the differences in the flow behavior for both cases in the following step. To do so, we want to analyze the flow behavior by using sectional slicing of the spatial
Figure 8: Left: Comparing the flow behavior for both cases at 384 deg CA. The amount of diesel vapor is visualized for the sectional slice as defined by the brushing action shown in figure 5. Right: Soot formation at 368 and 386 deg CA: soot generation (red), soot burning (green) and constant levels of soot (yellow) are shown for areas of high soot concentration.
layout in a 3D view. We take advantage of the possibility to calculate polar coordinates via attribute derivation from the spatial references in our system. For the diesel engine application we are interested in polar coordinates around the z-axis (aligned with the movingaction of the piston). In figure 5(4) we show a scatterplot where crank angels (horizontal axis) vs. polar coordinates around the z-axis (vertical axis) are plotted. By interactively brushing a horizontal sub-section in this plot, we can focus on a specific spatial section in the data set. In a linked 3D view (figure 5(5)) we see the interactively brushed sectional plane in the data. For coloring mass fraction values of diesel vapor are used for data items on this plane. In a second scatterplot (figure 5(3)) the distribution of the amount of diesel vapor over time is shown. When reducing the context in the 3D view, and using arrow glyphs for showing the flow direction and velocities, we can get a very good impression of the flow behavior in one sectional slice of the data. Figure 8, left, shows a comparison of the flow field at 384 deg CA for both cases (top: case 1, bottom: case 2). Again, the focus is colored with respect to the amount of diesel vapor. A fast inspection of different sectional slices is intuitively realized by interactively brushing different subsets of polar coordinates in the linked scatterplot view. In figure 8, left, we see, that in the second case the diesel vapor has a deeper penetration in the direction of the bowl than in the first case. Differences in the flow patterns for the two cases are visible as follows: For case 1 the main flow carries the diesel vapor up in the direction towards the chamber head. In case 2 the main flow direction in this region is horizontal (due to higher velocity and TKE values). As a result, diesel vapor
is carried to the vertical piston wall where parts of it are re-directed into the bowl. Because of lower circulation in the bowl during the power stroke, there is almost no mixing between diesel vapor and oxygen. This leads to incomplete diesel combustion. From this point of view, case 1 is preferred. Another important issue during the analysis of the combustion process is the production of soot. For quickly investigating this question, we brush high values of soot mass fraction. When visualizing values of the soot formation rate in areas with a high amount of soot, the formation of soot can be observed (see figure 8, right). A positive soot formation rate denotes production of soot, a negative value means that soot is burnt. Through user-defined control over the scaling for the coloring, we can achieve that generation and dissipation of soot can be shown clearly in 3D. In figure 8 , right, regions in red show places, where soot is produced, green regions are areas where soot is burnt. When comparing the two cases, we see that in the first case more soot is produced at 368 deg CA (left images) than in the second case. This is due to the liquid spray reaching the piston surface [7]. At 386 deg CA (right images) more soot is generated in case 2. The reason is, that in case 2 the diesel vapor reaches the vertical piston wall (see also figure 8, left side), where a relatively low temperature of the wall leads to higher soot formation due to reduced soot burning.
6
Comparison and Conclusions
In this paper we demonstrate the interactive focus+context visualization of time-dependent flow data as effective support for the exploration and analysis of results from computational flow simulation (in our case the combustion of a diesel engine). Multiple, linked views from information visualization and scientific visualization are used to investigate the multidimensional and time-dependent attribute space of the flow simulation data. SimVis offers new methods which extend standard visualization capabilities of common industrial visualization tools. It allows to get a quick overview over the three-dimensional flow patterns and relations in the spatial domain through linking 3D SciVis views to InfoVis views. In the InfoVis views interactive analysis through brushing (with immediate feedback in the 3D view) and working on multiple dimensions simultaneously, is possible, improving and speeding up the analysis process compared to common visualization software tools. Additionally, working with SimVis allows to define synthetic data attributes through attribute derivation based on existing data attributes (e.g. normalizing data, using different coordinates for spatial brushing, etc.) and to display combinations of several quantities simultaneously in different InfoVis and SciVis views, which is usually not possible with common visualization tools for CFD data. Finally, the intuitive formulation of features in terms of a feature definition language proves to be very useful, especially when it comes to comparing different data sets side by side, as porting of feature specifications from one data set to another can be applied.
Acknowledgements Parts of this work have been carried out at the VRVis Research Center in Vienna, Austria (http://www.VRVis.at/vis/) which is partly funded by an Austrian research program called Kplus. All CFD simulation data presented in this paper is courtesy of AVL List GmbH, Graz, Austria.
References [1] C. Ahlberg. Spotfire: an information exploration environment. SIGMOD Record (ACM Special Interest Group on Management of Data), 25(4):25–29, 1996. [2] AVL List GmbH. See URL: http://www.avl.com/. [3] M. Baldonado, A. Woodruff, and A. Kuchinsky. Guidelines for using multiple views in information visualization. In Proceedings of the Working Conference on Advanced Visual Interfaces, pages 110–119, 2000. [4] A. Buja, J. McDonald, J. Michalak, and W. Stuetzle. Interactive data visualization using focusing and linking. In Proceedings IEEE Visualization ’91, pages 156–163, 1991. [5] H. Doleisch, M. Gasser, and H. Hauser. Interactive feature specification for focus+context visualization of complex simulation data. In Proc. of the 5th Joint IEEE TCVG - EUROGRAPHICS Symposium on Visualization (VisSym 2003), pages 239–248. Springer-Verlag, 2003. [6] H. Doleisch and H. Hauser. Smooth Brushing for Focus+Context Visualization of Simulation Data in 3D. In Journal of WSCG, volume 10, pages 147–154, Plzen, 2002. [7] H. Doleisch, M. Mayer, M. Gasser, P. Priesching, and H. Hauser. Interactive feature specification for the visual analysis of a diesel engine. Technical Report TR-VRVis-2004-011, VRVis Research Center, 2004. [8] H. Doleisch, M. Mayer, M. Gasser, R. Wanker, and H. Hauser. Case Study: Visual Analysis of Complex, Time-Dependent Simulation Results of a Diesel Exhaust System. In Proc. of the 6th Joint IEEE TCVG - EUROGRAPHICS Symposium on Visualization (VisSym 2004), pages 91–96. Springer-Verlag, 2004. [9] Webpage about FIRE at AVL. See URL: http://www.avl.com/fire. [10] G. Furnas. Generalized fisheye views. In Proc. of the ACM CHI ’86 Conf. on Human Factors in Computing Systems, pages 16–23, 1986. [11] E. Gamma, R. Helm, R. Johnson, and J. Vlissides. Design Patterns: Elements of Reusable Object-Oriented Software. Addison-Wesley, 1995. [12] M. Gasser. Fast focus+context visualization of large scientific data. Technical Report TRVRVis-2004-005, VRVis Research Center, 2004. [13] D. Gresh, B. Rogowitz, R. Winslow, D. Scollan, and C. Yung. WEAVE: A system for visually linking 3-D and statistical visualizations, applied to cardiac simulation and measurement data. In Proceedings IEEE Visualization 2000, pages 489–492, 2000. [14] H. Hauser. Generalizing focus+context visualization. In Dagstuhl Seminar 03231: Scientific Visualization: Extracting Information and Knowledge from Scientific Data Sets, also available as VRVis Technical Report TR-VRVis-2003-037, 2003. [15] C. Henze. Feature detection in linked derived spaces. In Proceedings IEEE Visualization ’98, pages 87–94, 1998. [16] Hyper-Threading Technology Architecture and Microarchitecture. See URL: http: //www.intel.com/technology/itj/2002/volume06issue01/vol6iss1_ hyper_threading_technology.pdf. [17] H. Piringer, R. Kosara, and H. Hauser. Interactive focus+context visualization with linked 2D/3D scatterplots. In Proc. of the Intl. Conference on Coordinated & Multiple Views in Exploratory Visualization (CMV 2004), pages 49–60, 2004.
[18] F. Post, B. Vrolijk, H. Hauser, R. Laramee, and H. Doleisch. The state of the art in flow visualization: Feature extraction and tracking. Computer Graphics Forum, 22(2):775–792, 2003. [19] Intel Streaming SIMD Extensions. See URL: http://x86.ddj.com/articles/sse_ pt1/simd1.htm. [20] D. Swayne, D. Cook, and A. Buja. XGobi: interactive dynamic graphics in the X window system with a link to S. In Proceedings of the ASA Section on Statistical Graphics, pages 1–8. American Statistical Association, 1991. [21] D. Swayne, D. Cook, and A. Buja. XGobi: Interactive dynamic data visualization in the X window system. Journal of Computational and Graphical Statistics, 7(1), 1998. [22] Webpage about the IEEE Visualization Contest 2004. See URL: http://vis.computer. org/vis2004contest/. [23] M. Ward. XmdvTool: Integrating multiple methods for visualizing multivariate data. In Proceedings IEEE Visualization ’94, pages 326–336, 1994.