Author manuscript, published in "AVI - International Working Conference on Advanced Visual Interfaces (2012) 522-529" DOI : 10.1145/2254556.2254654
Interactive graph matching and visual comparison of graphs and clustered graphs Mountaz Hascoët
Pierre Dragicevic
LIRMM, CNRS UMR 5506, Univ. Montpellier II,
INRIA, Univ. Paris-Sud,
161, rue Ada 34392 Montpellier Cedex, France 2
Bât 650, 91405 Orsay Cedex, France
[email protected]
[email protected]
hal-00694422, version 1 - 4 May 2012
ABSTRACT We introduce interactive graph matching, a process that conciliates visualization, interaction and optimization approaches to address the graph matching and graph comparison problems as a whole. Interactive graph matching is based on a multi-layered interaction model and on a visual reification of graph matching functions. We present three case studies and a system named Donatien to demonstrate the interactive graph matching approach. The three case studies involve different datasets: a) subgraphs of a lexical network, b) graph of keywords extracted from the InfoVis contest benchmark, and c) clustered graphs computed from different clustering algorithms for comparison purposes.
Categories and Subject Descriptors H.5.2 [Information interfaces and Interfaces. - Graphical user interfaces.
presentation]:
User
Keywords Visual Analysis, Graph Matching, Multi-Layer Comparison, Deterministic Layout of Graph.
1. INTRODUCTION Graph comparison is a challenging task with impacts on a wide range of domains including software engineering, chemistry and biology. Respectively, it involves for the comparison of data structures and the comparison of complex systems. Graph comparison is usually subdivided into two subproblems: graph matching and graph comparison. The problem of graph matching is to find the "ideal" mappings between nodes from different graphs, since testing for equality of single node attributes is often not enough. The problem of graph comparison is to present collections of matched graphs to end users in a way that allows for easy comparison. Although in most real world situations graph matching and graph comparison are two intertwined problems, most systems treat them separately: graph matching is typically treated algorithmically while the comparison of matched graphs is usually handled visually. As a consequence, graph matching systems have sophisticated algorithms but no or poor GUI support despite the fact that the user’s expertise is ultimately needed to validate,
Permission to make digital or hard copies of all or part of this work for personal or classroom use is granted without fee provided that copies are not made or distributed for profit or commercial advantage and that copies bear this notice and the full citation on the first page. To copy otherwise, to republish, to post on servers or to redistribute to lists, requires prior specific permission and/or a fee. AVI ‘12, May 21-25, 2012, Capri Island, Italy Copyright © 2012 ACM 978-1-4503-1287-5/12/05... $10.00
guide or tune the matching process. Conversely, when using a visual graph comparison interface users might see matching mistakes and might need to re-run matching algorithms. However, most visual graph comparison systems either poorly support or not support these tasks. For example, in [3] graph matching similarity matrix is taken as an input to the visualization without any support to interact with this matrix nor with the associated matching process.
2. RELATED WORK Graph theorists have been interested in automatically matching graphs based on their structure alone [12], an instance of this problem being the graph isomorphism problem, known as computationally challenging [21]. Matching techniques that incorporate semantic information have been studied in domains such as knowledge engineering [18] and databases [35]. A range of visual graph comparison techniques have been proposed by the information visualization community, and can be categorized under three main approaches: (a) side-by-side views [30][23][3], (b) superimposed or merged views [15][1] and (c) animations [37][13]. These approaches are often complemented with techniques for highlighting the matches or differences between the graphs. Techniques for highlighting the matches include visual links [11][23], color coding [30][16][27] and brushing and linking [23]. A domain closely related to graph comparison is the visualization of time-varying graphs, for which similar techniques have been devised [8][10][15]. In addition, the graph drawing community has focused on providing stable layout algorithms to allow for animation [13]. There has been little research on how to integrate graph matching and visual comparison tasks, except in the field of ontology alignment [27][22] where integrated systems have been proposed but are typically limited to manual node adjustment. Our approach contrasts with existing work in two ways: first, graph comparison and graph matching are integrated into a single coherent interaction model, and second, this interaction model is based on a multi-layer approach that generalizes the classic visual techniques (a), (b) and (c) mentioned above. Layers [19] are a construct commonly used in multimedia authoring software and are therefore familiar to many computer users. Layers can be seen as a particular case of visual planes, a concept introduced by Collins and Carpendale [11] for comparing visualizations. But in contrast with the use cases explored by Collins and Carpendale, our layers are simple 2-D visual planes that are stacked and translucent.
hal-00694422, version 1 - 4 May 2012
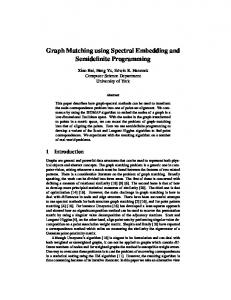
Figure 1: Multi-layer comparison of research paper topics from years prior to 1994 of the Infovis Benchmark. For the purpose of comparing graphs, 2-D stacking has the advantage of preserving the user’s mental map of related visualizations. Animations have the same advantage [16], but unlike animations, our multi-layer approach also makes it possible for users to see several related visualizations at the same time and tune them separately. As we further show in this paper, another advantage of using layers for comparing graphs is that they provide basic support for the three basic types of visual comparison approaches used in the domain, i.e., (a) side-by-side, (b) merged and (c) animated. Although some systems support more than one technique, they rarely attempt to unify them within a single coherent visualization and interaction paradigm. Exceptions are systems that let users rotate 3-D stacked views to support both side-by-side and superimposed comparisons [15][9][16] and systems like Gevol that unify merged views and animation by displaying the union graph and having node colors change over time [10]. Brandes et al.’s system combines (a), (b) and (c) by drawing graphs on 3D layers whose opacity can vary to show graph evolution in a way similar to the Flash “onion-peel” effect [8]. But layers are only used as a visualization metaphor and the system does not exploit the full potential of layers in terms of interaction, as layers cannot be manipulated and tuned individually. Supporting interaction is
likely to be more difficult with 3-D layers than with 2-D ones [36], which further motivates the use of a 2-D layer approach.
3. A MULTI-LAYER INTERACTION MODEL Multi-layer interaction model builds on layers interaction models commonly found in graphical authoring applications: layers act as semi-transparent sheets that are stacked on top of each other. Each layer has a title bar that can serve to make it visible or invisible, and title bars can be reordered to modify the display order of layers. Layers can also be panned, individually or together. Since layers aimed at graph comparison and graph matching, we also introduce specificities that distinguish our layers from traditional layer models: each layer contains a graph (or subgraph) as well as its rendering properties: a graph layout, an animation and geometrical transformations. The core of multiple layer interaction model is to support reconfigure and explore interaction techniques essential for information visualization tasks [41]. An originality of our approach is to support these techniques both at the layer level and a the multi-layer level.
3.1 RECONFIGURE
hal-00694422, version 1 - 4 May 2012
"Reconfigure interaction techniques provide users with different perspectives onto the data set by changing the spatial arrangement of representations" [39]. Our approach to reconfiguration is to provide a variety of possible layouts and crossing-based interaction [42] through layer title bars to fluidly change and combine layouts over one or several layers simultaneously. Three different types of layout are supported: optimization-based layouts, deterministic layouts and transformation-based layouts. Optimization-based layouts are based on the optimization of visual criteria, an approach that captures the majority of general graph layout algorithms published over the past decades. Our system supports common algorithms through the JUNG [24] and LinLog [33] libraries. These algorithms provide excellent results as far as the optimized criteria are concerned and produce drawings that usually have good legibility properties. However, one important drawback with these algorithms is their nondeterminism: in most cases, applying the same algorithm to the same graph twice will result in two very different drawings. Although non-determinism is not an issue in most application scenarios, it becomes seriously problematic in the context of visual graph comparison and visual graph matching. We introduce deterministic layout as a complementary approach to optimization-based layout. Deterministic layouts are meant to facilitate graph comparison and matching by guaranteeing that two isomorphic graphs will always be laid out the same way (although two non-isomorphic graphs can end up with the same layout). Deterministic layouts are built from node signatures. We define a node signature as a list of node properties that is preserved after node reordering. It can be structural (e.g., the number of neighbors called the node degree), semantic (i.e., based on node attributes like label), or a combination of both. Node signatures that are purely structural are equivalent to the concept of node invariant from graph theory [21]. Numerical node signatures define coordinate systems for deterministic layouts. One simple example is a layout that positions nodes such that their x-coordinate is a function of their degree and their ycoordinate is a function of their clustering coefficient (i.e., the density of edges in their neighborhood). Deterministic layouts can also be built based on semantic numerical node signatures, such as linear combinations of numerical node attributes or ordered hash functions of string attributes. Deterministic layouts offer several potential benefits. First of all, in contrast with optimization-based layouts where only inter-node distances are meaningful, the mapping of node coordinates to node signatures can give users richer overviews of semantic and structural graph properties and better support for visual search following the analogy of dynamic filtering [1]. The idea of treating a graph like a scatterplot has also been successfully used for the purpose of data exploration [16]. However, without layers and with only few types of mappings between node attributes and the x and y axes, previous systems cannot handle graph comparison. Another benefit of deterministic layouts for the specific purpose of graph matching and comparison is that they yield the same node positions for the same graphs even after node reordering. Such layouts are graph invariant [21], meaning that two isomorphic graphs will yield the exact same visual layout. A user who sees two different visual layouts can immediately deduce that the two graphs are different. Although the reciprocal is not true, our experience suggests that in practice, when two layouts are
identical it often implies that the two graphs are identical and the superposition makes it easy to confirm or infirm. A third benefit of deterministic layouts is in their robustness: small modifications of the graph with respect to the node signatures of interest will typically produce only slight changes in the layout. This lets users estimate, at a glance, how much two graphs differ. Finally, as we will later see, deterministic layouts are an essential component of the reification of graph matching functions. For the purpose or simple label based matching we have implemented a deterministic layout, named alpha layout and based on alphabetic ordering and word length to ensure that two nodes with the same label have the exact same position and that in general, words close in terms of size or alphabetic ordering have close positions. The third type of layout is the transformation-based layout. These layouts are different from the two previous types of layout in that they modify the currently displayed layout rather than computing a new layout from scratch. They can be used as post-processing tools to tidy up the results from optimization-based layouts, and are either discrete or progressive. Common examples of discrete transformation layouts are node overlap removal algorithms like Dwyer’s [14]. Examples of progressive transformation layouts are spring-based layouts, which can be used to separate nodes that are too close. Our interaction model allows applying transformation layouts in sequence. We have found, for example, that applying a LinLog layout followed by a small amount of spring layout followed by a node overlap removal layout often produces excellent visual results. We have also designed geometrical transformation layouts for the sole purpose of visual comparison. These deform and stretch existing layouts (e.g., digging a hole in the middle) or project nodes on a curve such as an ellipse. As will be illustrated later, they make it possible to arrange multiple layers in a richer way than simply putting them side-by-side or superimposing them. Finally, layouts can be shared between layers resulting in cascading computation of positions for nodes. For example, when two graphs are displayed on two different layers with nodes matching between the two layers, the positions of nodes can be computed according to its own layer layout or according to the position of matched nodes in the other layers. Sharing layout computations over different layers, makes a variety of comparisons possible.
3.2 EXPLORE The explore interaction techniques constitute the complementary aspect of our interaction model and are based on different types of animations, zooming, and panning. Layers can be animated in two different ways. In addition to animations that are intrinsic to incremental layout algorithms (e.g., springs), node motions are smoothly animated to clarify how layouts operate in case iterations are slow and/or involve node jumps (e.g., Kamada-Kawai). The progressive animation of layout algorithms and the fact that they can be stopped at any time provides an affordance for combining them in sequence, which is especially useful for the transformation layouts mentioned above. These quick animated transitions employ a slow-out effect [38] and allow users to rapidly compare different layouts for a given graph. A second type of animated transition is slower and uses linear pacing [38], which facilitates detailed graph comparison and makes it possible for users to follow individual nodes.
Finally, flip-book animation between layers using crossing provides fluid interaction useful for comparison. Layers can be zoomed in or out in addition to standard pan operations. Although homogeneous zoom is widely used, we found it of limited use for exploring graphs. Instead, our layers support (a) a zoom that only affects object distances and (b) a zoom that only affects object size also known. Being able to control object distance and size separately is important while navigating node-link diagrams, as users may want to spread nodes apart without affecting the legibility of labels, while being able to occasionally adjust the font size of the labels.
hal-00694422, version 1 - 4 May 2012
Furthermore, these two types of zoom can be applied on either a single layer or all layers simultaneously. This is an effective way of combining the layer paradigm with the zoomable user interface (ZUI) paradigm [6][7]. One direct benefit of multi-layer zoom compared to traditional ZUIs is that users can assign different levels of zoom to different layers to match their foci of interest. Finally, layers can also be put side-by-side so that both side-byside and superimposed comparisons are possible. This is done by combining a tiling window manager [32] with a drag-and-drop technique that allows to move individual layers from a window to another. A similar drag-and-drop technique where tabs are used instead of layers has been introduced in [5] and is now implemented in applications such as Google Chrome. Another way of performing side-by-side comparisons is by simply translating individual layers. This technique is well-suited to temporary side-by-side comparisons while tiling is more suited to longer-term comparisons and allows organizing layers in groups.
4. GRAPH MATCHING FUNCTIONS Paradoxically, even though matching functions play a crucial part in most graph comparison problems most visual graph comparison programs consider them as black boxes. In order to make possible graph comparison with different matching perspectives and with a finer control over matching functions we propose to reify matching functions. Following the definition of Beaudouin-Lafon [4], "reification is the process by which concepts are turned into objects […] Reification creates new objects that can be manipulated by the user, thus increasing the set of objects of interest." The reification of graph matching functions is handled through the visual and interactive construction of master graphs. In terms of graph theory, master graphs can be considered as clustered graphs, e.g. graphs with clustering structures over the vertices. A master graph can be created on demand while interacting with several layers. The clusters of a master graph are created from layout positions at the time of creation. For example, suppose one wants to compare metabolic pathways from different species according to structural information and sequence information that can be embodied in a layout where the x coordinate represents discriminating structural information and the y coordinate represents discriminating sequential information. Using this layout with graphs of different species on different layers will result on superposition of nodes with similar x and y. Creating a master graph from these layouts will result in a master graph made of clusters of nodes that share the same structural and sequential information. Interactive node superposition can further be adjusted by the expert prior to master graph creation to make all sorts of useful adaptation of matching functions. As a result a master graphs embodies a matching function and can further be used to coordinate the position of all matching nodes to facilitate
visual comparison. The fact that master graph are represented graphically and created and deleted on demand makes possible the use of a variety of semi-automatically controlled matching functions for visual comparison tasks.
5. CASE STUDIES We have developed a system named Donatien in order to test our approach with case studies involving real data. In this section, we report three different case studies conducted with Donatien.
5.1 EVOLUTION OF RESEARCH TOPICS The Infovis 2004 contest [19] [34] served as a benchmark for our first case study. The InfoVis Contest dataset contains 614 papers that were published between year 1974 and 2004. In addition to raw data, the benchmark contains three general tasks: (1) give a static overview of 10 years of Infovis, (2) find out major research topics and their evolution and (3) find out major authors in the InfoVis contest set. Several visual approaches to this dataset have been proposed at the time of the contest. To our knowledge, none of them has used a multi-layer approach. Amongst the three tasks at stake in the contest, we focus on the second task – i.e., find out major research topics and their evolution. A burst analysis [27] identifies sudden increases in the usage of keywords and is used in the work of [39] to highlight six particular bursts: the first bursts are with user interface and human factors in the beginning years of infovis research; followed by data visualization that dominates in 94/95 and is replaced by information visualization, since 98. Based on In-SPIRE time slicer and outlier, the analysis of [40] concludes that there are no focal topics in the community at the beginning, domination of user design themes prior to 95, diverse and topic rich period between 1995-2000 and dominance of trees/hierarchies/graphs from 2001, 2002. Finally, based on histograms displaying most popular topics over years, the work of [30] indicates that graph visualization has grown in popularity quite recently and was most popular in 2001, dynamic queries has exhibited steady increase over the period of 1996-2004, and tree visualization was the most popular in 2000. Figure 1 is made from the papers/keywords found in the benchmark for the period prior to 1994. This visualization is the result of multi-layer interactions with Donatien: one layer is first created for each year of publication prior 1993. Each layer is associated with a color used both for the title bar controlling the layer and for coloring nodes and edges of that layer. A matching of all keywords based on their label is performed by aligning all layers through an alpha layout. A master graph is created to reify this matching. The resulting master graph is displayed in the layer entitled Anya using a LinLog layout. All layers are further laidout according to the master graph. Only labels of matching nodes are displayed. A barcode made of colored squares appears on top of matched nodes to indicate the layers of the different matches. For example, on top of computer graphics is a barcode made of cyan/orange/green squares indicating that matched nodes for computer graphics are in layers 1990 (cyan), 1991(orange) and 1993 (green). Figure 1 confirms the fact that human factors and graphical user interfaces were important topics for the first period of information visualization publications found in the benchmark, but it also makes clear that the collection is relatively balanced with other topics as well. For example, computer graphics, information
retrieval, algorithm animation, graph theory, trees, input devices were already well represented in the network.
hal-00694422, version 1 - 4 May 2012
Similar multi-level interaction for the last years covered in the dataset lead to a visualization showing that the vocabulary for this period tend to diversify for each topic leading to a situation where simple alpha matching was no longer sufficient. A more expert controlled matching was necessary and could be easily performed as an adjustment of alpha matching to match nodes that relate to the same topics while having very different labels such as Fisheye with Focus+context and Overview+details. Another example is CSCW that an expert can decide to match with coordination and collaboration. Once a matching is interactively adjusted the visualization confirms most insights found in previous work but also shows other important aspects: new emerging topics such as trend analysis, structure-based brushing or CSCW are visible and relevant while not captured by previous work analysis. Also compared to the network covering the first period, an important highly connected component appears and links all major topics. A meaningful difference seems to come from the fact that emerging topics are connected to this dense component or not.
is visually apparent that in practice links are missing. For example, safety boat (canot) is a hyponym of boat (navire, formal French word for boat) but the reciprocal relationship is missing from the hypernym graph. The low level of the degree of symmetry suggests a bias in the acquisition game to be further investigated. In addition to the overview it provides, the merged view can also be used for checking the validity of individual relationships across graphs. It appears that more errors can be spotted in the hyponymy graph than in the hypernymy graph. The source of errors also seems different: hyponym errors seem to stem from a confusion with the “related idea” relationship. For example, Capitaine Haddock is a fictitious boat captain, so it is related to boat but not a hyponym for boat. In contrast, hypernyms seem to exhibit a confusion with the “part-of” relation. For example, a row (rame) is part of a boat, and a boat is part of a fleet (flotte). These observations suggest that some questions used in the data generation game might need to be reformulated.
For example, topics like structure-based brushing or trend analysis emerged outside of the dense component and are original and important aspects of the field of information visualization. CSCW, geographic visualization or database visualization emerged directly connected to the large component and appear more as bridges with other domains than new core information visualization topics such as structure-based brushing or trend analysis. The extent to which such findings can be generalized, predicted or explained with a model of knowledge evolution can be the subject of future work.
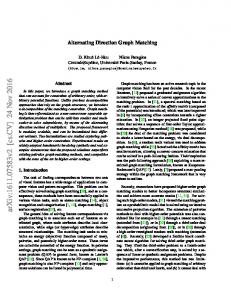
5.2 LEXICAL NETWORKS The second case study involves a data set extracted from Jeux de Mots [27][25], a lexical network of the French language. Users contribute to Jeux de Mots by playing a coordination game. For example, a player is asked to provide as many terms as possible related to a given term in a limited amount of time. The answers are then compared to those of a previous player. The two players earn points based on how many terms they agree on and agreed relations and terms are then appended to the lexical network following a cumulative weighting system[27]. Jeux de Mots now contains more than 200,000 lexical terms and 1,200,000 lexical relations. Despite its original data generation method, Jeux de Mots regularly needs to be validated and corrected for errors by human experts. Donatien can be used to compare subgraphs of interest extracted from Jeux de Mots for detecting patterns and errors. Here we take as an example lexical networks in the neighborhood of the word “boat” (bateau in French). We start with the visual comparison in Figure 2 of two lexical relationships: hypernymy and hyponymy. A hyponym is a “typeof” lexical relationship. For example, voilier (sailing boat in French) is a hyponym for bateau (boat). Reciprocally, boat is a hypernym for sailing ship. In figure 2, hypernyms are shown in blue and hyponyms in pink. Matching nodes are superimposed and surrounded by a halo, making the graph intersection clearly visible: the two relationships only have five words in common. Hypernymy and hyponymy are theoretically symmetrical relationships, and links displayed in the merged view can be also used to find out to what extent this symmetry holds in practice. It
Figure 2: Comparison of hypernym and hyponym subgraphs A further visual analysis of the evolution of these two lexical relations was performed to study the evolution of their intersections between 2008 and 2010. In order to achieve such a comparison visually, we move the 2008 graphs of hypernym and hyponyms on the left of the display and the two other graphs of 2010 on the right of the display. An automatic layout based on the underlying master matching graph is used to discriminate between nodes lying at the intersection of the four graphs: nodes at the intersection of hyponym and hypernym graphs, no matter what year, lie respectively on the left and right of the display. Nodes that lie at the intersection of year 2008 and 2010, no matter hyponym or hyperonym lie in the middle of the display. Crossing through layers shows that the proportion of words lying at the intersection of hyponym and hypernym graphs seems relatively stable over time. A closer look at the 2010 graph, shows that the hypernym graph is growing downward – e.g. toward more specific terms, rather that upward – e.g. toward more abstract terms. This suggests that the game strategy underlying the construction of Jeux-de-Mots has introduced a bias that unbalances the hypernym and hyponym relations in one subgraph. The extent to which this insight generalizes to other parts of the network and its impact remains to
be investigated. However, this preliminary insight already demonstrates the benefits of interactive matching and visual comparison that enabled the visual analysis of the evolution of the intersection of two graphs, a task reputed to be challenging.
by-side view (Figure 3 - (a)), shows four different clustering algorithms results that correspond to algorithms previously studied analytically [2]. The side-by-side view shows from left-toright and bottom to up the results of the following algorithms: CNM – unweighted version, CMJA, K-Mean, and CNM weighted versions. The top right clustered graph (CMJA result) is very different from the three others. Another immediate visual insight is that the sizes of K-Mean and CNM resulting clustered graph are much more homogeneous than the sizes of the clusters resulting from CMJA.
hal-00694422, version 1 - 4 May 2012
More detailed comparison is achieved by superposing the clustered graphs resulting from two different algorithms. The view (b) and (c) of Figure 3 respectively compare the CNM and k-mean results (b) and weighted and unweighted versions of CNM results (c). These views are a reconfiguration of views in Figure 1 – (a) obtained by first applying a LinLog layout to the elements contained in the clusters determining the end of cluster edges and then applying a push-aside transformation on the results of the LinLog layout so that elements in the clusters are displayed on the periphery while keeping proximities relatively coherent with connectivity. Cluster nodes are further placed using a barycentric layout based on the positions of the elements they contain. Lastly, the barycentric positioning is combined with a projection on a central ellipse. This last transformation separates clusters from their elements and positions them in a visually distinguishable way. Note that the combination of these various layouts is facilitated through fluid interaction supported by crossing-based interaction with title bars.
(a)
(b)
(c)
Figure 3: Cluster comparison without the elements visible (a) side-by-side comparison of fours clustering results, (b) superimposed comparison of cnm and kmean clustering results and (c) superimposed comparison of two versions of the cnm clustering results
5.3 CLUSTERED GRAPHS The comparison of clustered graphs is useful in many fields where clustering is used. Even though a lot of analytical criteria have been proposed to measure qualitative aspects of clustering results, their scope is very limited and comparing clustering results remains an open issue [2]. In this case study, the multi-layer interaction model is used to compare clustered graphs built from the same dataset using different clustering algorithms. The dataset is extracted from Jeux de mot presented previously. The first comparison of clustering results is depicted in figure 3 and 4. Clusters are graphically represented by a cluster node. Special rendering is used to indicate edges that relate a cluster to the nodes it contains. For example, in figure 4 (c), four clusters E0, E1, E2, E3 are visible and cluster E0 contains the terms Angularité and Aigu. In the first comparison depicted by figure 3, the focus is on clusters, terms are not visible but are laid out at the same position in all displays. Since they can be made visible interactively by the expert, they can then be memorized and guessed at the end of each cluster edge even when they are no longer visible. The side-
From these two views (b) and (c) it is more visually clear that the results of weighted and unweighted version of CNM are closer to each other than the k-mean and CNM which differ at many places. No analytical criteria could be found to measure these differences automatically as well as they appear visually. Furthermore, the fact that they are visually represented offers opportunities for exploration or explanation of the differences and commonalities that no analytical criteria can provide. The second visual comparison of this case study aims at exploring further the differences between the clustering results. Figure 4 shows the different frames of a crossing-based interaction that flips through different superposed layers. Figure 4 (a) shows the subgraph to be clustered, followed by the various clustering results (b), (c), (d), (e) and (f) finally shows all superposed layers. It shows, a k-mean (d) and a cmja (c) lead to exact same results in this particular case. It also shows that two clusters respectively {angularité, aigu} and {loi, autorisation, acceptation, ratifier} are found by all clustering algorithms. Finally, it shows that algorithms differ mostly with most connected part of the graph and particularly depend on how highly connected nodes such as notoire and manifeste are treated. It is also very clear from these visual comparisons, that all clustering results make sense and can be considered valid even though they convey important differences. These differences are meaningful to experts and cannot be captured by any analytical criteria to our knowledge. Our interactive and visual approach provides insights useful to compare clustering algorithms used in so many domains. We speculate that by using such approach, domain experts would gain experience and skills useful to choose appropriately clustering algorithms for specific data and related analysis tasks.
hal-00694422, version 1 - 4 May 2012
(a)
(b)
(c)
(d)
(e)
(f)
Figure 4: Comparison of clustered graphs resulting from 5 different clustering algorithms. (a) the original graph. (b), (c), (d), (e) clustered graphs resulting respectively from CNM-weighted, CMJA, K-MEAN and CNMunweighted algorithms [2]. (f) superposition of all resulting clustered graphs.
6. CONCLUSION In this paper, we propose a new approach to visual comparison of graph and clustered graph based on an interaction model considering matching and comparison tasks as a whole. The interaction model is based on four key aspects: (1) fluid multilayer support, (2) fluid reconfiguration based on various types of layout strategies and crossing based interaction through layers title bars, (3) multi-layer zooming and panning and (4) matching function reification through interactive and visual creation of master graphs. Our initial case studies suggest that the approach offers a lot of benefits. Future work includes controlled experiments with users engaged in visual comparison and matching tasks. Future works also includes the design of additional deterministic layout algorithms as new types of matching functions needs to be integrated.
[17] Erten, C., Kobourov, S.G., Le, V., Navabi, A.: Simultaneous graph drawing: Layout algorithms and visualization schemes. In: Symposium on Graph Drawing. pp. 437– 449 (2006) [18] Euzenat, J., Valtchev, P.: Similarity-based ontology alignment in OWLlite. In: Proceedings of ECAI-04. pp. 333–337. (2004) [19] Fekete, J.-D., Grinstein, G., Plaisant, C., IEEE InfoVis 2004 Contest, the history of InfoVis, 2004. [20] Fekete, J.D., Beaudouin-Lafon, M.: Using the multi-layer model for building interactive graphical applications. In: Proceedings of UIST’96. pp. 109–118. ACM (1996) [21] Fortin, S.: The graph isomorphism problem. Tech. rep., University of Alberta (1996) [22] Granitzer, M., et al..: Ontology alignment, a survey with focus on visually supported semi-automatic techniques. Future Internet 2(3), 238–258 (2010). [23] Holten, D., Wijk, J.J.V.: Visual comparison of hierarchically organized data. Computer Graphics Forum 27 (2008) [24] http://jung.sourceforge.net/
hal-00694422, version 1 - 4 May 2012
7. REFERENCES [1]
Christopher Ahlberg: Spotfire: An Information Exploration Environment. SIGMOD Record 25(4): 25-29 (1996)
[2]
Artignan G., Hascoët M., Empirical Evaluation of Clustering Algorithms for Large Networks, Lirmm RR00648389, http://hallirmm.ccsd.cnrs.fr/lirmm-00648389/en/, 2011.
[3]
Andrews, K., Wohlfahrt, M., Wurzinger, G.: Visual graph comparison. In: proceedings IV'2009, IEEE, pp. 62–67 (2009)
[4]
Beaudouin-Lafon M., Mackay W.,E.,: Reification, Polymorphism and Reuse: Three Principles for Designing Visual Interfaces. Advanced Visual Interfaces 2000: 102-109
[5]
Beaudouin-lafon, M., Mackay, W.E., al.: Cpn/tools: A post-wimp interface for editing and simulating coloured petri nets. In: ICATPN 2001. 2001
[25] http://jeuxdemots.org. [26] Keim, D.A., Oelke, D., Rohrdantz, C.: Analyzing document collections via context aware term extraction. In: NLCS, vol. 5723, pp. 154–168. (2009) [27] Kleinberg, J.M. Bursty and hierarchical structure in streams. In 8th ACM SIGKDD Intl. Conf. on Knowledge Discovery and Data Mining. 2002: ACM Press. p. 91-101. [28] Lafourcade, M, Making people play for lexical acquisition. In SNLP2007, 2007. [29] Lanzenberger, M., Sampson, J.: Alviz - a tool for visual ontology alignment. In: International Conference on Information Visualisation. pp. 430–440 (2006) [30] Lee B., Czerwinski M., Robertson G., and Bederson B.B., Understanding Eight Years of InfoVis Conferences using PaperLens. In INFOVIS '04. IEEE, 2004.
[6]
Bederson, B.B., Grosjean, J., Meyer, J.: Toolkit design for interactive structured graphics. IEEE Trans. Software Eng. 30(8), 535–546 (2004)
[7]
Bederson, B.B., Meyer, J., Good, L.: Jazz: an extensible zoomable user interface graphics toolkit in java. In: UIST. pp. 171–180 (2000)
[8]
Brandes, U., Corman, S.R.: Visual unrolling of network evolution and the analysis of dynamic discourse. In: IEEE Symposium on Information Visualization. pp. 145– 151 (2002)
[33] Noack, A.: Energy models for graph clustering. J. Graph Algorithms Appl. 11(2), 453–480 (2007)
Brandes, U., Dwyer, T., Schreiber, F.: Visual understanding of metabolic pathways across organisms using layout in two and a half dimensions. Journal of Int. Bioinformatics 1 (2004)
[34] Plaisant, C., Fekete, J.D., Grinstein, G.: Promoting insight-based evaluation of visualizations: From contest to benchmark repository. IEEE TVCG, 14, 120–134 (January 2008).
[10] Collberg, C., Kobourov, S., Nagra, J., Pitts, J., Wampler, K.: A system for graphbased visualization of the evolution of software. In: Software Visualization (2003)
[35] Rahm, E., Bernstein, P.A.: A survey of approaches to automatic schema matching. The VLDB Journal 10, 334–350 (December 2001)
[9]
[11] Collins, C., Carpendale, M.S.T.: Vislink: Revealing relationships amongst visualizations. IEEE Transactions on Visualization and Computer Graphics 13, 1192– 1199 (2006)
[31] Munzner, T. et al. .: Treejuxtaposer: scalable tree comparison using focus+context with guaranteed visibility. ACM Trans. Graph. 22, 2003 [32] Myers, B.A.: Window interfaces: A taxonomy of window manager user interfaces. IEEE Computer Graphics and applications pp. 65–84 (1988)
[36] Shneiderman, B.: Why not make interfaces better than 3d reality? IEEE Comp Graphics and Applications 23(6), 12–15 (2003) [37] Yee, K., Fisher, D.: Animated exploration of dynamic graphs with radial layout. In: in INFOVIS. pp. 43–50 (2001)
[12] Conte, D., Foggia, P., Sansone, C., Vento, M.: Thirty years of graph matching in pattern recognition. Int.Journal of Pattern Recognition and Artificial Intelligence 18, 265–298 (2004)
[38] Dragicevic P., Bezerianos A., Javed W., Elmqvist N. and Fekete J-D. Temporal Distortion for Animated Transitions. In CHI '11. ACM, 2011.
[13] Diehl, S., Gorg, C.: Graphs, they are changing dynamic graph drawing for a sequence of graphs. In: Graph Drawing (2002).
[39] Weimao Ke, Katy Borner, and Lalitha Viswanath. 2004. Major Information Visualization Authors, Papers and Topics in the ACM Library. In INFOVIS '04. IEEE, 2004.
[14] Dwyer, T., Marriott, K., Stuckey, P.J.: Fast node overlap removal correction. In: Graph Drawing. pp. 446–447 (2006) [15] Erten, C., Harding, P.J., Kobourov, S.G., Wampler, K., Yee, G.V.: Graphael: Graph animations with evolving layouts. In: Symposium on Graph Drawing. pp. 98–110 (2003) [16] Elmqvist N., Dragicevic P., Fekete J. D.: Rolling the Dice: Multidimensional Visual Exploration using Scatterplot Matrix Navigation. IEEE TVCG, 14(6), 2008.
[40] P. C. Wong, et al. 2004. IN-SPIRE InfoVis 2004 Contest Entry. In Proceedings Infovis'2004. IEEE 2004. [41] YI J.-S., KANGY. STASKO A., et JACKO J., Toward a Deeper Understanding of the Role of Interaction in Information Visualization, IEEE TVCG 13, 6, 1224-1231. [42] Accot, J., & Zhai, S., More than dotting the i's - foundations for crossingbased interfaces, in Proc. of CHI'2002: ACM Conference on Human Factors in Computing Systems, Minneapolis, Minnesota, April 2002. pp 73-80.