Interactive Methods for Taxonomy Editing and Validation Scott Spangler
Jeffrey Kreulen
IBM Almaden Research Center 650 Harry Road, San Jose, CA 95120 408-927-2887
IBM Almaden Research Center 650 Harry Road, San Jose, CA 95120 408-927-2431
email:
[email protected]
email:
[email protected]
ABSTRACT
1
Today’s enterprise understands that improved utilization of its collective knowledge assets leads to improved business performance. The reality of proliferation of electronic information and pressures to produce more with fewer resources while performing increasingly complex tasks makes this a continuous challenge. To address this challenge and create value where there is currently chaos, enterprises are building knowledge repositories and structuring them in ways that are meaningful to their organization, business and processes. This structuring typically manifests itself in the form of one or more taxonomies. The taxonomies are meaningful hierarchical categorizations of documents into topics reflecting the natural relationships between the documents and their business objectives. Improving the quality of these taxonomies and reducing the overall cost required to create them is therefore an important area of research. Supervised and unsupervised text clustering are important technologies that comprise only a part of a complete solution. However, there exists a great need for the ability for a human to efficiently interact with a taxonomy during the editing and validation phase. We have developed a comprehensive approach to solving this problem, and implemented this approach in a software tool called eClassifier. eClassifier provides features to help the taxonomy editor understand and evaluate each category of a taxonomy and visualize the relationships between the categories. Multiple techniques allow the user to make changes at both the category and document level. Metrics then establish how well the resultant taxonomy can be modeled for future document classification. eClassifier enables the development of multiple taxonomies so that multiple relationships in the documents can be modeled. In this paper, we present a comprehensive set of viewing, editing and validation techniques we have implemented in the Lotus Discovery Server resulting in a significant reduction in the time required to create a quality taxonomy.
Businesses have been able to systematically increase the leverage gained from enterprise data through technologies such as relational database management systems and techniques such as data warehousing. Additionally, it is conjectured that the amount of knowledge encoded in electronic text far surpasses that available in data alone. However, the ability to take advantage of this wealth of knowledge is just beginning to meet the challenge. Businesses that can take advantage of this potential will surely be at an advantage through increased efficiencies. One important step in achieving this potential has been to structure the inherently unstructured information in meaningful ways. A well-established first step in gaining understanding is to segment examples into meaningful categories [2]. This leads to the idea of taxonomies--natural hierarchical organizations of the information in alignment with the business goals, organization and processes. While there will be some commonality in some industries, these natural organizations will have significant diversity across domains and organizations.
INTRODUCTION
Research to address this need for taxonomy development has concentrated largely around automated grouping techniques such as text clustering. While we believe that text clustering is an invaluable tool, indeed it is part of our solution, we assert that it is insufficient to meet the full challenge of taxonomy generation by itself. Our experience using variations of KMeans [6][10] and Expectation Maximization (EM) clustering algorithms [16] [17] have shown that they generate useful seed taxonomies, but rarely generate a satisfactory final taxonomy for a given business problem. For example, if you were to cluster a set of patents with the intent to create a technology based taxonomy you would typically find some of the clusters to be technologies and some to be based on some other aspect or relationship found in the text such as processes. One might postulate that the clustering algorithm is in fact not the issue, but this is a feature selection problem. An alternative approach would be to leverage controlled vocabularies. However, we find this approach to be very labor intensive and would still yield results that would need further refinement. Our approach to solve this problem focuses on the visualization, editing and validation of clustering results. We will go into details of our approach below but further clarification on the problem and its relationship to cluster validation is warranted. The problem we are attempting to solve has been referred to in the literature [4] [7] as clustering validation. Validation methods have typically been based on one of three types of
criteria: external, internal and relative. External criteria typically use a pre-specified 'ground truth' by which we can directly measure the quality of our clusters. Internal criteria are based on statistics or measures computed from a given taxonomy. Relative criteria are based on comparison with alternative taxonomies. Our approach integrates internal and external criteria, with the external criteria (a human expert) being the final determinant. Clearly it is not practical to read each document and categorize it, however, expert inspection guided by appropriate feedback is a powerful combination. The system in which we have implemented our solution is the Lotus Discovery Server (LDS) [9]. This system automatically selects the features and generates an initial taxonomy using its Automatic Taxonomy Generation (ATG) technology, which is based on a variant of the EM algorithm [15]. In this paper we will outline a system and methodology that leverages clustering as a seed taxonomy and provides the appropriate feedback to a human analyst to efficiently guide the user to refine the taxonomy toward a desired, if not previously known, quality and model-able taxonomy. In section 2, we describe the important capabilities for viewing and understanding a taxonomy. This gives the taxonomy analyst the necessary feedback to modify a taxonomy, which we describe in section 3. In section 4, we describe our approach to validating and ensuring that a taxonomy can be modeled for the purpose of classifying future documents. In section 5, we provide an example of using all of the features to illustrate the power of our approach. Finally, in section 6 we summarize and outline areas for future research.
2
VIEWING THE TAXONOMY
Before a user can begin editing a taxonomy, they must first understand the existing categories and their relationships. In this section, we describe the strategy employed by eClassifier to communicate the features of a document taxonomy to the user. To facilitate the understanding process we represent the documents within eClassifier in a vector space model. We represent each document as a vector of weighted frequencies of the document features (words and phrases) [13]. We use the txn weighting scheme [12]. This scheme emphasizes words with high frequency in a document, and normalizes each document vector to have unit Euclidean norm. For example, if a document were the sentence, “We have no bananas, we have no bananas today,” and the dictionary consisted of only two terms, “bananas” and “today”, then the unnormalized document vector would be {2 1} (to indicate two bananas and one today), and the normalized version would be: 2 , 1 .
5
5
Our primary representation of each category is the centroid [5]. The distance metric employed to compare documents to each other and to the category centroids is the cosine similarity metric [10]. This metric is used at the user’s request to automatically partition any subset of the problem tickets into k disjoint clusters. As will be seen, during the category editing process, we are not rigid in requiring each document to belong to the category of its nearest centroid, nor do we strictly require every document to belong to only one category. To provide a good understanding of a given taxonomy, which are generally hierarchical in structure, we provide in eClassifier
a series of views that cover different levels of detail. The views include a global, single level within a tree (all children of a single parent including the root), and a detailed view of each individual category. In the global “Categorization Tree” categories that have subcategories are displayed as “folders” which can be expanded (see Figures 3 and 10). Leaf categories are displayed as nodes. Selecting a folder can take the user down a level to the Category Table view, which shows statistics about just the categories that are immediate subclasses of the selected category (see Figures 5 and 6). Selecting a leaf category or selecting a row in the Category Table displays the Category View (see Figure 7). This view provides several different windows on a single category that help to explain and summarize the content of the selected category’s documents. The remainder of this section describes in detail what information is communicated in the Category View.
2.1
Summaries
Since we cannot expect the user to spend the time to read through the individual documents in a category, summarization is an important tool in helping the user understand what a category contains. Summarization techniques based on extracting text from the individual document [8] were found to be insufficient in practice for the purpose of summarizing an entire document category, especially when the theme of that category is somewhat diverse. Instead, we employ two different techniques to summarize a category. The first is a feature bar chart. This chart has an entry for every dictionary term (feature) that occurs in any document of the category. Each entry consists of two bars, a red bar to indicate what percentage of the documents in the category contain the feature, and a blue bar that indicates how frequently the feature occurs in the background population of documents from which the category was drawn. The bars of the chart are sorted in decreasing order of the difference between blue and red. Thus the most important features of the category in question are shown at the beginning of the chart. This chart quickly summarizes for the user all the important features of a category, with their relative importance indicated by the size of the bars. The second technique is a dynamic decision tree representation that describes what feature combinations define the category. This tree is generated in the same manner as a binary ID3 [11], selecting at each decision point the attribute that is most helpful in splitting the whole population of documents so that the two new classes of documents created are most nearly pure category and pure non-category. Each feature choice is made on the fly as the user expands each node, until a state or purity is reached or when no additional features will improve the purity with respect to the category. The result is essentially a set of classification rules that define the category to the desired level of detail. At any point the user may select a node of the decision tree to see all the documents at the node, all the in-category documents at the node, or all the non-category documents at the node. The nodes are also color coded: red is a node whose membership is more than (or equal to) 50% in category, blue is a node whose membership is less than 50% in category. This display gives the user an in depth definition of the class in terms of salient features and lets them readily select various category components for more in depth study.
2.2
Visualization
In order to understand specifically how two or more categories at the same level of the taxonomy relate to each other, a visualization strategy is employed. The idea is to visually display the vector space of a bag-of-words document model [12] [13] to the user so that the documents will appear as points in space. The result is that documents containing similar words occur near to each other in the visual display. If the vector space model were two dimensional, this would be straightforward— we could simply draw the documents as point on an X,Y scatter plot. The difficulty is that the dimensions of the document vector space will be of much higher dimension. In fact the dimensionality will be the size of the feature space (dictionary), which is typically thousands of terms. Therefore we need a way to reduce the dimensionality from thousands to two in such a way as to retain most of the relevant information. Our approach uses the CViz method [3], which relies on three category centroids to define the plane of most interest and to project the documents as points on to this plane (by finding the intersection with a normal line drawn from point to plane). The selection of which categories to display in addition to the selected category is based on finding the categories with the nearest centroid distance to the selected category. The documents displayed in such a plot are colored according to category membership. The centroid of the category is also displayed. The resultant plot is a valuable way to discover relationships between neighboring concepts in a taxonomy. [see figure 8]
2.3
Sorting of Examples
The tool’s job is to allow the user to make whatever changes may be deemed desirable. In some cases such changes can be made at the category level, in other cases a more detailed modification of category membership may be required. Our tool provides capabilities at every level of a taxonomy to allow the user to make the desired modifications with a simple point and click.
3.1
Category Level
Category level changes involve modifying the taxonomy at a macro-level, without direct reference to individual documents within each category.
3.1.1
Merging
Merging two classes means creating a new category that is the union of two or more previously existing category memberships. A new centroid is created that is the average of the combined examples. The user supplies the new category with an appropriate name.
3.1.2
Deleting
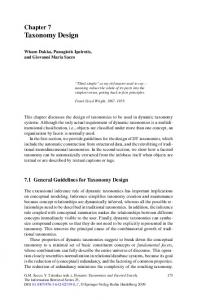
Deleting a category (or categories) means removing the category and its children from the taxonomy. The user needs to recognized this may have unintended consequences, since all the examples that formerly belonged to the deleted category must now be placed in a different category at the current level of the taxonomy. To make this decision more explicit, we introduce the graphic called “View Similar Categories” chart:
When studying the examples in a category to understand the category’s essence, it is important that the user not have to select the examples at random. To do so can sometimes lead to a skewed understanding of the content of a category, especially if the sample is small compared to the size of the category (which is often the case in practice). To help alleviate this problem, eClassifier allows sorting of examples based on the “Most Typical” first or “Least Typical” first criteria. This translates in vector space terms to sorting in order of distance from category centroid (i.e. most typical is closest to centroid, least typical is furthest from centroid). The advantage of sorting in this way is two fold: reading documents in most typical order can help the user to quickly understand what the category is generally about, without having to read a large sample of the documents in the category, while reading the least typical documents can help the user to understand the total scope of the category and if there is conceptual purity.
3
Figure 1: Similar Categories Display
EDITING THE TAXONOMY
Once the content manager understands the meaning of the classes in the taxonomy and their relationship to each other, the next step is to provide tools for rapidly changing the taxonomy to reflect the needs of the application. Keep in mind that our goal here is not to produce a “perfect” taxonomy for every possible purpose. Such a taxonomy may not even exist, or at least may require too much effort to obtain. Instead we want to focus the users efforts on creating a “natural” taxonomy that is practical for a given application. For such applications, there is no right or wrong change to make. It is important only that the change accurately reflect the expert user’s point of view about the desired structure. In this situation, the user is always right.
This chart displays what percentage of a categories documents would go to which other categories if the selected category were to be deleted. Each slice of the displayed pie chart can be selected to view the individual documents represented by the slice. Making such information explicit allows the user to make an informed decision when deleting a category, avoiding unintended consequences.
3.1.3
Clustering
At any node of the Categorization Tree the user may request subclassing via text clustering. This will apply a standard
clustering algorithm, such as k-means [6] [10] to the set of documents represented by the selected category. The user will be asked to provide a value for the number of classes to create. EClassifier will then automatically produce the subclasses derived from applying the clustering algorithm to the vector space model. Each newly derived subcategory will be given a name based on the features that have an in-class frequency most different from that of the background frequency. If desired, eClassifier can apply this same clustering approach repeatedly in a recursive fashion on each derived category until a stopping criteria is reached (either some user supplied minimum category size or sufficiently high value category cohesion). The resulting sub-categorization can then be edited if desired to reflect a more natural partitioning.
3.1.4
3.2.3
Dragging and Dropping
From the Categorization Tree view the user can select any category and drag and drop the category into any existing folder (a category with children). An example of when such an operation might be performed is when a very specific category is created at the root node of the tree, which would more naturally belong within an already existing, more general, category. The operation of dragging and dropping a category to a folder has consequences to all other folders in a direct line from the root of the tree to the destination node (which gain the contents of the source node) and to all other folders in a direct line form the root to the source node (which lose the contents of the source node). All such consequences are automatically handled by eClassifier.
Figure 2: Floating box for moving documents
3.2.4
3.2
Document Level
While some changes to a taxonomy may be made at the class level, others require a finer degree of control. These are called document level changes, and consist of moving or copying selected documents form a source category to a destination category. The most difficult part of this operation from the users point of view is selecting exactly the right set of documents to move so that the source and destination categories are changed in the manner desired. To facilitate this eClassifier provides a number of mechanisms for selecting documents.
3.2.1
Selection by Keywords
One of the most natural and common ways to select a set of documents is with a keyword query. EClassifier allows the user to enter a query for the whole document collection or for just a specific category. The query can contain keywords separated by “and” and/or “or” and also negated words. Words that co-occur with the query string are displayed for the user to help refine the query. Documents that are found using the keyword query tool can be immediately viewed and selected one at a time or as a group to move or establish a new category.
3.2.2
Selection by Visualization
The scatter plot visualization display described in section 2 can also be a powerful tool for selecting individual or groups of documents. Using a “floating box”, groups of contiguous points (documents) can be selected and moved to the new desired class.
Selection by Sorting
Another way to select documents to move or copy is via the “Most/Least Typical” sorting technique described in section 2. For example, the documents that are least typical of a given category can be located, selected, and moved out of the category they are in. They may then be placed elsewhere or in a new category.
To Move, Copy, or Delete…
Independent of the document selection method, the user is allowed to choose between moving, copying, or deleting the selected documents. Moving is generally preferable because single class membership generally leads to more distinct categories which are better for the classification of future documents. Still, in cases where a more ambiguous category membership better reflects the user’s natural understanding of the taxonomy, eClassifier allows the user to create a copy of the documents to be moved and to place this copy in the destination category. In such cases the individual document will actually exist in two (or more ) categories at once, until or unless the user deletes the example. Deletion is the third option. It allows the document to be removed entirely from the taxonomy, if it is judged to be not applicable.
4
VALIDATION
Whenever a change is made to the taxonomy, it is very important for the user to validate that the change has had the desired effect on the taxonomy as a whole, and that no undesired consequences have resulted from unintentional side effects. eClassifier contains a number of capabilities that allow the user to inspect the results of modifications. The goal is to insure both that the categories are all meaningful, complete, and differentiable, and that the concepts represented by the document partitioning can be carried forward automatically in the future as new documents arrive.
4.1
Direct Inspection
The simplest method for validating the taxonomy is through direct inspection of the categories. The category views
described in section 2 provides many unique tools for validating that the membership of a category is not more or less than what the category means. Looking over some of the “Least Typical” documents is an especially valuable way to quickly ascertain that a category does not contain any documents that do not belong. Another visual inspection method is to look at the nearest neighbors of the category being evaluated through the Scatter Plot display. Areas of document overlap at the margins are primary candidates for further investigation and validation.
4.2
Validation Metrics
Much research has been done in the area of evaluating the results of clustering algorithms [7] [10]. While such measures are not entirely applicable to taxonomies that have been modified to incorporate domain knowledge, there are some important concepts that can be applied from this research. Our vector space model representation [12] [13], while admittedly a very coarse reflection of the documents actual content, does at least allow us to summarize a singe level of the taxonomy via some useful statistics. These include: • •
Cohesion: a measure of similarity within category. This is the average cosine distance of the documents within a category to the centroid of that category. Distinctness: a measure of differentiation between categories. This is one minus the cosine distance of the category to the centroid of the nearest neighboring category.
These two criteria are variations to the ones proposed by [1]: Compactness and Separation. The advantage of using this approach as opposed to other statistical validation techniques is that they are more easily computed and also readily understood by the taxonomy expert. In practice, these metrics often prove useful in identifying two potential areas of concern in a taxonomy. The first potential problem is “Miscellaneous” classes. These are classes that have a diffuse population of documents that talk about many different things. Such classes may need to be split further or subcategorized. The second potential problem is when two different categories have very similar content. If two or more classes are almost indistinguishable in terms of their word content, they may be candidates for merging together into a single category. Statistical measures such as Cohesion and Distinctness provide a good rough measure of how well the word content of a category reflects its underlying meaning. For example, if a category that the user has created is not cohesive, then there is some doubt as to whether a classifier could learn to recognize a new document as belonging to that category, because the category is not well defined in terms of word content. On the other hand, if a category is not distinct, then there is at least one other category containing documents with a similar vocabulary. This means that a classifier may have difficulty distinguishing which of the two similar categories to place a candidate document in. Of course, cohesion and distinctness are rough and relative metrics, therefore there is no fixed threshold value at which we can say that a category is not cohesive enough or lacks sufficient distinctness. In general, whenever a new category is created, we
suggest to the user that the cohesion and distinctness score for the new category be no worse than the average for the current level of the taxonomy.
4.3
Applying Simple Classifiers
Metrics such as cohesion and distinctness provide a rough measure of how well a given document taxonomy can be modeled and used to classify new documents. A more accurate measure can be created by applying a suite of simple classification algorithms to a training sample of the data and seeing how accurately such classifiers work on a corresponding unseen test sample. If one or more of the classifiers can achieve a high level of accuracy on each of the categories, this indicates that there is sufficient regularity in the document word content to accurately categorize new documents, assuming the right modeling approach is used. In eClassifier, we use a three basic approaches, centroid based, naïve-bayes (multivariate and multinomial) [18], and ID3 decision tree [11] to generate classifiers from a document collection. These were chosen because they are well established in the research community, easy to program, and also very quick to train and test--speed is of the essence if we are to give the user immediate feedback on their taxonomy. Multiple approaches are necessary since the user’s changes may require one kind of categorization scheme in one area of the taxonomy, and a different scheme for another. For each category, an accuracy score is provide in the Category Table view that indicates how well that category can be modeled with that approach. Categories that cannot be modeled with any approach should be re-examined to see if they can be modified to make them more model-able.
5
TYPICAL SCENARIO
In this section we describe how eClassifier could be used in conjunction with the Lotus Discovery Server to edit an existing taxonomy to incorporate user knowledge about the domain. In this example we have an existing taxonomy of 14516 patent documents. Our expert user wants to create a new category consisting of all “fuel cell” patents and place it in the correct position in the overall taxonomy. Here is how that would be accomplished in eClassifier.
Figure 3: Categorization Tree View
The default view in eClassifier is the “Categorization Tree” which represents the global view of the taxonomy as a whole. Folders in this view represent categories that contain subcategories. Leaf nodes represent categories that have no subcategories. Clicking on any folder or node will show the document titles and other relevent information. The “Fit” value is a measure of the documents distance to the selected category centroid. After perusing the high level categories and finding nothing directly related to the “fuel cell” topic, the user enters a query in the Keyword Search dialog.
Figure 6: Result of adding "fuel cell" category
Figure 4: Keyword Search Form
Note that the cohesion and distinctness values for the new category are above average. This helps to validate that these documents have some underlying commonality and differentiability when compared to other categories in the taxonomy. To examine the category in more detail, we select it and move to the Category View.
We find 21 documents that contain both of these keywords. First, we would like to see where in the current taxonomy these documents are occurring. The category table view will indicate this information.
Figure 7: Category View
Figure 5: Category Table View This view shows the high level categories of the taxonomy. The last column indicates the percentage of documents in each category containing the keywords “fuel” and “cell”. Clearly these documents are distributed throughout the taxonomy, so we need to pull them together into a new category. This can be accomplished easily by selecting the “Create Category” button in the Keyword Search dialog. The result will be a new category as shown in Figure 6.
In the Category View we see in the upper left corner a decision tree model for this class that indicates that the class contains exactly those documents containing both “fuel” and “cell”. Additional keywords of interest, “membrane” and “gas”, are shown in the bar chart below this. These occur with less frequency than fuel or cell but with far more than the background frequency of the words in the document collection as a whole. In the right hand display we see a summary of the “most typical”: document. After browsing selected samples from most typical to least in this panel we judge that this set of documents is appropriate for our concept of what it means to be a “fuel cell” document. Next, we want to discover any additional documents which may not have been covered by our original query. For this we look at a “scatter plot view” of “fuel cell” and a couple of neighboring categories.
Figure 8: Scatter Plot of Fuel Cell and Near Neighbors The fuel cell category (shown in blue) has some overlap with the “water solution alcohol” category (shown in green). Clicking on one of these green points near the “exchanger hydrocarbon heat” centroid shows the following brief summary of the patent text:
Figure 10: Result of Moving Fuel Cell into Exchanger Hydrocarbon Heat To validate that our fuel cell category can be correctly identified in the future, we look at categorization metrics in the exchanger hydrocarbon heat category table view.
Figure 11: Classification Metrics for Fuel Cell
Figure 9: Summary of Selected Example The user determines that this is indeed a fuel cell example and moves it accordingly to the appropriate class by clicking on the “Move One Example” button. Next we need to place our new category in the appropriate context of the taxonomy as a whole. In the Categorization Tree view we drag and drop the “fuel cell” category into the “exchanger hydrocarbon heat” folder. This subcategory of documents was previously reclustered using the centroid-based k-means algorithm [6] [10]. The new category “fuel cell” is inserted, and new centroid is added to the clustering. Of course, since this is a user directed modification, there is no guarantee that each document will remain closest to the centroid of its cluster. Further validation is therefore recommended.
At this level of the taxonomy, it appears that the ‘fuel cell’ category can be accurately modeled by a centroid based classifier. Further study would also be necessary at other levels of the taxonomy to insure that the corresponding changes made at those levels could also be modeled with one or more classification approach. This scenario shows the power of eClassifier in allowing the user to validate that his intuitive idea of the fuel cell category was correct, and to find other variations on the concept (“electrochemical cell”) which might also be valid. This scenario illustrates how eClassifier can be used to modify a taxonomy to efficiently incorporate human domain knowledge. Each change the user makes can then be validated to insure that it can be accurately modeled in the future.
6
CONCLUSIONS
Typically users of the Lotus Discovery Server had reported that the time it took to edit the initial taxonomy to create a suitably natural document categorization was on the order of two weeks, for documents sets of 20,000 examples and taxonomies of 200 categories. Using the eClassifier tool in the lab, we have been able to create natural taxonomies in domains of equal or greater complexity with typically two days of effort. This order of magnitude improvement in "time-to-taxonomy" is the result of 1) applying advanced Summarization and Visualization techniques to communicate the taxonomy content in a more effective way, 2) providing powerful editing tools to allow the expert user to make desired changes, 3) the availability of easyto-use validation tools to insure that the edited taxonomy is model-able from the available feature data. While such improvements are difficult to quantify directly in the field (because user's are not willing to create a taxonomy twice using different, competing approaches) we do plan to monitor the use of eClassifier in the Lotus Discovery Server to verify that the time-to-taxonomy is indeed decreasing as much as we anticipate. In summary, we have described in detail a system with a unique combination of capabilities for the generation of practical quality taxonomies. We have shown that the combination of internal and external criteria integrated in an interactive platform provide a practical way to create natural taxonomies in a broad range of domains. We believe there are many other practical aspects of taxonomy generation and utilization that are not well covered in the literature. One such issue is the generation of multiple taxonomies over a single collection of documents [14]. This will enable applications to leverage multiple attributes and relationships of a collection of documents. Another area we believe to be a promising area for future work, will be the integration of taxonomies and text with structured and semistructured data.
7
ACKNOWLEDGEMENTS
The authors gratefully acknowledge Dharmendra Modha and Ray Strong for their contributions to the original design of eClassifier; Iris Eiron and Justin Lessler for integrating eClassifier with the Lotus Discovery Server API; Wendi Pohs and Cynthia Regnante for their input on features and functionality of the eClassifier user interface; and Norm Pass and Bill Cody for initiating the eClassifier and eClassifier for Lotus Discovery Server projects.
8
REFERENCES
[1] Berry, J. and Linoff, G., (1996) Data Mining Techniques for Marketing, Sales, and Customer Support. John Willey & Sons, Inc. [2] Brachman, R. and Anand T. (1996). The Process of Knowledge Discovery in Databases. In Fayyad, U.M., Piatetsky-Shapiro, G., Smyth, P., and Uthurusamy, R., editors, Advances in Knowledge Discovery and Data Mining, Chapter 2, pages 37-58. AAAI/MIT press. [3] Dhillon, I., Modha, D., and Spangler, S. (1998). Visualizing Class Structures of Multi-Dimensional Data. Proceedings of
30th Conference on Interface, Computer Science and Statistics. May 1998. [4] Dom, B. (2001) "An Information-Theoretic External ClusterValidity Measure", IBM Research Report RJ 10219, 10/5/2001 [5] Duda, R. O. and Hart, P. E. (1973). Pattern Classification and Scene Analysis. Wiley. [6] Hartigan, J. A. (1975) Clustering Algorithms. Wiley. [7] Halkidi, M., Batistakis, Y. Vazirgiannis, M. (2001) On Clustering Validation Techniques. Journal of Intelligent Information Systems 17(2-3): 107-145. [8] Jing, H., Barzilay, R., McKeown, K., and Elhadad, M. (1998) Summarization evaluation methods experiments and analysis. In AAAI Intelligent Text Summarization Workshop (Stanford, CA, Mar. 1998), pp. 60--68. [9] Pohs, W. (2001). Practical Knowledge Management – The Lotus Discovery Server System, IBM Press. 2001. [10] Rasmussen, E. (1992). Clustering algorithms. In Frakes, W. B. and Baeza-Yates, R., editors, Information Retrieval: Data Structures and Algorithms, pages 419-442. Prentice Hall, Englewood Cliffs, New Jersey. [11] Quinlan, J.R. (1986) Induction of Decision Trees. Machine Learning 1 (1):81-106. [12] Salton, G. and Buckley, C. (1988). Term-weighting approaches in automatic text retrieval. Information Processing & Management, 4(5):512:523. [13] Salton, G. and McGill, M. J. (1983). Introduction to Modern Retrieval. McGraw-Hill Book Company. [14] Spangler, S., Kreulen, J., Lessler, J. (2002). Mindmap: Utilizing Multiple Taxonomies and Visualization to Understand a Document Collection. Procedings of the 35th Anuual Hawaii International Conference on System Sciences (HICSS-2002). [15] Vaithyanathan S. and Dom B. (2000) Model-Based Hierarchical Clustering. The Sixteenth Conference on Uncertainty in Artificial Intelligence (UAI-2000) [16] Vaithyanathan S. and Dom B. (2000) Hierarchical Unsupervised Learning. The Seventeenth International Conference on Machine Learning (ICML-2000). [17] Vaithyanathan S. and Dom B (1999). Model Selection in Unsupervised Learning With Applications To Document Clustering. The Sixteenth International Conference on Machine Learning (ICML-99) Proceedings Published by Morgan Kaufman. [18] Witten, I. H., Frank E., (2000) Data Mining: Pracitcal Tools and Techniques with Java Implementations, Morgan Kaufman, pp. 82-89.