The second prototype is MOBUM, a model building tool that support learners ... the Internet, communicate and collaborate with each other (using email and chat-rooms), and ...... E.g. http://www.swi.psy.uva.nl/projects/GARP/index.html.
Interactive Model Building Environments
Anders Bouwer, Vania Bessa Machado and Bert Bredeweg
Social Science Informatics (SWI) University of Amsterdam (UvA) Roetersstraat 15 1018 WB Amsterdam The Netherlands
Email: {anders, vania, bert}@swi.psy.uva.nl
Acknowledgements We would like to thank Joost Breuker and Bob Wielinga for their support and comments on the research presented in the article.
-1-
Abstract
Interactive model building environments are educational software systems which support scientific investigation by allowing students to build models and experiment with them. The basic idea is that students use the model building environment to construct their own models of scientific phenomena, which the computer can use to run simulations, thereby providing predictions and causal explanations. The models are qualitative models, which explicitly represent the domain knowledge required for causal reasoning about system structure and behavior. If a valid model has been constructed or assembled, a simulation can be started, and its progress is controlled by the student. To communicate the contents of the model and the simulation results, these are represented graphically as state-transition diagrams, causal networks, structural hierarchies, tables and graphs. Students can navigate through these interactive visualizations to get an overview, check specific predictions, search for explanations, investigate trends and look into details of the simulation. In this way, model building environments can support two learning goals: learning how to model scientific phenomena, and learning by making and checking predictions and explanations with the simulation model. Since the approach taken is domain-independent, the same model-building environment can be used for domains varying from ecology to physics. This article discusses two parts of such a model building environment that have been implemented as separate prototypes. One prototype is VISIGARP, a model inspection tool that supports learners in controlling and investigating simulation models. The second prototype is MOBUM, a model building tool that support learners in constructing simulation models. Integration of both types of systems will lead towards fully interactive model building environments, allowing students to participate in the process of scientific investigation to a larger extent than traditionally possible.
-2-
1. Introduction
Computers are becoming increasingly important as tools for articulating and communicating information and knowledge. At the same time theories on human learning strengthen the hypothesis that learning is an active process during which knowledge is constructed1 as opposed to just 'received' via some communication channel (Fiske, 1990). This article combines both these themes as it discusses the notion of interactive model building environments. Two aspects are of prime interest to the work presented. First, the development of model building tools that support learners in articulating their understanding of the (physical) reality in a 'machine readable' form. Second, for the computer, how to use this knowledge, what inferences to make, and how to communicate the results back to its users.
Usage of computers in modern educational settings is often limited to data storage, retrieval and presentation means. Take for instance an average science project. Typically, learners will search the Internet, communicate and collaborate with each other (using email and chat-rooms), and write, possibly as a group, a document that describes the phenomenon they have been studying. Although by itself this is an interesting development, it does by no means exploit the full potential of modern computers. The problem is that computers can only process the information units, manipulated by the learners, from a technical point of view. That is, the computer can transport a collection of bits over the Internet, use it to drive a visualization on the screen, provide tools for the user to modify it, and so forth. But the computer cannot access the content (or knowledge) captured by these units, because the computer does not have a formal, knowledge level (Newell, 1982), representation of this content. As a result, computers cannot be used as 'knowledgeable agents' to support the learner with the knowledge construction process. This is undesirable, because guidance is one of the most important requirements for effective learning (e.g., ElsomCook, 1990; Hulst, 1996).
1
(See footnote 1).
-3-
In our research we use artificial intelligence technology to develop an interactive model building environment by means of which students can learn by constructing simulation models. We want to use the computer as an intelligent agent (e.g. Bradshaw, 1997), knowledgeable about the domain, and the model building process, and therefore capable of providing support. Our work combines three strands of research: simulation-based learning, qualitative reasoning, and learning by building models. Simulation is a powerful tool for learning, because it allows us to mimic (model) reality in a way that is optimized for specific tutoring goals (e.g. Jong, 1991). For instance, some scientific phenomena are difficult to witness in reality and hard to replicate in a physical experiment, but can be simulated by a computer model. This is particularly true for processes that have a large time scale (e.g. ecology) or a very short time scale (e.g. chemistry). Second, the simulation models we use are qualitative (e.g. Weld & Kleer, 1990). The ontology underlying such models provides a rich vocabulary for reasoning about system structure and behavior. This allows not only inspecting simulation results, but also searching for causal explanations. Third, learning by modeling is based on the idea that scientific phenomena are better understood when one tries to make explicit one’s understanding into a format which can be communicated to others. Choosing the right abstractions, making the right assumptions, and capturing those aspects of structure and behavior that matter are the skills necessary to build a good model (e.g. Bental & Brna, 1995). This model construction can be done using a computer as an articulation device which, among other things, allows running simulations for inspecting the status of the model. The model and its simulation results can also be communicated to other learners, e.g. by using the Internet.
2. Learning and simulation models
This section elaborates on the idea of using interactive simulations as tools for humans to learn about systems and their behavior. First, the basic idea behind this approach is presented. Second, requirements are formulated with respect to the kind of insights learners should acquire. Third, the need for knowledge-based simulation models to address these requirements is emphasized.
-4-
Fourth, qualitative models are briefly discussed. Finally, different ways of interacting with simulations are pointed out.
The basic idea
When interacting with the physical world people often perform tasks to manipulate systems and their behavior. Typically this involves three classes of tasks: controlling the behavior of existing systems, constructing new systems with new behavior, and repairing broken or malfunctioning systems. The specific nature of these tasks can be further detailed by taking into account the kind of domain a system belongs to (e.g. physics, ecology, and medicine) and whether a system is an artifact or a natural system. For humans, who in general have to perform at least some of these tasks, it is necessary to learn what kind of systems exist and how they behave. Computers provide interesting opportunities to act as intelligent agents capable of teaching humans important parts of that knowledge (figure 1).
[Insert figure 1 here]
In order to construct such computer-based 'knowledgeable agents' two aspects are crucial. First, the computer should be equipped with models (possibly simulations) that capture the behavioral aspects relevant to the system that is subject of teaching. These models should be detailed and explicit with respect to the phenomena that must be learned by the learner. To stress the notion of being explicit and sufficiently detailed, these models are often referred to as 'articulate' simulation models (Bredeweg & Winkels, 1998; Falkenhainer & Forbus, 1991; Koning et al., 2000). Second, the computer should have means to communicate the details captured by these models to learners. However, it is usually not sufficient to 'just show' the results generated by running a simulation. It is well known that without sufficient guidance, learners may spend lots of time without learning much. Some coaching, such as helping to focus an exploration, providing accurate summaries, giving assignments, or providing explanations is therefore essential (e.g. Elsom-Cook, 1990; Hulst, 1996; Twidale, 1993).
-5-
What do students have to learn?
Following projects such as STEAMER (Hollan et al., 1987), QUEST (White & Frederiksen, 1990), and ITSIE (e.g. Sime, 1994), we take the approach that learning proceeds in steps. When learning, humans first acquire insights in the functioning of partial systems. Further learning elaborates these insights or focuses on other partial systems. Learning also modifies and integrates insights in order to accommodate for different perspectives and levels of abstraction. However, exactly understanding how humans learn is still subject of current research2. What we do know is 'what learners have to learn'. That is, the requirements that should be fulfilled in order to have the insights that are needed to effectively interact with systems and their behavior. The following issues can be pointed out in this respect:
•
Prediction and post-diction (of behavior)
•
Deriving behavior from structure
•
Perspectives and assumptions
•
Causal accounts
•
Reusability
Central to these requirements is the notion of 'behavior analysis' (figure 2), or more specifically 'prediction' and 'post-diction' of system behavior (e.g. Forbus, 1984).
[Insert figure 2 here]
As argued by Breuker and Velde (1994), behavior analysis is an important subtask within many tasks dealing with systems and their behavior, such as designing, planning, monitoring and diagnosis. Behavior analysis starts with 'deriving behavior from structure' (e.g. Kleer & Brown, 1984), which refers to the ability of associating behavioral features to structural constellations. There is often not a single mapping between a particular structural unit and its behavior.
2
(See footnote 2).
-6-
Repairing a broken traffic light system requires a different behavior analysis than deciding on whether, and how, to cross the street with that broken traffic light system. Moreover, the structural units that are identified and taken into account may be different. In general, an appropriate behavior analysis depends on the tasks and the goals of the humans involved. In computer programs this flexibility in reasoning about system behavior is often implemented by using the idea of 'assumptions' (e.g. Falkenhainer & Forbus, 1991; Rickel & Porter, 1997; Sime & Leitch, 1992). Another important aspect of behavior analysis concerns 'causal accounts'. The insights that humans learn should identify the quantities that are most crucial for the typical behavior of the system and specify how they are related, that is, understand how these quantities affect each other and thus explain the overall behavior of the system. Finally, there is the issue of reusability. The insights that humans learn should be applicable to a wide range of situations and not only to some specific structural constellation. The insights should be domain independent, or at least to a certain extent. The concept of 'friction', for instance, applies to all kinds of systems that move from one place to another.
Simulations as knowledge models
Mathematical models are important building blocks for modern science. Also in educational settings teachers often use such models to explain the behavior of systems, particularly at university level. Given the increasing computational power of computers a logical next step was to use mathematical models as interactive models that allow learners to learn about real-world phenomena simulated by these models. The usefulness of this approach in educational settings has been pointed out by many authors and powerful software tools are available to support teachers in this respect, e.g. MATLAB (Pratap, 1999), STELLA (Grant, 1997) and SIMQUEST (e.g. Kuyper, 1998). However, when it comes to interactive learning environments, in which certain tutoring activities are automated, mathematical models are not always sufficient. For instance, precise information may be missing and therefore numerical simulation not possible. Other problems relate to explanation and subsequent knowledge communication issues relevant to the interaction between learner and environment (Wenger, 1987). Also, mathematical models
-7-
require considerable knowledge of mathematics and as a result are usually not suitable for secondary school curricula. Coping with the previously mentioned problems was one of the driving forces behind research on qualitative reasoning (Bobrow, 1984; Weld & Kleer, 1990). For generating explanations the idea of articulate simulation models (or knowledge models) became important (e.g. Winkels & Bredeweg, 1998)3, but also the problem of simulating without precise information is seen as an important goal of qualitative reasoning (e.g. Kleer & Williams, 1991).
Maybe even more interesting than using qualitative knowledge to overcome the limitations of mathematical simulations, is the use of qualitative models for their own sake. That is, qualitative models have characteristics that make them particularly suited to address specific learning activities. For instance, when teaching to solve physics problems, teachers emphasize the need for learners to first understand the (problem) situation. Before trying to apply equations, learners should build a conceptual model (e.g. Mettes & Roossink, 1981) of the initial-state, the end-state, and the possible transition trajectories between the two. In fact, it is considered naïve (beginners behavior) if learners jump to 'applying formulae' without making a proper analysis of the problem situation (e.g. Elio & Sharf, 1990). Expert problem solvers excel because they spend a significant amount of time on making a conceptual model before using equations. Analyzing (problem) situations is close to the idea of making an envisionment, that is, a mental simulation of what happens, or may happen (Kleer & Brown, 1984).
Qualitative models are also relevant in specific domains (often less formalized) where domain experts try to uncover the causal dependencies that govern a system's behavior. After understanding the causal dependencies the experts may try to apply the formulae that are appropriate for the system. In fact, the causal model helps them to find the appropriate equations. Experts often don't even bother about the equations. Instead, developing a conceptual model is a goal in itself, that is: discovering the physical constituents of the system, identifying the relevant quantities, and understanding how these interact in determining the system's behavior. Qualitative models are well suited to help domain experts in articulating and formalizing their insights (e.g.
3
(See footnote 3).
-8-
Salles, 1997). If we think of how this kind of knowledge can be communicated to (new) trainees in the field, qualitative models are again crucial.
Qualitative models
As argued above, qualitative models should be seen as knowledge models of systems and their behavior. For technical details of such models, see Bobrow (1984) and Weld & Kleer (1990). In our research we use GARP (Bredeweg, 1992), a simulator written in SWI-Prolog. GARP takes as input a scenario and generates a graph of qualitative distinct behaviors for the situation described in that scenario. GARP uses model fragments and transition rules to construct this graph. Model fragments have conditions and consequences. If the conditions match the scenario, and are consistent with other model fragments that match the scenario, they are added to the state of behavior. States of behavior transform into successor states when inequalities between quantities change or when quantities reach a different value in their quantity space. Such changes are the result of influences introduced by model fragments (of type 'process' and 'agent'). These influences propagate via proportionalities and affect the derivatives of quantities. In other words, they change the quantities and this is modeled as derivatives being positive or negative. Quantity spaces represent the values that quantities can have. Each quantity has a unique quantity space. A quantity space captures the relevant distinctions for a quantity, such as the temperature of a substance being below, at, or above the boiling point. When developing a simulation model in GARP, a model fragment is often used to represent a particular concept relevant to the domain that is modeled, for instance: a population (ecology), a heat-flow (thermodynamics), or a pressure-area (meteorology).
How to interact with simulation models?
If students learn by using simulation models, what kind of interaction styles between learners and such models should be established? We distinguish three major categories, and refer to them as: assignment-based, assembling-from-library, and self-building. The difference between these
-9-
categories relates to the status of the simulation model the learner interacts with. Assignmentbased is probably the default approach when thinking about simulation-based learning (e.g. ITSIE, Sime, 1994, and SIMQUEST, Kuyper, 1998). There are many forms of the assignmentbased approach, but they all have in common that the simulation is not made by the learner. Instead, the model is built by the developers of the interactive simulation and the learner can only interact with the simulation. This interaction can then take many specific forms (see e.g. Jong, 1991), such as answering prediction questions, controlling the simulation (as in a flight simulator), setting up experiments and discovering what happens, finding explanations for observed behaviors, and many more. The idea is that by interacting with the simulation, possibly taking into account a set of assignments, a learner will eventually understand the behavioral insights captured by the simulation and thus understand the real system's behavior (or at least partly).
A somewhat different approach could be called 'assembling-from-library'. In this case, the simulation is not fully available, but has to be assembled by the learner. Typically the learner is given a library of partial models or components, e.g. as a set of icons on the screen, from which he/she has to select the ones relevant to the situation (scenario) for which a model has to be constructed (e.g. CYCLEPAD, Forbus et al., 1999). Selecting and connecting the parts is not always enough to get a simulation running adequately. Often learners have to provide additional detail, such as initial values, value-range limits and possibly modes of operation in the case of components. Also remodeling the initially selected set of partial models may be necessary when the model does not produce the desired behavior results. Notice that the assembling-from-library approach is a kind of design task, a design task where all the building blocks, from which designs can be made, are predefined. Also notice that this approach can easily be augmented with ideas from the assignment-based approach. For instance, providing a 'hypothesis scratch-pad' to help the learner with organizing his/her ideas concerning behavioral features captured by the partial models and their interactions (e.g., Joolingen & Jong, 1991).
The third approach is probably the most difficult one from a learning perspective. In the case of self-building the learner has to build the simulation by himself/herself and by doing so acquire the
- 10 -
insights relevant to the system's behavior. Obviously, a learner needs to master a considerable amount of detail of the real system's behavior in order to build an adequate simulation model. Typically the self-building approach starts with a model building tool (e.g. STELLA) which can be used to construct a model. These building blocks differ from the ones in the assembling-fromlibrary approach in that they are much finer grained and usually domain-independent. They refer to concepts used in science and science teaching (in fact, theoretical constructs) to model a wide range of systems (e.g. System Dynamics). Often the language underlying these concepts has a close relation to mathematics, particularly with differential equations. The self-building approach is mostly used in higher education, such as universities. When building a model, learners have to perform important but difficult abstraction steps in order to map the real system's behavior onto the building blocks provided by the model building tool that is used. Building a model also includes filling out many technical details in terms of the underlying mathematical equations. Depending on the tool, parts of this process may be automated.
In our approach we use both the assignment-based and the self-building approach. The VISIGARP tool, described in section 3, is primarily meant as a tool for inspecting qualitative simulations, e.g. for solving assignments. MOBUM, on the other hand, embodies the self-building approach. MOBUM is described in section 4. One of our plans for future research is to fully integrate a tool like VISIGARP with MOBUM in order to actively support learners in building simulation models. Finally, notice that in contrast to most of the simulations referred to above, we use qualitative models. We focus on learners who have to learn knowledge models of systems and their behavior.
3. Communicating model contents and simulation results
How to communicate the contents of qualitative simulation models to a user? The output generated by the GARP simulation engine consists of a large amount of complex propositional statements in Prolog code format, which is hard to read, search, and oversee, except for experienced knowledge engineers. Therefore, we have designed a tool, VISIGARP, which
- 11 -
supports investigation of the simulation model and results. VISIGARP offers a number of views, each of which focuses on certain kinds of information, while using others to form the context, or to provide links to more detailed information. Because the knowledge is highly structured and cannot be captured easily in linear text, we mainly use graphical representations, such as block diagrams, trees and graphs. These visualizations make structural aspects of knowledge explicit, which can facilitate internalization of complex concepts. Our visualization ontology consists of circular, rectangular and oval shapes of variable sizes for different kinds of entities, and lines, arrows, inclusion, ordering, and indentation for different kinds of relations. Since our approach is generic and does not use domain-specific pictures or symbols, text labels are used to denote specific entities and relation types. For each view, we have designed a mapping from the ontology of qualitative simulation to the ontology of visualization primitives, to facilitate specific reasoning tasks (identifying, searching, counting, associating, and sequencing) and interaction types (reading, selecting, dragging, resizing, etc). Multiple views can be opened simultaneously, allowing users to navigate between global overviews and more detailed descriptions and to switch between different types of reasoning.
Components of the model
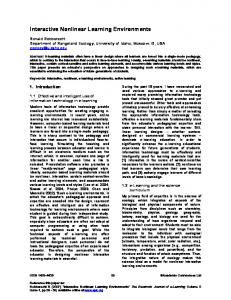
VISIGARP offers views for all types of components of the simulation model: the entityrelationship graph, the causal model (or dependency graph), the is-a hierarchy of entities, and three different views on model fragments. The entity- relationship graph (see figure 3) shows the instances of system elements as labeled rectangles; relationship between entities are shown as labeled arcs. This view is deliberately kept simple, which makes it useful as a graphical introduction to the system model. The is-a hierarchy (also shown in figure 3) is a separate view, showing subtype relationships in a left-to-right tree format. Since the hierarchies are usually wider than they are deep (in terms of nesting), and there are often multiple branches with long strings as labels, a top-to-bottom format would very soon take too much space along the horizontal dimension. The levels below a certain entity node can be collapsed and opened up again by clicking on it, to allow viewing at different levels of generality.
- 12 -
[Insert figure 3 here]
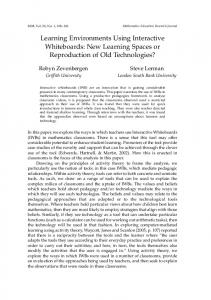
A more detailed view, including also aspects of system behavior, is offered in the causal model, or dependency graph. Figure 4 shows a screenshot of the causal model for state 1 in a simulation of the Brazilian Cerrado vegetation with three populations (grass, shrubs and trees), and fires. In the diagram, all quantities are shown, together with the dependencies between quantities, between quantity values, and quantity derivatives. As shown, all quantities belonging to the same entity are grouped together within the block representing that entity. This facilitates recognition of dependencies within subsystems, and dependencies crossing subsystem borders. Radio-buttons are supplied alongside the diagram which can be turned on or off to show or hide specific types of information. This way, also the value, the quantity space and the derivative of quantities can be shown. If turned on, the quantity space is displayed within the quantity node in vertical orientation, with the current value highlighted and an arrow beside it, indicating increase or decrease. In addition, it is possible to show or hide the entities and relationship to clarify the system structure.
[Insert figure 4 here]
To investigate the role of the different model fragments during a simulation, a view is supplied which lists all model fragments which apply in a particular state (see figure 5). Such a list gives a high-level overview of what is true, and what is happening in that state. A model fragment can be selected, and more details can be requested in a structured text format, or a graphic format based on the causal model view, with color used to highlight the contents of the specific model fragment. This gives an overview of the context while drawing special attention to the specific knowledge introduced by that model fragment.
It is also possible to view how the different model fragments are structurally related to each other in the model library. Two views (not shown in this paper) are supplied for this purpose: the is-a hierarchy of model fragments, which shows the hierarchical subtype-relationships between model
- 13 -
fragments, and the applies-to hierarchy, that shows which model fragments are conditional for which other model fragments. In both views, a model fragment can be selected for further inspection.
Because this kind of knowledge is a bit more abstract than the kinds described previously, it should not be used before students have had some experience with the more concrete aspects of the simulation model. It is especially useful, however, for the system modeler, or students learning to model.
[Insert figure 5 here]
Running the simulation
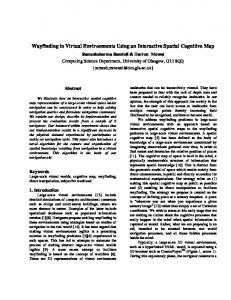
Running a simulation leads to processes becoming active or inactive, quantity values changing, and qualitative states terminating and transforming. The behavior graph, or state-transition graph, shows an overview of the progress of the simulation in terms of states and state transitions (see figure 6). Alongside the diagram, buttons are provided to control the simulation: a state can be selected to pursue the simulation in one direction only, or, alternatively, all branches can be pursued until no further progress is possible (the Full Simulation button). Terminations, which have not (yet) resulted in a state transition, are shown as tiny circles, connected to their originating state. States, terminations and transitions can be investigated in more detail by selecting them and clicking one of the other view buttons. When two or more states are selected in Path-mode, a path through these states (if one exists) is automatically selected. This is especially useful for the transition history and the quantity value history views, since they show behavioral aspects of multiple transitions/states in a single screen.
The transition history button pops up a small screen with a short textual description of all terminations/transitions in the selected path, or connected to the selected states (partly visible in figure 6). This gives a brief overview of all events that triggered a state transition. A more
- 14 -
detailed description of individual terminations is also available by selecting one in the popup window. In the quantity value history view (the foremost window in figure 6), quantities can be selected from a list – when selected, the values of this quantity will be plotted over time (the sequence of states selected in the behavior graph).
[Insert figure 6 here]
Like a traditional x-y graph that plots a dependent variable against time, a graph format is used with the quantity space on the y-axis, and the state sequence on the x-axis. Point values are plotted on horizontal lines indicating specific value points, whereas interval values are plotted between two lines, corresponding to the values bordering the interval. Note that connecting these points to form a line-graph would suggest too much, because the exact slope of ascent/descent within intervals is unknown in our qualitative simulation framework.
Working with visualizations of qualitative simulations
One of the educational goals that can be supported by VISIGARP is learning to make predictions and to test their accuracy. Given a certain simulation scenario starting state (including a structural description of the system and the causal dependencies between its quantities), a possible exercise is to predict the possible changes of one or more quantities, and in what order they might occur. In order to test the hypothesis, the student can run a complete simulation – the simulation engine then produces all possible successor states, including alternative branches when the situation is underdetermined. By looking at the state transitions, and the order in which they occur in the behavior graph, the student can test the accuracy of his/her predictions. A common mistake is to consider only one, or a few possibilities, when in fact under-determination leads to multiple branches – hence unforeseen results.
In addition to making and testing predictions, the system also supports the search for explanations for particular results of the simulation. For example, if state 12 (which may be an end state, or
- 15 -
intermediate state) of the simulation shows that a certain population dies out (number-of = zero), the student may be asked to find out how this can have happened. This forces the student to trace back from state 7 (there may be multiple paths leading there) to earlier states to check for statetransitions and other differences that may have occurred. To find out why a certain state transition occurred, the student will have to look into the causal model for the originating state to find out how all quantities involved are related to each other. Contrary to events in the real world, events happening in the simulation can always be traced back to a starting state, providing at least a kernel for explanation.
It is important to note that the figures generated by our system do not contain domain-specific symbols or pictorial representations. One may argue that this is a weak point, since it may be hard for students, especially novices, to relate the model to reality. Other work in simulation-based learning has incorporated domain-specific symbols, icons, or pictures to help students understand the correspondence between the model and the system modeled (e.g., Forbus et al., 1999; Kuyper, 1998). Nevertheless, due to their flexibility, more abstract representations can actually provide advantages, as research in diagrammatic reasoning indicates (e.g. Kulpa, 1994). After a learning phase, students can directly read off characteristics of the simulation, by looking at the diagrams. This way, they can find out whether there is ambiguity in the simulation or a feedback loop in the causal model, for example. Also, an overall estimation of complexity and relative importance can be given by just glancing at the diagram layout: a diagram with lots of lines going back and forth suggests a complex system; clutter around a certain quantity may suggest that it serves an important role in the system. These kinds of reasoning with diagrams can prove very useful, because they go beyond the possibilities of text as a medium for knowledge communication.
It is also important to note that the diagrams in our system are created at the moment a student wants to see it, in the context he/she has chosen interactively. They can be extended and modified at the student’s will, within the scope of the current interface options: adding extra details, extending behavior paths, highlighting fragments, modifying the layout. This may well lead the students to see that diagrams are not necessarily static figures (as is the case in books), but external representations with which you can interact to facilitate reasoning. Furthermore, once
- 16 -
students learn to use abstract representations in one domain, knowledge of how to use them can be transferred to other domains. When the goal is not only to learn about a specific domain, but also to learn more general skills, like learning to model scientific phenomena, abstract representations are even necessary.
Current status and future work
VISIGARP is implemented in SWI-Prolog/XPCE (Wielemaker & Anjewierden, 1992). Other members of our group have implemented some of these ideas on visualization in JAVA4. All figures in the screenshots in this section were automatically generated by VISIGARP, using a large simulation model developed for GARP by Salles and Bredeweg (1997). This mechanism works for any GARP model in any domain, e.g., a piston system with a heat-flow, a balance system with a liquid flow (Koning, 1997), and the ecology of Brazilian Cerrado populations with different growth and migration processes (Salles, 1997). Preliminary evaluation with twenty-five undergraduate students has shown that these subjects can use VisiGarp to help them complete exercises asking for simple qualitative knowledge in a domain unfamiliar to them (for details can see Bouwer & Bredeweg, 2001). However, reasonably large models (such as the Brazilian Cerrado ecology model employed in this study) can still lead to complex diagrams, with suboptimal layout. Possible improvements to the system are smarter layout algorithms, or alternative browsing techniques (e.g. automatic zooming or hyperbolic browsing). However, a more promising direction we are investigating is to automatically select and abstract the most interesting aspects of the simulation model, before visualization. For example, it can be helpful to show the most important values in every state in a state-transition graph, or to show the important differences between two states in terms of model fragments. For the automatic realization of such support we can build on research dealing with aggregation and abstraction mechanisms (e.g., Koning et al., 2000; Mallory et al., 1996). A third avenue for further work we are pursuing addresses the question of how to enhance the graphics with textual explanations, and how the visualizations can be used in a dialogue between system and student. Automating these processes
4
(See footnote 4).
- 17 -
may benefit from work in multimedia generation, e.g., by Mittal et al. (1998), who are generating figures and their captions automatically, and Wahlster et al. (1993), who focus on planning a complete interactive presentation. Also, research on automated explanatory dialogue may prove useful in this respect, e.g., by Moore (1995) and Pilkington & Grierson (1996).
5. Learning by building models
As has been argued in section 2, building a model can also be a learning experience. Enabling this type of learning requires adequate model building environments. One of the main bottlenecks in the construction of knowledge models is the absence of easy-to-use, domain-independent tools to support the average learner in the realization of complete and manageable models. To address this problem we have implemented a prototype, MOBUM, which allows users to interactively build qualitative simulation models. This section discusses the details relevant to the construction of this tool.
Constraints for the design of workspaces
Building a simulation model is a complex activity that involves many tasks, subtasks and interdependencies between tasks (e.g. Schut and Bredeweg, 1996). An important issue therefore concerns the decomposition of this overall activity into smaller parts that can be performed more or less independent from each other. These parts can thus be supported by separate, and possibly dedicated, interface constructs (referred to as workspaces). As a starting point we used the simulation model ontology on which GARP is based (Bredeweg, 1992) and remodeled it using an object oriented approach. A summary of this model is shown in figure 7.
[Insert figure 7 here]
Without going into all the details, notice that the system model (that is the simulation model as a whole) consists of a hierarchy of model fragments, a hierarchy of entities, a scenario, quantity
- 18 -
spaces and rules5. Both model fragments and scenario use 'descriptions', which implies that the latter have to exist (or have to be created) when creating a model fragment or a scenario. Entities and quantity spaces, on the other hand, do not use other model parts (but they are used as inputs when creating other model parts).
Description is a model construct used to group sets of model parts that are reused in other model parts. Although not shown in figure 7, it turns out that these description parts are highly interrelated. For instance, a quantity always belongs to an entity, an attribute always exists between two instances, a proportionality always exists between two quantities, etc. Moreover, the specific descriptions that a learner may want to formulate always depend on the specific model fragment he/she is constructing. For instance, a liquid-flow process between two containers should only become active when those two containers exist, are filled with an amount of liquid, have unequal pressures and are connected by a pipe that facilitates the flow (see also figure 10). Putting these insights together and making them available under the correct conditions is precisely what constructing a model fragment is all about. It is therefore necessary (i.e., logical) to have the interface facilities, for creating the descriptions, available in the context of creating a model fragment.
Constraints such as the ones discussed above have resulted in defining four builders (main workspaces) and sets of tools that are available within each workspace. Table 1 enumerates the builders that exist in MOBUM.
Table 1: Learner workspaces in MOBUM Entity Builder
In this workspace the learner models the (physical) objects that represent the domain. The hierarchical relationships between these objects will be modeled here as well.
Scenario Builder
In this workspace the learner defines the situations that can be simulated. Notice that by definition this can only be a 'selection' of
5
(See footnote 5).
- 19 -
the model parts defined elsewhere in the model. For instance, there is no point in specifying an entity in a scenario that is not used in any model fragment. Model Fragment Builder
In this workspace the learner constructs the knowledge about the behavior of entities. This includes the specification of features of instances, such as quantities, the values these have, and the dependencies that exist between the quantities.
Quantity Space Builder
In this workspace the learner creates an ordered set of quantity values that quantities may have. These values are a sequence of alternating points and intervals.
Tools exist for creating, modifying and organizing the model parts (mainly the descriptions in figure 7) within each builder6. For instance, within the model-fragment builder the following tools exist (see also figure 10, column on the right, read from top to bottom):
1.
Pointer tool (move icons on the screen with the workspace),
2.
Instance tool (add entities to the workspace),
3.
Modify tool (e.g. change a name),
4.
Delete tool (permanently remove something from the workspace),
5.
Attribute tool (make structural relations between entities, e.g. container contains a liquid),
6.
Quantity tool (add a quantity to an entity)
7.
Influence tool (define an influence constraint between two quantities)
8.
Proportionality tool (define a proportionality constraint between two quantities)
9.
Correspondence tool (define a correspondence constraint between two quantities)
10. Inequality tool (define an (in)equality constraint between two quantities) 11. Reuse model fragment tool (add an already defined model fragment as a condition) 12. Reuse instances tool (reuse parts of a conditional model fragment in order to further refine)
6
(See footnote 6).
- 20 -
Notice that most of these tools are also available in the other builders, such as the quantity tool in the scenario builder (in fact, the tools 1, 2, 3, 4, 5 and 6 from the above list are available within the scenario builder).
To further constrain the design of MOBUM we used the notion of task analysis (e.g. Preece et al., 1994, see also figure 8). Mainly by detailing each of the subtasks within a workspace in terms of inputs-outputs, and thus their relative order, an additional set of requirements and constraints emerged.
[Insert figure 8 here]
Input-output dependencies determine whether a subtask can be performed and thus can be used to govern the availability of tools within a workspace. For instance, the quantity tool cannot be used unless at least one instance has been added to the workspace of the model fragment being built (and before that the learner must have created the entity as an element in the entity builder). Table 2 enumerates the minimum requirements for using a tool within the model fragment builder.
Table 2: Minimum requirements for using a tool in the model fragment builder. Instance tool
One entity must have been created (in entity builder)
Attribute tool
Two instances must exist (in workspace)
Quantity tool
One instance must exist (in workspace)
Influence tool
Two quantities must exist (as consequence in the workspace)
Proportionality tool
Two quantities must exist (as consequence in the workspace)
Correspondence tool
Two quantities must exist (as consequence in the workspace)
Inequality tool
Two quantities must exist (in workspace)
Reuse model fragment tool
Other model fragment must have been created (with MF builder)
Reuse instances
A reused model fragment must exist (in workspace)
- 21 -
When these basic requirements are fulfilled (and at least one tool can be used) the input-output dependencies within the subtask, supported by that tool, can be used to determine whether the learner has performed the task correctly or at least sufficiently (that is, syntactically speaking). For instance, within the quantity tool the learner always has to select the instance to which the new quantity must be applied. The task is not sufficiently completed without that information and thus closing the task should be made impossible (of course, it can be cancelled). On the other hand, some information may not be crucial yet. For instance, the quantity space of a quantity may be added later. For each tool, the minimum required steps have been identified. They have been used in the design of the tools within MOBUM to support the learner in always performing the task to a sufficiently complete level.
User interface design
The overall user interface design for the MOBUM environment starts with the notion of builders and tools. Tools are displayed on the right side of the screen and automatically change when the learner chooses to work with a different builder (i.e., workspace). Opening a builder can be done by clicking on the icons in the main toolbar, at the top of the overall interface. Builders can also be opened using the menu options. Multiple builders can be opened, but only one tool can be active. Although from a technical point of view multiple tools can be provided, the idea is that it is better to support learners in performing focussed model building steps. Allowing only one tool to be active forces learners to first finish this task, or cancel it, before moving on to the next. Having multiple builders open is essential, because next to supporting a model building step, these builders also provide the learners with overviews of what has been built so far (see also figure 9).
[Insert figure 9 here]
Figure 9 shows a screenshot of a model building session in MOBUM. Two builders are open, the entity builder and the quantity space builder. The learner is working within the latter and uses the
- 22 -
point/interval-maker. This is a tool that allows the user to add values to a quantity space. On the left side in figure 9, the model browser is shown (system model view). This browser provides an overview of the model building activities by showing the model parts that have been created so far. The browser can also be used for navigation and to open specific model parts and the corresponding builders (by double clicking on the name label).
Next to the overall design, the internal design of the different workspaces has to be determined. Some choices are rather straightforward, such as using combo-boxes to present the user with a list to select from (e.g. instance selection in the quantity tool in figure 10). This is easier and prohibits typing errors. When the learner has to provide a new name, the words entered by the user are always checked against the already existing labels in order to prevent errors or undesired overlap. Less obvious design choices concern the icons and the spatial layout of some knowledge items on the screen. To start with the former, we have tried to find insightful icons to refer to knowledge items in a builder. For instance, an entity is visualized as a cube, a quantity as a gauge, etc. These choices are somewhat arbitrary. We do not yet know to what extent the MOBUM icon language will be interpreted correctly by the target users. However, most icons also have a label identifying it.
With respect to the spatial layout, most knowledge items (e.g. entities, instances, quantities, reused model fragments, points and intervals) are represented as nodes of a connected graph. They may be moved around freely by the learner allowing him/her to organize the model to his/her taste (using the pointer tool). An exception to this rule is formed by the quantities, which are organized in a tabular form, grouped together with the instance they have been assigned to. Included in this table are the quantity space, current value, and derivative for each of the quantities (see also figure 10).
[Insert figure 10 here]
Binary relationships between knowledge items are represented as lines connecting the two icons that visualize the knowledge items. The type of relationship is shown by an icon placed at the
- 23 -
midpoint of the line (e.g., the > sign for an inequality, or an I+ sign for an influence, both shown in figure 10). A problem with this approach is that dependencies between quantities belonging to the same instance are somewhat difficult to represent, because they are lines 'from' and 'to' the same icon. Particularly in the case of 'many' lines this will become messy. Another approach would be to represent each of the quantities by a unique icon and then connect it, using lines, to the instance it belongs to. The problem with this approach is that it becomes more difficult to see what icons belong together. Also, in the case of 'many' quantities all the lines connecting all the icons make the overall picture pretty messy. More research is needed to find a good solution for this problem.
Another discussion concerns the 'conditions' and 'consequences' part of a model fragment. How to visualize this? In MOBUM we decided to have separate fields within the builder for this (see figure 10). Obviously, it is immediately clear whether an icon is in the condition or in the consequence part. But there is also a problem and that is using the same knowledge item both as condition and as a consequence. In the MOBUM approach this leads to a full copy of the instance (knowledge icon) into both the conditions and the consequences, and then add quantities relevant to each part (in figure 10 pressure is added in the conditions and amount plays a role in the consequences). From the resulting visualization in model fragment builder it is not obvious that both icons refer to the same instance, the user really has to understand the underlying details. Another approach would be not to have separate fields, but to visualize the condition versus consequence role by means of a color. Again, more research is needed to resolve the issue.
Notice that section 3 already hints at possible solutions for the above mentioned problems. However, it should be pointed out that the visualizations for VISIGARP and MOBUM are designed to support different tasks, and may therefore need to look different.
Current status and future work
- 24 -
MOBUM is a fully operational prototype that has been implemented in JAVA. In the current implementation there is no direct communication with the simulator. Instead, the learner has to save the model into files and then run the simulator (GARP) as a separate program. To be used in practice with real learners this will not be sufficient. For that purpose, MOBUM and the simulator must be fully integrated, at least from a user's perspective.
Despite the fact MOBUM has not yet been evaluated with the target users, three points for improvements can be pointed out. First, intermediate modeling support. Often when building a model, the persons building the model define intermediate models before they write down the final model. MOBUM does not support this process, it only supports the latter step. Improvements for MOBUM could focus on supporting and maintaining intermediate models for the user. Second, horizontal views. When building a model in MOBUM it is difficult to see how all the model fragments that have been created will interact. There are no tools/builders/views that provide the user with a global overview of certain model parts (except for the model browser). For instance, it may turn out to be helpful to provide the user with a 'causal model viewer', e.g. similar to the causal model view in VISIGARP (shown in figure 4). This would allow the user to investigate if and how the causal dependencies, that have been defined in the different model fragments, are related (thus, without running the simulator first). Third, model building support from a 'content' point of view. MOBUM allows for building syntactically correct models, but the current prototype has no knowledge of the model construction process and the status of the model. In order to coach learners in building models beyond the syntactic level, MOBUM should be extended in this respect.
5. Towards a networked model building community
Integration of the prototypes discussed in the previous sections, takes us close to the goal of interactive model-building environments, which incorporate intelligent support for both modelbuilding and inspection of simulation models. But we believe that the combination of these two will prove to be even more powerful for educational purposes than just the sum of their individual
- 25 -
functionality. If models of scientific phenomena become easier to produce and inspect, they can also be shared more easily. And it is exactly the sharing of understanding, made explicit in the form of (qualitative) simulation models, which creates a huge potential for learning. Imagine, for example, that two students get the same assignment of modeling a particular system, but solve it differently. Would there be a better way to exchange their different views, than to let them exchange models and experiment with them? Or imagine a whole classroom working together on a model of a large complex system, dividing tasks among subgroups to model different parts, or different aspects of the system. Or, on an even larger scale, imagine several classrooms separated by many kilometers in space, yet connected via the Internet. They could build models of systems that are important, maybe omnipresent, in their part of the world, but largely unknown to others (like the Cerrado vegetation in Brazil, or electricity generators based on water wave energy in northern Europe). By exchanging models, people could learn about systems they don’t have access to in their own part of the world. Learning about distant places will become more interesting, we believe, when students will not only be able to read and hear about them, but also be offered ways of interacting with simulations of them. In this sense, our notion of a model building community resonates strongly with the work of Reichherzer et al. (1998) on the Quorum project, although the form of knowledge representation they use is far simpler (i.e., concept maps) than in our case.
Of course, just exchanging models would not be enough to establish understanding, especially when cultural or language barriers are being crossed. Learning does not only entail model building and inspection, but also requires coaching, involving dialogue, exercises and feedback. Additional communication channels, like personal contacts between teachers, project WWW pages, e-mail and chat facilities between students, etc., will be necessary to establish real model building communities. When more people become involved in building a single model, specific tools for collaborative work will be required as well, to support both synchronous and asynchronous work, version management, search for differences and similarities, feedback on potential integration problems, etc. An example of this kind of work is C-CHENE, a structured computer mediated communication interface which supports reflective discussion between pairs of students building models in energy physics (Baker & Lund, 1997). Indeed, the idea of model
- 26 -
building communities introduces several interesting problems on our research agenda. While working on this agenda, more and more elements are being put in place, alleviating part of the shortcomings of today. Therefore, we believe that interactive model building environments based on a domain-independent modeling ontology will prove very useful for the communication of knowledge in the future.
6. Conclusions
This article has introduced the notion of interactive model building environments for educational purposes. This notion is essentially based on two ideas. First, students can learn by interacting with an articulate simulation model, investigating the structure and behavior of a particular system in the real world by looking at a qualitative representation of that system and its behavior. A prototype, VISIGARP, has been implemented for this purpose. Using VISIGARP, students can experiment with simulations of systems, or situations that are difficult to replicate in reality. They can check predictions of what might happen and search for causal accounts of particular events in the simulation. Second, students can learn by building such models themselves, using tools which contain the necessary modeling primitives as building blocks and support the model building process. This is addressed by a second implemented prototype, called MOBUM. Using the right modeling abstractions and assumptions, students can articulate in MOBUM their intuitive ideas about some interesting phenomenon in the form of a qualitative model, which can be used to run simulations. Since the prototypes are domain-independent, support is available for modeling, and model communication, in various domains. Both prototypes are currently undergoing evaluation, and further work is necessary on several aspects. For the communication of model contents and simulation results, it is clear that the diagrammatic representations can not be treated as explanations on their own – embedding them in an educational dialogue, and grounding them to educationally meaningful tasks is necessary. Concerning the support for the model building process, the currently implemented tools and constraints are not sufficient – additional guidance is needed to ensure that the model building effort turns into a useful learning experience.
- 27 -
When the functionality of the two current prototypes is combined, this will lead to interactive model building environments, which empower students to articulate their thoughts, experiment with the results generated by their own model, and reflect on the outcomes. By making explicit their ideas, students may not only deepen their own conceptual understanding of a domain, but also share this with others, since having a runnable simulation model means that it can be communicated to other users too. This aspect of interactive model building environments based on a principled modeling framework makes it possible to think about multiple users, building models together, or exchanging models between them. By realizing that knowledge can be articulated, and that the resulting model can be used to reason and communicate about system behavior, students may learn to view their knowledge of the world not as something static, but as dynamic and interactive, like the world itself.
References
Baker, M.J. & Lund, K. (1997). Promoting reflective interactions in a computer-supported collaborative learning environment. Journal of Computer Assisted Learning, 13, pp. 175-193. Bental, D. & Brna P. (1995). Enabling Abstractions: Key Steps in Building Physics Models. In Greer, J. (ed.) Artificial Intelligence in Education, Proceedings of the AIED95, pp. 162-169. AACE, Charlottesville, VA. Bobrow, D.G. (ed.) (1984). Qualitative Reasoning about Physical Systems. Elsevier Science, Amsterdam, The Netherlands. Bouwer, A.& Bredeweg, B. (2001). VisiGarp: Graphical Representation of Qualitative Simulation Models. In J.D. Moore, G. Luckhardt Redfield, and J.L. Johnson (eds.), Artificial Intelligence in Education: AI-ED in the Wired and Wireless Future, pp. 294-305, IOSPress/Ohmsha, Osaka, Japan. Bradshaw, J.M. (1997). Software Agents. MIT Press, Massachussetts. Bredeweg, B., and Winkels, R. (1998). Qualitative models in interactive learning environments: an introduction. Interactive Learning Environments, 5, pp. 1–18.
- 28 -
Bredeweg, B. (1992). Expertise in qualitative prediction of behavior. Ph.D. thesis, University of Amsterdam, Amsterdam, The Netherlands. Breuker, J.A. & Velde, W. van de (eds.) (1994). The CommonKADS Library for Expertise Modeling. IOS Press, Amsterdam, The Netherlands. Brown J.S., & Collins, J., & Duguid S. (1989). Situated cognition and the culture of learning. Educational Researcher, 18(1), pp. 32--42 Brown, J. S., Burton, R. R. & Kleer, J. de (1982). Pedagogical, natural language and knowledge engineering techniques in SOPHIE I, II and III. In D. Sleeman & J. S. Brown (Eds.), Intelligent Tutoring Systems. Academic Press, New York, pp. 227–282. Bruner, J. (1966). Toward a theory of instruction. University Press Cambridge, Massachussetts. Elio, R., & Sharf, P.B. (1990). Modeling Novice-to-Expert Shifts in Problem-Solving and Knowledge Organization. Cognitive Science, 14, pp. 579-639. Elsom-Cook, M. (1990). Analysis of a tutoring dialogue. In M. Elsom-Cook (ed.). Guided discovery learning: A framework for ICAI research, pp.113-131. Chapman, London. Falkenhainer, B.C. & Forbus, K.D. (1991). Compositional Modeling: Finding the Right Model for the Job. Artificial Intelligence, 51, pp. 95-143. Fiske, J. (1990). Introduction to communication studies (2nd edition). Routledge. New York. Forbus, K.D. (1984). Qualitative process theory. Artificial Intelligence, 24, pp. 85–168. Forbus, K.D. & Falkenhainer, B. (1992). Self-explanatory simulations: Scaling up to large models. In Proceedings of AAAI-92, pp. 685-690. Forbus, K.D., & Whalley, P.B., & Everett, J.O., Ureel L., & Brokowski, M., & Baher, J., Sven E. Kuehne, S.E. (1999). CyclePad: An articulate virtual laboratory for engineering thermodynamics. Artificial Intelligence,114, pp. 297–347. Grant, W.E., & Pedersen, E.K., & Marin, S.L. (1997). Ecology and Natural Resource Management: Systems Analysis and Simulation. John Wiley, New York. Hollan, J.D., Hutchins, E.L., & Weitzman, L. (1987). STEAMER: An interactive inspectable, simulation-based training systems. In G.Kearsley (ed.). Artificial intelligence and instruction: applications and methods. Addison-Wesley, Reading (Mass), pp. 113-134. Hulst, A. van der (1996). Cognitive Tools. Two exercise in non-directive support for exploratory learning. PhD thesis, University of Amsterdam, Amsterdam, The Netherlands.
- 29 -
Joolingen, W.R., & Jong T., de (1991). Supporting hypothesis formation by learners exploring an interactive computer simulation. Instructional Science, 20, pp. 389-404. Jong, T. de (ed.) (1991). Computer simulations in an instructional context. Education and Computing (Special issue), 6. Jong, T. de, Joolingen, W. van, Hoog, R. de, Lapied, L., Scott, D.& Valent, R. (1994). SMISLE: System for Multimedia Integrated Simulation Learning Environments. In: T. de Jong & L. Sarti (Eds). Design and Production of Multimedia and Simulation-based Learning Material. Kluwer Academic Publishers. Kearsley, G. (1994-2000). Explorations in Learning & Instruction: The Theory Into Practice Database. TIP: http://www.gwu.edu/~tip/ Koning, K. de (1997). Model-Based Reasoning about Learner Behavior. IOS Press, Amsterdam. Koning, K. de, Bredeweg, B., Breuker, J., and Wielinga, B. (2000), Model-based reasoning about learner behavior. Artificial Intelligence, 117, pp. 173-229. Kleer, J. de & Brown, J.S. (1984) A Qualitative Physics Based on Confluences. Artificial Intelligence, 24, pp. 7-83. Kleer, J. de & Williams, B.C. (1991). Qualitative reasoning about physical systems 2. Artificial Intelligence, 51 (Special issue). Kulpa, Z. 1994. Diagrammatic representation and reasoning. Machine GRAPHICS & VISION 3(1/2), pp. 77–103. Kuyper. M. (1998). Knowledge Engineering of Usability: Model-Mediated Interaction Design of Authoring Instructional Simulations. Ph.D.-thesis University of Amsterdam, Amsterdam, The Netherlands. Mallory, R. S., & Porter, B. W., & Kuipers, B. J. (1996). Comprehending complex behavior graphs through abstraction. In Iwasaki, Y., and Farquhar, A., eds., Proceedings of the Tenth International Workshop on Qualitative Reasoning, pp. 137–146. Menlo Park, CA, USA: AAAI Press. Mettes, C.T.C.W., & and H. J. Roossink, H.J. (1981). Linking Factual and Procedural Knowledge in Solving Science Problems: {A} Case Study in a Thermodynamics Course. Instructional Science, 10, pp. 333-361.
- 30 -
Mittal, V., & Moore, J., & Carenini, G., & Roth, S. (1998). Describing complex charts in natural language: A caption generation system. Computational Linguistics 24(3), pp. 431–467. Moore, J.D. (1995). Participating in Explanatory Dialogues. Interpreting and Responding to Questions in Context. Cambridge, Massachusetts / London, England: MIT Press. Newell, A. (1982). The Knowledge Level. Artificial Intelligence, 18, pp. 87-127. Pilkington, R. M., & Grierson, A. (1996). Generating explanations in a simulation-based learning environment. International Journal of Human-Computer Studies, 45, pp. 527-551. Pratap, P. (1999). Getting Started with MATLAB 5: A Quick Introduction for Scientists and Engineers. Oxford University Press, Oxford. Preece, J., Rogers, Y., Sharp, H., Benyon, D., Holland, S. & Carey, T. (1994). Human-Computer Interaction. Addison-Wesley, Reading Massachusetts, USA. Reichherzer, T. R., & Cañas, A.J., Ford. K.M., & Hayes P.J. (1998). The Giant: A Classroom Collaborator, ITS ’98 Workshop on Pedagogical Agents, San Antonio, TX. Rickel, J., & Porter, B.W. (1997).Automated modeling of complex systems to answer prediction questions. Artificial Intelligence, 93, pp. 201–260. Salles, P.S.B.A. (1997). Qualitative models in ecology and their use in learning environments. Ph.D. thesis, University of Edinburgh, Edinburgh, Scotland, UK. Salles, P., & Bredeweg, B. (1997). Building Qualitative Models in Ecology. Proceedings of the International workshop on Qualitative Reasoning, QR'97. Istituto di Analisi Numerica C.N.R. Pavia, Italy, L. Ironi (ed.). pp. 155-164. Schut, C. & Bredeweg, B. (1996). An overview of Approaches to Qualitative Model Construction. The Knowledge Engineering Review, 11(1), pp. 1-25. Sime, J., & Leitch, R.R. (1992). Multiple Models in Intelligent Training. Proceedings of the Conference on Intelligent Systems Engineering (ISE'92), pp. 263-268. Sime. J., (1994) Model Switching in Intelligent Training Systems. Ph.D. thesis. Heriot-Watt University, Edinburg, Scotland. Twidale, M.B. (1993). Coping with the variety of student actions in simulations, in: Proceedings of the EARLI Conference, Aix en Provence. Wahlster, W., & Andre, E., & Profitlich, H.-J. & Rist, T. (1993). Plan-based integration of natural language and graphics generation. Artificial Intelligence 63, pp. 387–327.
- 31 -
Weld, D., & Kleer, J. de (Eds.) (1990). Readings in qualitative reasoning about physical systems. Palo Alto, CA: Morgan Kaufmann Publishers. Wenger, E. (1987). Artificial intelligence and tutoring systems. Computational and cognitive approaches to the communication of knowledge. Morgan Kaufmann, Los Altos, California. White, B.Y., & Frederiksen, J.R. (1990). Causal model progressions as a foundation for intelligent learning environments. Artificial Intelligence, 42, pp. 99–157. Wielemaker, J. & Anjewierden, A. (1992). Programming in PCE/Prolog. Dept. of Social Science Informatics, University of Amsterdam. R. Winkels, R., & Bredeweg, B. (eds.) (1998). Qualitative Models in Interactive Learning Environments. Interactive Learning Environment, 5, pp. 1-134 (Special issue).
- 32 -
Footnotes
Footnote 1: This type of work is inspired by theories on constructivism (Bruner, 1966) and situated learning (Brown et al., 1989)
Footnote 2: An interesting enumeration of competing theories on learning can be found in TIP (Kearsley, 1994-2000).
Footnote 3: The work on self-explanatory simulations (Forbus & Falkenhainer, 1992) is an interesting example of combining quantitative simulations with qualitative knowledge to automatically generate explanations.
Footnote 4: E.g. http://www.swi.psy.uva.nl/projects/GARP/index.html. GarpApplet is an online visualization prototype, implemented in JAVA 1.2. It runs both in Explorer and Netscape.
Footnote 5: In the current implementation of MOBUM a set of default rules (domain independent) is provided. Rules are therefore not further discussed in article.
Footnote 6: Most tools are called 'makers' in the user interface of MOBUM. E.g. the quantity tool is referred to as the 'quantity maker' (see also figure 10).
- 33 -
Real-World
VCR
Domain
System
Amazon vegetation
Some system...
Construct Model (Authoring)
Perform Task
Model
Model
Knowledge Communication
Figure 1: Learning about systems and their behavior.
- 34 -
B1
B2
B3
B1'
B2'
B3'
System
System t1
t2
Time
Model
Model
Prediction (t1 t2)
Postdiction (t1 t2)
Figure 2: Behavior Analysis: Prediction and Post-diction.
- 35 -
Figure 3: Entity-attribute graph and Entity is-a hierarchy for an ecological model of the Brazilian Cerrado vegetation.
- 36 -
Figure 4: The causal model view for state 1 of the Cerrado simulation, showing parameters within the entity they belong to, and relationships as labeled arrows. The I-relations denote influences, P-relations denote proportional relationships.
- 37 -
Figure 5: The list of model fragments that are active in state 1. The contents of the selected model fragment natality process for the grass population are shown in detail, both in text and graphics format.
- 38 -
Figure 6: State-transition graph for the Cerrado simulation. For the selected path between state 1 and 12, the transition history is opened, as well as the value history for the parameter number_of(shrub), which shows an increase from zero to high.
- 39 -
is sub-type of
Model Fragment
Entity
Scenario
Quantity Space
Rules
! assumes values of
is parent of
Quantities ! is instance of
assumes"
Value -Derivative -QSValue
Description Inequality
Instance
Attribute Correspondence
Condition
Consequence
Influence
Proportionality
Figure 7: Simulation model ontology of the GARP qualitative reasoning engine.
- 40 -
Case: Create Quantity, apply a Quantity Space and assign a value to the quantity User
Select create new quantity
System
Quantities choice
Display quantities already created and option to create new one
Choice out Field
Display field to the new name
Provide name Quantity Name
Not Ok Select QS from the list ok
Validate name. Display existing QS's
Select value to the quantity from its QS
Registers
Store Instance/ Quantity/QS/Value
Figure 8: An example task analysis for making a new quantity.
- 41 -
Figure 9: a MOBUM session, showing: browser, entity builder and quantity-space builder.
- 42 -
Figure 10: Model fragment builder: user starts adding a new quantity to the liquid-flow process.
- 43 -