May 6, 2005 - A Greek Pottery Shape and School Identification and Classification. System Using ..... decoration is as red figure, in outline and often with much ...
Proceedings of Student/Faculty Research Day, CSIS, Pace University, May 6, 2005
A Greek Pottery Shape and School Identification and Classification System Using Image Retrieval Techniques Gulsebnem Bishop, Sung-Hyuk Cha and Charles Tappert {gf44944w, scha, ctappert}@pace.edu ABSTRACT In this paper we propose an image-based pottery shape and school identification and classification system for an unknown pottery or fragment. This system is designed to assist archaeologists and students to identify and record objects quickly and accurately. We present several image retrieval and computer vision techniques and describe their applications within the domain of archaeological studies by utilizing a large digital library of pottery photos. Twenty pottery shapes and four pottery schools are identified with shape and color-based image retrieval techniques, respectively. The system analyses and compares extracted features to determine the five closest database images, and then presents them to the user for final decision. This is the first pottery study to combine the two different techniques – shape and color-based image retrieval – to identify multiple characteristics of an unknown pottery image or a pottery fragment. The database contains about one thousand pottery photos obtained from online digital libraries. Experiments on identifying the correct pottery shape and pottery schools yielded approximately 98% accuracy based on the whole pottery image. Key words: image retrieval, jigsaw, pottery classification, template matching
process goes through 8 stages; retrieval, washing, examination, registration, cutting, description, drawing and publication, but this process changes from excavation to excavation. [16] The retrieval, analysis and the classification of the pottery found in excavations are very labor and time intensive. This study has several modus operandi. First, it will serve as an educational tool for a novice archaeologist to identify and study artifacts or fragments easily and quickly. Second, it can serve as a valuable tool in excavations for identification, classification, and reconstruction of fragments. This may lead to significant archaeological discoveries. Third, thousands of pottery fragments are unearthed every year, and are usually discarded after being recorded. It is often impossible to photograph or record the measurements of these fragments, or even assign them a particular category or class. This system will provide a quick, inexpensive and objective way of documenting and classifying these fragments. Finally, it can assist in identification and analysis of pottery decorations.
1.
INTRODUCTION The study of pottery is one of the most important and complex tasks done by archaeologists. A significant amount of information about a culture can be gleaned from studying pottery. Analyzing the physical aspects of a pot, or a fragment, can give us detailed information about the history behind the artifact. By observing the shape and the size, we can establish a date range. By observing the decorations, we can narrow the date range of a vessel. Pottery contains a great deal of information; therefore, as it is hard not to agree with Kampel & Sablatnig: it is necessary to find a new and more effective means of analysis.[1] 1.1 Current Study of Pottery Most commonly found object in an excavation, and probably the most useful, is the pottery or pottery fragments. From these artifacts it is possible to build an entire chronology examining the stylistic changes occurring in each level of habitation. They provide us with information about technical, artistic and decorative changes and developments which gives us a general understanding of the civilization as a whole. They also give us information about the people’s daily lives such as what they ate, what they produced and traded and who they worshipped. The study of pottery start from the time it is unearthed and never ends. Usually, the
1.2 Previous Research Studies and research on finding a recording and a retrieval system for archaeological finds go back to the early 70’s. Most studies in this decade concentrated on how computers and computer applications could be used in the field of archaeology. While Lengyel
C2.1
techniques for analysis and storage of archaeological data. Pottery fragments were put on a rotating plate, recorded with a video camera, processed and measured, and drawn automatically. ARCOS system was tested with the material found in the excavation site Velia, located in Southern Italy but since the parameter for the description of the pottery were numerically coded the possibility of making mistakes were high. The second system, SAMOS, provided an automatic drawing and reconstruction of profiles from pottery. This system obtains a contour line of a pot with a help of a tablet by determining several points on this line. The accuracy of the tablet is very high however error occurred when the pen was positioned incorrectly and from interpolation. Unfortunately, the results of the two are not sufficient enough for archaeological requirements because each method had disadvantages. Since 1997 the studies have focused more on the 3-D construction of the pottery shapes. A number of models and algorithms were introduced to deal with the accurate 3-D construction, recording and classification of the artifacts [1,8,9]. Some recent studies have concentrated on curve matching [10,11,12] and color became an important subject for study. [13, 14, 15] Identifying the shape and the school of pottery, or a fragment of pottery, can be a challenging computer vision problem. Even though the shape of a pot is unique, the nuances vary and, of course, it may belong to different schools, i.e. color convention, such as: RedFigure, Black-Figure, or White Ground School. We present a pottery shape and school recognition system based on the shape and color measurements [16] and color-based image retrieval techniques [17]. We integrate these two techniques using them together for the first time in our study. In short, this is how our system works. A user loads the image of a pottery, or an image of a pottery fragment as an input. The task of the system is to retrieve five similar images from the database which are closest to the queried image. The system consists of three stages: segmentation, feature extraction and retrieval for the identification of shape and school. There are number of advantages to this type of analysis. First, the techniques of pottery analysis have evolved over the years and became a very specialized area. Trained eye can examine
[2] was concentrating on use of computer applications in archaeology, Main [3] was concentrating on storage, retrieval and classification of the pottery shapes. In the late 80’s Hall and Laflin [4] started applying Computer Aided Design techniques to increase pottery profile drawing. The most important research was done in 1990 regarding pottery shape representations and matching. Lewis and Goodson [5] started a project called GOAD (Graphically Oriented Archaeological Database) at University of Southampton. The goal of the GOAD project was to create an integrated text, graphical and image artifact database with emphasis on storage, retrieval and dissemination strategies. The project was also important because it was one of the earliest uses of Generalized Hugh Transformation (GHT) to provide a powerful shape matching tool. In the early 90’s Lewis continued his studies and research on artifact matching and retrieval systems with Durham and Shennan. [18] In a second paper they describe a prototype System for Matching ARTefacts (SMART) [6]. This systems artifact classification was based on GHT one more time and it included texture analysis as well. SMART allowed the user to find a match or a set of matches for an unknown image with a set of known images held in the database. The image could be captured in any way, such as a video camera. The system invokes the user for the image source and the image is displayed in the control panel. The user than choose from two options to perform the match: the whole shape or part of a shape. The system was tested using two sets of images, ones from the Lovosice region in Czech republic and the second set from the British Isles. At the end of this study Lewis and his colloquies suggested that speed can be improved, part-matching could be perfected, scale and rotation-invariance should be introduced to the current system and finally system should be extended to enable objects to be matched on basis of similarities in visual texture. In 1996, R. Sablatnig and C. Menard [7] wrote a paper on combining shape from stereo method and shape from structured light method in one acquisition system to help archaeologists automate the classification process. They built two systems: ARCOS (Archaeological COmputer System) and SAMOS (Statistical Analysis of Mathematical Object Structure). ARCOS was developed in Karlsruhe, Germany. It combines video and computer
C2.2
the smallest piece of fragments and from the pieces he studied previously at the museums and excavations, he can tell the approximate date of its manufacture and the culture that it belongs to. But before this can be done the whole pottery tradition of the civilization has to be known and analyzed. But when it comes to large amounts of data humans have limitations. Humans have limitations processing large amounts of data in a very short time as well as retaining that information. Computers, on the other hand, have an advantage over humans in processing large amounts of data and analyzing them accurately and quickly. Yet, they have to be trained in what to look for. Certain image processing and retrieval techniques used in our system can be great help in solving some of the issues related to pottery or fragment identification process which consumes a lot of time. The subsequent sections of this paper are organized in the following way. Section 2 explains the pottery image database: the digital images and the factual information related to the pottery. Section 3 describes feature extraction process and the graphical user interface called PIRS – Pottery Information Retrieval System. In section four, the experimental results are examined. In section five, we will discuss how this study can be further developed.
through out time. They start from stout shapes and advance to more slender ones. These are the twenty shapes we choose for out database as seen in Figure 1. These are Alabastron, Amphora (Type B, Nolan, Neck), Crater (Bell, Calyx, Column, Volute), Lekythos (Squat and Cylindrical), Eye Cups, Kylix, Pyxis, Hydria-Kalpis, Stamnos, Skyphos, Kantharos, Kyathos, Pelike and Oinochoi. Alabastron is a narrow necked perfume flask with elongated body and a round bottom normally used by women. Cylindrical and squat lekythoi are one-handled flasks for perfumed oil. The narrow aperture prevented evaporation of the valuable contents. A pyxis is a round box with a lid which was used by women to hold cosmetics or trinkets. The amphora is a two-handled pot with a neck that is considerably narrower than the body. Amphorae were the standard containers for transporting oil and wine. A crater is used as a container for mixing wine and water during gatherings. In Greek settlements overseas, craters were also used as containers of the ashes in burials. An eye cup, also called Cup Type A is dated around 525-500 BC. This is a cup with a shallow bowl, and a short stout foot. A prominent ring marks the join between bowl and stem. The kylix is called the Type B cup may have been invented by the Amasis Painter who made and signed several examples in the last decade of the sixth century. Generally more delicate than the cup of Type A, it has a higher foot and is usually decorated in red-figure. The skyphos is a deep drinking cup with two handles and a low foot. The kantharos is a drinking vessel with two high vertical handles. Kyathos is a dipper with one handle to draw liquids from bigger bowls. A hydria-kalpis is a three-handled water jar. The stamnos is a wide-mouthed pot with the neck reduced to a collar and the handles set horizontally on the belly. It was sometimes used as a crater. The pelike is a one-piece vessel similar to the amphora. It has two handles, a narrow neck and a sagging belly. Oinochoe is a one handled jug. The mouth may be trefoil, round or beaked. There are four distinct color conventions in our database as seen in Figure 2. These are Red Figure, Black Figure, Red Figure White Ground, and Black Figure White Ground. [18, 19, 20] The black figure technique was invented in Corinth, Greece around 700 BC and
2. DIGITAL IMAGES AND INFORMATION DATABASE The database utilized in this system consists of two sections. The first section contains the images of pottery with shape and school information. The second section contains information on extracted features. The digital images of the pottery are kept in one folder. Our training database consists of two hundred images, which is made of twenty distinct pottery shapes (Figure 1). These shapes were specifically chosen because of their distinct features and also some having similar features within their group. Most shapes in Attic Greek pottery were traditional. Over time they presented continuity. They were designed to fulfill a specific purpose. Some were for storage, some for pouring, some for drinking and some for mixing. Ancient Greeks were practical. The need determined the shape of the vase. There was some standardization and measurement in pottery. The necks, bodies and feet of the vases were made separately and later put together. [18] The change in proportions can be observed
C2.3
We then measure the regional properties of the segmented image. These are: area, bounding box, centroid, major axis length, minor axis length, equiv diameter, eccentricity, orientation, solidity and extent. The regional properties measure the object or region properties in a segmented image and returns them in a structure array so that the ith element corresponds to the ith element. Area is the actual number of pixels in a chosen area of an image. Bounding Box is the smallest rectangle containing the region. Centroid is the center mass of the region as seen in Figure 5.
it was a revolutionary method of decorating pottery. It involved drawing figures in black silhouette, incising linear detail so that the pale clay would show through the black. Around 630 BC Athenians started using the black figure technique as well on their decorative vases and in the next 150 years it dominated the markets. The red figure vase painting technique was invented in Athens, Greece about 530 BC when black figure was at its prime. At the end of the half century red figure technique stood alone as the major decorating style of vase painting in Greece. The red figure is the reverse of black figure but detail executed by a brush rather than a graver, which gave the artist more freedom for the new, realistic style of expression. Figures and patterns are in red clay and the background is filled with black. The white ground technique of vase painting involved a thick slip on which the painted figures are drawn. The term white ground is mainly applied to some vases decorated in Athens in the black figure technique in the later 6th and early 5th centuries BC; then to vases through the 5th century where the decoration is as red figure, in outline and often with much added color. The information about the pottery images are kept in a separate folder as seen in Table 1. These includes Pottery ID, Museum ID, ware, shape, painter, potter, context, date, height, diameter of the lip, maximum width with handles, diameter of the foot, description of the events on side A and Side B. The factual information about the images are obtained from books, museum catalogues and online pottery databases. [18, 19, 20, 21, 22]
Figure 5 MajorAxisLength and Minor AxisLength are supported only for 2-D input label matrices. The Major Axis Length is the length (in pixels) of the major axis of the ellipse that has the same normalized second central moments as the region, where as Minor Axes Length is the length (in pixels) of the minor axis of the ellipse of the same which is depicted in figure 6.
Figure 6 Figure 6 illustrates the image region and its corresponding ellipse axes and orientation of the ellipse. On the right hand side the figure illustrates the axes, foci and the major/minor axes. EquivDiameter is the diameter of a circle with the same area as the region, computed as: √(4*Area/π). The eccentricity is the ratio of the distance between the foci of the ellipse and its major axis length. The value is between 0 and 1. Orientation is the angle (in degrees) between the x-axis and the major axis of the ellipse that has the same second-moments as the region. Solidity is the proportion of the pixels in the convex hull that are in the region computed as: area/convex area.
3. PIRS–POTTERY IDENTIFICATION & RETRIVAL SYSTEM
Before determining the shape and the school of the pottery image, all images are not only stored as a digital image but also represented by a feature vector in the database which will be described in the following section. 3.1 Segmentation and Feature Extraction First, we obtain the digital image of the pottery that we are going to identify. Second, the image will then go thru a segmentation process as seen in Figure 3. We take the ratios of the images so that they are size invariant. Further more, as can be seen in Figure 4, we take the ratios of the raw regional features.
C2.4
We first used 2D images of the whole pottery and randomly broke them into several pieces as seen in figure 9. We were successful in matching the pieces with a jigsaw puzzle like algorithm as seen below in figure 10. We were then curious to try this with a plain paper cup which would give us more challenge because of the curved nature of the pieces. We dissected the cup to 7 pieces as seen in figure 11. we put the cup together through a jigsaw puzzle algorithm shown in figure 12 and color coded the pieces for further identification, constructing a 3D cylinder of the fragments shown in figure 13.
Extent is the proportion of the pixels in the bounding box that are also in the region, computed as: area/area of bounding box. 3.2 Image Retrieval of Whole Pottery Once an image is segmented and features extracted this information will be compared to the digital images information in our database. The aim of the color and shape matching algorithm is to eliminate the lesser matching pieces and to identify the top five matching pieces when it is run against the image database. The Graphical User Interface makes the analysis, comparison and classification simple and efficient. For this purpose we created a Pottery Information Retrieval System – PIRS. This system contains five screens. The first screen prompts the user to load a pottery image of an unknown shape, color and size. After choosing the desired image the next screen analyzes the selected image extracting the regional property measurements. Shape and color matching algorithm identifies the closest matched five images. After the user chooses the closest image, the information about the image is displayed on the fifth screen. This screen gives information about the chosen vase, including shape, ware, date, painter, potter, and decoration (Figure 7). The system detected the shapes of the
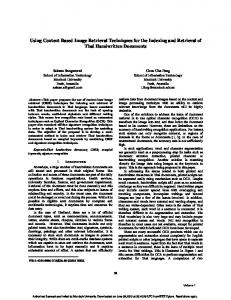
Figure 11. Dissected Paper Cup
Jigsaw puzzle problem has been thought of an important artificial intelligence search problem. If one tries to solve the jigsaw puzzle problem based on shape the solution of the problem becomes harder. The patterns or colors or decorations on the fragments help us tremendously locating the matching pieces. It reduces the search space by utilizing this information.
Figure 7. Information about the image is displayed selected images, and matched it with corresponding images at a 99% rate of accuracy as seen in Figure 8. The color conventions of the images were matched with 98% accuracy.
Figure 13. 3D Cylinder of Fragments 3.4 Template Matching for Single Pottery Fragment During excavation unfortunately not all pieces of the same pottery are found all together in one place. One fragment can be unearthed in the vicinity but another can be found at different levels or couple of yards away. This last section makes sure that these single pieces are recorded in the system and if another piece is unearthed it will be matched with the other pieces that were found previously and also if there are any
3.3 Image retrieval for Fragments The pottery fragments which belong to the same vase go through the same stages of analysis. First, we obtain the image of the fragments. Second, the image of the fragment is segmented. Then, the fragments are put together through Jigsaw puzzle like algorithm. The resulting data is run though the image database and top 5 matches are identified.
C2.5
In this paper, we have presented a pottery shape and school recognition system by using color and shape, jigsaw puzzle and template matching algorithms. This system would have practical applications because it would be helpful to archaeologists who may wish to use the device to record objects quickly and accurately. There is great potential in this study. It can be expanded to a number of different areas of pottery, such as decoration and painter style identification. In addition, there are endless possibilities which may be applied to the field of archaeology by providing interactive and portable systems which may be used in the field, making the identification and recording of artifacts or fragments vastly more efficient, such as working with less identifiable parts of the pots. Applying the regional properties and the template matching algorithm to real fragments and extending the study to more subtle shapes. Finally, working on and resolving the speed of the identification process. One aspect of the study, which is the speed of the process, need to be improved. The speed of the computer and the processor used at the time of testing might have affected this process but the algorithm can be made more efficient in this aspect.
decoration on them they will be matched with similar decorations on the pieces in our database. The pottery fragment goes through the same stages of analysis as the other pieces go. First, we obtain the image of the fragments. Second, the image of the fragment is segmented. After the template matching algorithm is run the top 5 matches are identified. [23] For this purpose we again made use of our digital images and randomly cropped an area of interest and tried to find the matching areas on other pieces that are in our database. The results are displayed in figure 15. 4.
EXPERIMENTAL RESULTS We trained our system with two hundred images, which involves twenty different pottery shapes and four different color conventions. We also tested the system with four hundred whole pots as well as four hundred fragment images. In general, the attention was given to how accurately the system identified four important issues for this study: First, how accurately did the system identify the shapes of the whole vessels? Second, how accurately did the system matched the fragments and identify the shape of the vessels. Third, how accurately did the system identify and match the single fragments. Finally, how accurately did the system identify the color conventions within the three above mentioned areas. The system detected the shapes of the selected images, and matched it with corresponding images at a 99% rate of accuracy. (Figure 8) The randomly cropped 2D images were put together with high accuracy rate and were matched to the corresponding image with %98 accuracy. When we tested the system using single fragments, the accuracy rate of finding the exact same area depended on the area that we were looking for. If it was an obvious area and a large enough area, the rate of accuracy was 99%. If the area was a cropped piece from a less identifiable region, the accuracy rate dropped down to %70. (Figure 15) The color convention in both cropped images and whole images were detected with 98% accuracy. (Figure 8 and 15) The identification process takes about 2-3 minutes for each fragment. 5.
REFERENCES 1. Kampel, M. & Sablatnig, R. Virtual Reconstruction of Broken and Unbroken Pottery. In Proceedings of the Fourth International Conference on 3-D Digital Imaging and Modeling, pp. 318-325 (2003). 2. Lengyel, A. Computer Applications in Classical Archaeology. In Proceedings of Computer Applications in Archaeology. pp. 56-62 (1975). 3. Main, P. The Storage Retrieval and Classification of Artefact Shapes. In Computer Application in Archaeology. pp. 39-48 (1978). 4. Hall, N. S. and Laflin, S. A Computer Aided Design Technique for Pottery Profiles. In Computer Applications in Archaeology. pp. 178-188 (1984). 5. Lewis, P. H. and Goodson, K. J. Images, Databases and Edge Detection for Archaeological Object Drawings. Computer Applications and Quantitative Methods in Archaeology:149-153 (1990). 6. Durham, P., Lewis, P. H. and Shennan, S. J. Artefact Matching and retrieval Using the Generalised Hough Transform. In Proceedings of Proceedings of Computer Applications in Archaeology. pp. 25-30 (1995). 7. Sablatnig R. and Menard C. Computer based Acquisition of Archaeological Finds: The First Step towards Automatic Classification. In 3rd International Symposium on Computing and Archaeology. Vol. 1, pp. 429-446 (1996).
CONCLUSION
C2.6
8. Kampel, M., Sablatnig, R. and Costa, E. Classification of Archaeological Fragments using Profile Primitives. In Computer Vision, Computer Graphics and Photogrammetry - a Common Viewpoint, Proc. of the 25th Workshop of the Austrian Association for Pattern Recognition (OEAGM). Vol. 147, pp. 151-158, Oldenburg, Wien, München, 2001. 9. Kampel M. and Sablatnig R. 3D Puzzling of Archeological Fragments. In Proceedings of the 9th Computer Vision Winter Workshop, pp.31-40 (2004). 10. Leitao, H. C. G. and Stolfi, J. Multiscale Method for Reassembly of Two-Dimensional Fragmented Objects. In IEEE Trans. On Pattern Analysis and Machine Intelligence, 24 (9), pp.1239-1251 (2002). 11. McBride, J. C. & Kimia, B. B. Archaeological Fragment Reconstruction Using Curve Matching. In Proceedings of the 2003 Conference on Computer Vision and Pattern Recognition Workshop, pp. 1-8 (2003). 12. Kong, W. and Kimia, B. B. On Solving 2D & 3D Puzzles Using Curve Matching. In Proceedings of the 2001 IEEE Computer Society Conference on Computer Vision and Pattern Recognition, pp. 583591 (2001). 13. Cha, S-H., Murirathnam, S. Comparing Color Images Using Angular Histogram Measures. In Proceedings of 5th Joint Conference in Information Sciences, vol. II, CVPRIP, p.139-142 (2000). 14. H. S. Sawhney, H. S. and Hafner, J. L. Efficient Color Histogram Indexing. In International Conference on Image Processing, vol. 1, pp. 66-70 (1994). 15. Kampel, M. and Sablatnig, R. Color Classification of Archaeological Fragments. In International Conference on Pattern Recognition (ICPR'00)-Volume 4, September (2000) pp. 4771. 16. Hart, E., Cha, S-H. and Tappert, C. Interactive Flag Identification Using Image Retrieval Techniques. Pace University, SCIC Technical Report, Number 203 (2004). 17. Nagy, G. and Zou, J. Interactive Visual Pattern Recognition. In Proceedings of the International Conference on Pattern Recognition XIV, vol. 2, pp. 478-481 (2002).
Black Figure (630-530 BC)
18. Boardman, J. Athenian Black Figure Vases. Thames and Hudson, Inc. 1974. 19. Boardman, J. Athenian Red Figure Vases: The Archaic Period. Thames and Hudson, Inc. 1975. 20. Boardman, J. Athenian Red Figure Vases: The Classical Period. Thames and Hudson, Inc. 1989. 21.Perseus website http://www.perseus.tufts.edu/ 22. Boardman pottery database http://www.beazley.ox.ac.uk/BeazleyAdmin/Script2/ Efficient Algorithms for Image 23. Cha, S-H. Template and Dictionary Matching. Journal of Mathematical Imaging and Vision. Vol. 12, issue 1,pp. 81-90 (2000). 24. Virtual Karak Resource Project http://www.vkrp.org/studies/archaeological/pottery/inf o/how-study.asp
1
2
3
6
4
7
10
8
11
14
Black Figure White Ground (460-420 BC)
Figure 2. Schools
Table 1. Coded Information
C2.7
13
16
19
Figure 1. Vase Shapes
Red Figure (530-470 BC) (550-330 BC)
9
12
15
18
5
Red Figure White Ground
17
20
POID
MUSID
WARE
SHAPE
PAINTER
CONTEXT
DATE (BC)
HEIGHT (M)
522 185 399 519
M11 M10 M10 M7
W1 W1 W1 W1
S4 S3 S3 S20
P64 P78 P78 P100
C30 C6 C6 C30
D2 D36 D36 D36
H105 H59 H59 H108
Image
DIAM. LIP (M) DL79 DL47 DL47 DL57
Segmentation Process Figure 3. Segmentation Process
Figure 4. Ratios of Regional Features
Queried Image
Queried Image
Top five similar images retrieved
Top five similar images retrieved Figure 8. Results returned from PIRS for whole pottery
C2.8
WIDTH MAX (M) WWH26 WWH8 WWH8 WWH16
DIA. FOOT
SIDE A
SIDE B
DF23 DF13 DF13 DF18
SA120 SA52 SA52 SA14
SB8 SB26 SB26 SB47
Segmented Image
Figure 9. Randomly braking a pottery image
Figure 10. Assembling of the Fragments
Figure 12. Paper Cup
Queried Image Detail
Top 5 Returned Images
C2.9
Queried Image Detail
Top 5 Returned Images
Queried Image Detail
Top 5 Returned Images Figure 15. Results returned from PIRS for single pottery fragment
C2.10