May 15, 2017 - internal state (callstack, values of variables) to determine the cause of the problem. ... seen at a low level (assembly code, often mapped to the source code) ... Property for the absence of queue overflow in a producer-consumer program ... Examples of scenarios are: when the verdict given by the monitor ...
1
arXiv:1705.05315v1 [cs.SE] 15 May 2017
Interactive Runtime Verification RAPHAËL JAKSE, Université Grenoble Alpes YLIÈS FALCONE, Université Grenoble Alpes JEAN-FRANÇOIS MÉHAUT, Université Grenoble Alpes KEVIN POUGET, Université Grenoble Alpes Monitoring is the study of a system at runtime, looking for input and output events to discover, check or enforce behavioral properties. Interactive debugging is the study of a system at runtime in order to discover and understand its bugs and fix them, inspecting interactively its internal state. Interactive Runtime Verification (i-RV) combines monitoring and interactive debugging. We define an efficient and convenient way to check behavioral properties automatically on a program using a debugger. We aim at helping bug discovery while keeping the classical debugging techniques and interactivity, which allow understanding and fixing bugs. CCS Concepts: •Software and its engineering → Software testing and debugging; Additional Key Words and Phrases: runtime verification, property, monitoring, debugging ACM Reference format: Raphaël Jakse, Yliès Falcone, Jean-François Méhaut, and Kevin Pouget. 2017. Interactive Runtime Verification. 1, 1, Article 1 (May 2017), 40 pages. DOI: 10.1145/nnnnnnn.nnnnnnn
1
INTRODUCTION
When developing software, detecting and fixing bugs as early as possible is important. This can be difficult: an error does not systematically lead to a crash, it can remain undetected during the development cycle. Besides, when detected, a bug can be hard to understand, especially if the method of detection does not provide methods to study the bug. Interactive debugging. A widespread way to fixing bugs consists in observing a bad behavior and starting a debugging session to find the cause. A debugging session generally consists in repeating the following steps: executing the program in a debugger, setting breakpoints before the expected cause of the bug, finding the point in the execution where it starts being erratic and inspecting the internal state (callstack, values of variables) to determine the cause of the problem. The program is seen as a white box and its execution as a sequence of program states that the developer inspects step by step using a debugger in order to understand the cause of a misbehavior. The execution is seen at a low level (assembly code, often mapped to the source code) while one would ideally want it be abstracted. The debugger links the binary code to the programming language. The state of the program can be modified at runtime: variables can be edited, functions can be called, the execution can be restored to a previous state. This lets the developer test hypotheses on a bug without having to modify the code, recompile and rerun the whole program, which would be time consuming. However, this process can be tedious and prone to a lot of trials and errors. Moreover, observing a bug does not guarantee that this bug will appear during the debugging session, especially if the misbehavior is caused by a race condition or a special input that was not recorded when the bug was observed. Interactive debugging does not target bug discovery: usually, a developer already knows the bug existence and tries to understand it. 2017. XXXX-XXXX/2017/5-ART1 $15.00 DOI: 10.1145/nnnnnnn.nnnnnnn
, Vol. 1, No. 1, Article 1. Publication date: May 2017.
1:2
Raphaël Jakse, Yliès Falcone, Jean-François Méhaut, and Kevin Pouget
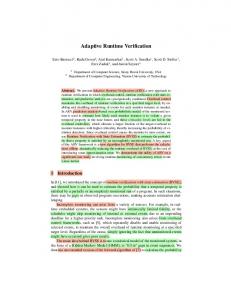
Scenario Applies user-defined reactions
User
Events
Controls Controls Events
Monitor Checks a user-defined property
Debugger Asks for instrumentation Affects Instruments
Program Execution
Fig. 1. Overview of the approach
Monitoring. Runtime verification (aka monitoring) [20, 28, 35] aims at detecting bugs. The execution is abstracted into a sequence of events of program-state updates. Monitoring aims at detecting misbehaviors of a black-box system: its internal behavior is not accessible and its internal state generally cannot be altered. Information on the internal state can be retrieved by instrumenting the execution of the program. The execution trace can be analyzed offline (i.e. after the termination of the program) as well as online (i.e. during the execution) and constitutes a convenient abstraction on which it is possible to express runtime properties. We aim at easing bug discovery, bug understanding as well as their combination. We introduce Interactive Runtime Verification (i-RV), a method that brings bug discovery and bug understanding together by combining interactive debugging and monitoring, augmenting debuggers with runtime verification techniques. Using i-RV, one can discover a bug and start getting insight on its cause at the same time. i-RV aims at automating debugging. For instance, it is possible to automatically stop the execution when a misbehavior is detected or to automate checkpointing at the right times. We define an expressive property model that allows flexibility when writing properties. We give a formal description of our execution model using high-level pseudo-code which serves as a basis for a solid implementation and reasoning and to ensure correctness of our approach. End-users are however not required to have a full understanding of this description. i-RV takes advantage of checkpoints. Checkpoints allow saving and restoring the program state. They are a powerful tool to explore the behavior of programs by trying different execution paths. i-RV introduces the notion of Scenarios. They allow defining actions that are triggered depending on the current state of the property verification. We provide a full-featured tool for i-RV, Verde, written in Python as a GDB extension, facilitating its integration to developers’ traditional environment. Verde also provides an optional animated view of the current state of the monitor. We give a detailed evaluation of
, Vol. 1, No. 1, Article 1. Publication date: May 2017.
Interactive Runtime Verification
1:3
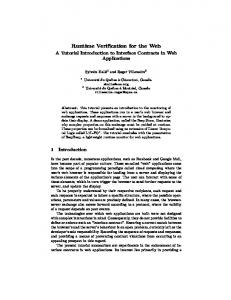
Fig. 2. Property for the absence of queue overflow in a producer-consumer program described in Sec. 6.2.
i-RV using Verde. This evaluation validates the usefulness of i-RV and its applicability in terms of performance. Organization of this paper. In Sec. 2, we give a general picture of our approach. In Sec. 3, we describe our approach more precisely. In Sec. 5, we present our proof-of-concept implementation of this approach, Verde. In Sec. 6, we evaluate our approach. In Sec. 7, we present existing techniques for finding and studying bugs and compare them to our work. In Sec. 8, we conclude by presenting our future works . 2
APPROACH OVERVIEW
In i-RV (Fig. 1) , the developer provides a property to check against the execution trace of a program to debug. The property can be written according to its specification or the Application Programming Interface (API) of the libraries it uses. An example of a property is pictured in Figure 2 and gives the verdict false as soon as a queue overflows. The program is run with a debugger which provides tools to instrument its execution, mainly breakpoints and watchpoints, and let us generate events to build the trace, including function calls and variable accesses. An extension of the debugger provides a monitor that checks this property in real time. Breakpoints and watchpoints are automatically set at relevant locations as the evaluation of a property requires monitoring function calls and memory accesses. When an event stops influencing the evaluation of any property, the corresponding instrumentation (breakpoints, watchpoints) becomes useless and is therefore removed: the instrumentation is dynamic. The user-provided scenario defines what actions should be taken during the execution according to the evaluation of the property. Examples of scenarios are: when the verdict given by the monitor becomes false (e.g. when the queue overflows), the execution is suspended to let the developer inspect and debug the program in the usual way, interactively; save the current state of the program (e.g. using a checkpoint, a feature provided by the debugger) while the property holds (e.g. while the queue has not overflown) and restore this state later, when the property does not hold anymore (e.g. at the moment the queue overflows). When an event is generated — when a breakpoint or a watchpoint is reached — at runtime, the monitor updates its state. Monitor updates are seen as input events for the scenario. Examples of these events are “the monitor enters state X”, “the state X has been left”, “an accepting state has been entered”, “a non-accepting state has been left”. 3
JOINT EXECUTION OF THE DEBUGGER, THE MONITOR AND THE PROGRAM
i-RV relies on the joint execution of different components: the program, the debugger, the monitor and the scenario. We formally describe the Interactively Runtime Verified program (i-RV-program) composed of these components as a Labeled Transition System (LTS). We first present each component and our property model based on an extension of finite-state machines in Sec. 3.2. Events play the role of symbols of the LTS. Events are defined in Sec. 3.1. We then describe the evolution , Vol. 1, No. 1, Article 1. Publication date: May 2017.
1:4
Raphaël Jakse, Yliès Falcone, Jean-François Méhaut, and Kevin Pouget p
::= v | ∗p | &p | arg i, i ∈ N | ret
(a defined variable) (the value pointed by p) (the address of variable p) (the current value of parameter i )
Fig. 3. Grammar of valid parameter names
of the i-RV-program in Sec. 3.3 using pseudo-code. This formalization is not needed to adopt the approach. However, it offers a solid basis for implementation and for reasoning and expressing properties over the concepts behind i-RV. Notations. We define some notations used in this paper. We denote the set of booleans by B = {true, false} Given two sets E and F , E → F denotes the set of functions from E to F . By f : E → F or f ∈ [E → F ], we denote that f ∈ E → F . Let f : E −→ F , function f 0 = f [x 1 7→ v] is such that f 0(x) = f (x) for any x , x 1 , and f 0(x 1 ) = v. The domain of function f is denoted by D(f ). Let us consider a non-empty set of elements E. The powerset of E is denoted P(E). Moreover, ϵ E is the empty sequence (over E), noted ϵ when clear from the context. E ∗ denotes the set of finite sequences over E. Given two sequences s and s 0, the sequence obtained by concatenating s 0 to s is denoted s · s 0. We denote by Names the set of valid function and variable names in a program. We define the transitive relation “f 0 is more specific than f ”: f v f 0 = D(f ) ⊆ D(f 0) ∧ ∀p ∈ def
D(f ) : f (p) = f 0(p). Likewise, “f 0 is strictly more specific than f ”: f @ f 0 = D(f ) ⊂ D(f 0) ∧ ∀p ∈ D(f ) ∧ f (p) = f 0(p). def
3.1
Events
i-RV is based on capturing events from the program execution with the debugger. Definition 3.1 (Event). An event is a tuple e = (t, n, p, i, b) ∈ EventTypes×Names×ParamNames∗ × Valuesp∗ × B) where EventTypes = {Call, ValueWrite, ValueRead, UpdateExpr}. The event name n ∈ Names is denoted name(e). A grammar describing the set of valid parameter names ParamNames is given in Figure 3. A parameter can be the name of a variable defined in the program, the value pointed by a pointer, the address of a variable, an argument of the current function or a return value. Remark 1. The parameter arg i is not necessarily the value that was passed to the function when it was called. The parameter can be modified between the function call and when the event is triggered. If e is a symbolic event, its parameters are uninstantiated, i.e., i = ∅. If e is a runtime event, i is a list of parameter instances and values(e) is the function that maps parameters to their values: values(e) : Names −→ Values pk 7−→ i k Symbolic events are used to describe properties. Runtime event are matched with symbolic events if all its components, except values, are identical to the components of the symbolic event. Example 3.2 (Event). (FunctionCall, push, (q, v), ∅, true) is an event that is triggered before the call to function push. Parameters q and v are retrieved when producing the event. , Vol. 1, No. 1, Article 1. Publication date: May 2017.
Interactive Runtime Verification 1:5 Definition 3.3 (Event matching). A runtime event ei matches a symbolic event e f if name(ei ) = name(e f ) and type(ei ) = type(e f ) and isBefore(ei ) = isBefore(e f ) and params(ei ) = params(e f ). Example 3.4 (Event matching). “Before push(q, 5)” is a runtime event matching the symbolic event “Before a call to function (type) push (name) that takes a queue and an element in parameters (list of parameters)”. The type t ∈ EventTypes of event e is denoted type(e). If b = true (resp. false), e is a before (resp. after) event and isBefore(e) = true (resp. false). We describe the different event types. A FunctionCall event is generated by a function call. A before event is triggered before the first instruction of the function and after the jump to the function body. An after event fires after the last instruction of the function and before the jump to the caller. The parameter ret then corresponds to the return value of the call. A ValueWrite event is generated by an assignment. A before (resp. after) event fires before (resp. after) the assignment instruction and parameter ret refers to the old (resp. new) value of the variable. A ValueRead event is generated by a variable read. A before event fires before (resp. after) the instruction that reads the variable and parameter ret refers to the value of the variable. An UpdateExpr event is generated whenever the value of an expression is changed. A before (resp. after) event e is fired before (resp. after) the update. For a before (resp. after) UpdateExpr event, parameter ret refers to the old (resp. new) value of the expression. Remark 2. In practice, FunctionCall events are captured using breakpoints and ValueWrite, ValueRead and UpdateExpr events are captured using watchpoints. An UpdateExpr event requires as many watchpoints as variables in the expression. Current debuggers hide this requirement by allowing setting watchpoints on expressions. 3.2
Modeling the Components of i-RV
We model the components of i-RV and their behaviors by giving their configurations. Our execution model is a composition of these configurations. 3.2.1 The Program. For the sake of generality, we define a platform-independent and languageindependent abstraction of a program that is loaded in memory, which allows us to apply the runtime techniques used in i-RV. The memory is abstracted as a function that maps addresses to values. Definition 3.5 (Memory). A memory m is a function in Mem = [Address → Values]. Some addresses correspond to variables of the program and are therefore linked to symbol names by the symbol table built during the compilation of the program. Remark 3. The actual type of the elements of Address does not matter. They can be seen as integers like in a real memory. Elements of Values are machine words. They are either data (values of variables) or program instructions. They can also be seen as integers. Definition 3.6 (Program). A program is a 4-tuple (Sym, mp0 , start, runInstr) where: : • Sym : Names → Address is a symbol table • mp0 ∈ Mem is the initial memory, • start ∈ Address is an address that points to the first instruction to run in the memory, and • runInstr : (Mem × Address) → (Mem × Address × (Address × B × B)∗ ) is a function that abstracts the operational semantics of the program1 . 1 The
actual semantics usually depends on the instruction set of the architecture.
, Vol. 1, No. 1, Article 1. Publication date: May 2017.
1:6 Raphaël Jakse, Yliès Falcone, Jean-François Méhaut, and Kevin Pouget Function runInstr takes the current memory and Program Counter (PC) (in Address) and executes the instruction at PC: it returns a (possibly new) memory, a new PC and a list of 3-tuples made of an address, and two booleans, representing the accesses to the memory. In an access, the two booleans hold true if the value at the given address was read and written (respectively), false otherwise. Memory accesses are used by the debugger to trigger watchpoints (see Sec. 3.2.3). Example 3.7 (Program). In the remainder of this section, we will use program P given by the following source code to illustrate the concepts: a := 0 ; b := 1 ; a := a + b Definition 3.8 (Configuration of the program). A configuration is a pair (mp , pc) ∈ Mem × Address where mp is the memory and pc is the current PC (an address in the program memory), i.e. the address of the next instruction. Example 3.9 (Configuration of the program). For program P given in Ex. 3.7, just after the execution of the second instruction, the configuration of the program is (mp , pc 3 ) where pc 3 is the address of the code that corresponds to the third instruction of P, mp [Sym(a)] = 0] and mp [Sym(b)] = 1]. 3.2.2 The Monitor. The monitor evaluates a property against a trace, giving a verdict upon the reception of each event. The verdict corresponding to the last event of the execution trace is called the final verdict [18]. Property model. We describe properties in a model based on finite-state machines. It is composed of states, transitions and an environment and it recognizes sequences of events. Transitions have guards that are expressions of event parameters and the memory and a function that can update the environment. Properties can be expressed on the whole set of events that can be retrieved from the debugger. Events are parameterized, i.e. values are linked to events. For instance, a function call generates an event parameterized with the values of arguments passed during this call, as well as values that are accessible at this time (global variables for example). Trace slicing. Some properties should hold on each instance of an object or a set of objects rather than on the global state of the program. For example, a property on good file usage must be checked on each file that is manipulated by the program. For these properties, the execution trace is sliced in a way that is similar to what is achieved by trace slicing in [8, 21]. Each slice of the trace concerns a specific instance of an object or a set of objects on which the property holds. When trace slicing is used, a monitor does not correspond to a single finite state machine but to a set of finite state machines, one for each particular instance of an object. Definition 3.10 (Monitor). A monitor is a 7-tuple (Q, Σ, init, env0 , ∆, v, S) where Q is a set of states, Σ is the set of symbolic events, env0 ∈ Env is the initial environment (Env = Names → Values, where Names is the set of variable names and Values is the set of values that can be stored in a variable), ∆ : P(Names × Names) × Q × Σ × (Env × Env → B) × (Env × Env → Env) × Q is the transition relation, v ∈ [Q → V] is the function that maps states to verdicts and S ⊆ Names is a set of parameter names on which the slicing applies. A transition is a 6-tuple (sb, qs , e f , д, upd, qd ) where sb is the slice binding of the transition, qs is the start state, e f is the symbolic event, д is the guard, upd is the “updater” and qd is the destination state. The slice binding sb is a set of pairs (p, s) where p is a name of the parameter of the function on which the slicing applies and s ∈ S is the name of the slice parameter at the level of the property. Remark 4. In practice, in most cases, p and s are equal. However, it is possible that a particular object is named differently in different functions. This is the reason why a slice binding is used
, Vol. 1, No. 1, Article 1. Publication date: May 2017.
Interactive Runtime Verification 1:7 instead of a simple parameter name: an object is uniquely identified in S (at the level of the property), and then each actual function parameter name is bound to this unique identifier. The guard д : Env × Env → B takes the environment built from the parameters of the runtime event, the environment of the monitor and returns a boolean. If it returns true (resp. false), the transition is taken (resp. not taken). The updater upd : Env × Env → Env returns an environment from the environment built from the parameters of the runtime event and the environment of the monitor. This function is used to update the environment of the property. A monitor is given in Ex. 3.11. Example 3.11 (Monitor). The property illustrated in Fig. 2 is a tuple (Q, Σ, init, env0 , ∆, v, S) where: : - Q = {Init, ready, sink}, - Σ = {e fbefore (queue_new), e fbefore (push), e fbefore (pop)}, - init = Init, - env0 = [N 7→ 0, Max 7→ 0], - v = [Init 7→ true, ready = true, sink = false], - S = {q}, - the transition ∆ is defined as ∆ = { ({(q, q)}, Init, e fbefore (new), [any 7→ true], ([size], env) 7→ env[max := size − 1], ready),
({(q, q)}, ready, e fbefore (push), [[N , Max] 7→ N < Max], (any, env) 7→ env[N + = 1], ready), ({(q, q)}, ready, e fbefore (pop), [[N , Max] 7→ N > 0], (any, env) 7→ env[N − = 1], ready),
({(q, q)}, ready, e fbefore (push), [[N , Max] 7→ N >= Max], (any, env) 7→ env, sink), ({(q, q)}, ready, e fbefore (pop), [[N , Max] 7→ N