Interactive search using indexing, filtering, browsing, and ranking. M. Worring1 , , G.P. Nguyen1 , L. Hollink2 , J. van Gemert1 , D.C. Koelma1 1 Mediamill/University of Amsterdam
[email protected] http://www.science.uva.nl/˜worring tel 020 5257521 2 Department of Business Informatics Free University Amsterdam Abstract In this presentation we present a system for interactive search. In our view interactive search is a four-step process. We have experimentally verified, using 22 groups of two participants each, how users apply these steps in the interactive search. In addition we made a user study to gain insight in the kind of users that participated.
1
Introduction
Users retrieve video shots or pictures preferably using high-level concepts [1]. The TRECVID topics do not form an exception to this observation. Most of the topics ask for a specific person or object possibly involved in some specified event, or they ask for a generic class of setting, person, or object, again probably engaged in a specific event. Hence, the primary entry point to a video archive should be a collection of high-level concepts. Due to the semantic gap [2], the collection of high-level concepts for which indices can be derived is limited. Hence, the high-level indexing only yields a broad categorization of the information space. Within one of the induced subclasses of the information space one can only use low-level indices. End-users of a search system, however, cannot be expected to define their query need in terms of such low-level indices. Therefore, image based systems often rely on query-by-example [2] to specify the query need. This is effective if one has examples to start with. Often this is not the case. For the TRECVID example images have been given, but as they are taken from different sources, their characteristics are quite different from the dataset. Therefore, to specify the query, users should select appropriate examples from the dataset itself by browsing the information space. Browsing requires a visualization mechanism that on the one hand provides an overview of the dataset, while showing sufficient detail on the other. Furthermore, the visualization should give the user an insight in the structure of the dataset. On the basis of the above observations, we decompose the interactive search task into four steps. In the indexing step, all offline analysis is performed in particular the dataset is described using high-level concepts. In the filtering step, users define an active set of shots from the full set by using the high-level concepts. Using a set of advanced visualization tools the user than browses through this active dataset to find suitable example keyframes representing shots. These example keyframes are
1
then used to construct a final ranking of the shots with respect to the query using query-by-example.
2
The processing steps
We now describe the four processing steps that are performed in more detail. The first step, the indexing, is only performed once, the other three namely filtering, browsing, and ranking can be used in an iterative fashion in the interactive search task.
2.1
Indexing
The aim in the indexing step is to provide the users with a set of high-level entry points into the dataset. Most methods still follow a unimodal approach [3]. For text this is reasonable as words are easy to relate to high-level concepts. For visual and auditory information a multimodal approach is more suited. The latter are the appropriate starting point for the feature extraction. For the experiment, we have used the high-level features as donated by CMU. These features have been developed in different ways. Some are truly multimodal e.g. the NewsSubjectMonologue, others are using only one of the modalities. The quality of the result also varies for the different features. These features form one high-level entry point. We augment the high-level features by deriving concepts from the speech recognition result using Latent Semantic Indexing. To that end, we construct a vector space by taking all words found. We then perform stopword removal using the SMART’s english stoplist. This results in an 18.117 dimensional vector space. The vector space is then reduced to 400 dimensions using Principal Component Analysis. Thus, we effectively decompose the information space into a small set of broad concepts, where the selection of one word from the concept reveals the complete set of associated words also. Furthermore, for all keyframes in the dataset we also perform low-level indexing by computing the global Lab color histograms using 32 bins for each channel. Finally, to structure these low-level visual descriptions of the dataset, the whole dataset is clustered using k-means clustering with random initialization. The k in the algorithm is set to 143 as this is the number of images our display will show to the user (11 rows of 13 keyframes) when a simple array of images is presented.
2.2
Filtering
The indexing step is performed in the off-line stage. The first step in the interactive search stage is filtering of the dataset to retrieve an active set of limited size containing shots that conform to a set of user selected high-level concepts. To select the active set, the user takes a combination of the following three query specifications: • High-level feature: which can be used a as a positive filter (feature should be present) or as a negative filter (should not be present). • Concept: specified by a user defined word and automatically related to all related words found in the LSI space. • Keyword: which must match a word in the text associated with a shot exactly. The active set is limited to be 2000 shots maximum, leading to approximately 4000 keyframes. Users can combine the query mechanism using an and function (but this usually leads to very small sets) or the ranked result is an alternation between the result obtained for the selected query specification mechanisms. 2
2.3
Browsing
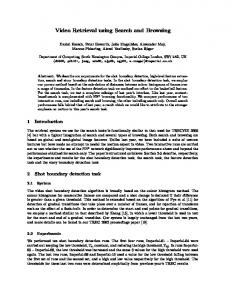
At this step in the process we assume that the user is going to select examples from within the active set. As the filtering is already based on high-level concepts the browsing step relies on low-level descriptions. In particular, search is based on the Lab histograms of the keyframes of the shots, where similarity of two keyframes is defined by the Euclidean distance of the two histograms. User should select examples based on these histograms and distances. As indicated, for browsing it is important to visualize an overview of the imformation space as well as the structure of the information space. To give the user an overview of the data the user can decide to look at the clustered data, rather than the whole dataset. In this visualization mode, the center of each cluster for which some element is present in the active set is presented on the screen. Showing the structure of the information space is complicated as we have to make a 2-dimensional display. The keyframes, however, are embedded in the highdimensional space induced by the 96 dimensions of the Lab histogram. It is the structure in this high-dimensional space that we want to visualize. A well known technique for this purpose is multi-dimensional scaling (MDS). This is a visualization techniques which displays points embedded in a high dimensional space onto the screen in such a way that the distances between points are preserved as good as possible. MDS fails when the data is clustered in non-elliptical shapes e.g. when the cluster is in the form of a spiral. To solve this problem one can use the ISOMAP algorithm [4]. This graph based technique first constructs the nearest neighbor graph in the high-dimensional space. Distance between two points is than redefined as the distance of the shortest path between the points in the graph. This distance matrix is than the input to the MDS algorithm as described above [4]. We use the above method for visualizing the set of keyframes, where a point corresponds to the center point of the keyframe. The resulting visualization preserves the structure of the high-dimensional space defined by the Lab histograms, but is presented on a 2D screen. In addition to the overview and structure based overview, users can inspect specific keyframes, see the associated text and see the keyframes of the shot and/or surrounding shots1 . On the basis of this inspection the user performs a selection operation to get a set of one or more example images. An illustration of the visualizations used is presented in figure 1.
2.4
Ranking
When the user has selected a set of suitable images, the user can perform a final ranking through query by example using again the Lab histograms with Euclidean distance. In the result the closest matches within the filtered set of 2000 shots are computed, where the system alternates between the different examples selected.
3
Experimental setup
3.1
Search protocol
The system has been evaluated by having 44 students perform the interactive search task in groups of two. Two types of sessions were held: 1 Our
system actually can also play the shot as a clip, but this was not used in the experiments as with only 15 minutes search time too much time would be spend on viewing the video clips.
3
Figure 1: Screendump of the GUI used for the browsing part of the system. On the left the 2-Dimensional display given an overview and the structure of the information space.
1. A three hour session to play around with the system and inspect the quality of the features (without knowing the search topics). 2. Search sessions in which the users search the topics with the maximum of 15 minutes enforced. Questionnaires were filled in by the students before and after topic search to analyze different factors influencing the search.
3.2
Evaluation criteria
Traditional evaluation measures from the field of information retrieval are precision and recall. Let R be the number of relevant camera shots, i.e. camera shots containing the specific semantic concept one is looking for. Let A denote the answer set, i.e. the number of camera shots that are retrieved by the classifier. Let R∩A be the number of camera shots in the intersection of the sets R and A. Then, precision is the fraction of retrieved camera shots (A) which are relevant: P recision =
R∩A A
(1)
and recall is the fraction of the relevant camera shots (R) which have been retrieved: Recall =
R∩A R
(2)
This measure is indicative for the amount of correct classifications, false positive classifications, and false negative classifications. For evaluation within TRECVID both measures are combined in an average precision, AP , measure. This singlevalued measure corresponds to the area under an ideal precision-recall curve and 4
is the average of the precision value obtained after each relevant camera shot is retrieved. This metric favors highly ranked relevant camera shots. Let L be a ranked version of A. At any given index i let R ∩ L1i be the number of relevant camera shots in the top i of L, then AP is defined as: A
AP =
1 X R ∩ L1i λ(Li ) R i=1 i
(3)
Where λ(Li ) is defined as: λ(Li ) =
½
1, 0,
if Li ∈ R; otherwise;
(4)
We used the AP evaluation measure as the basic metric for the conducted experiments.
4
Results
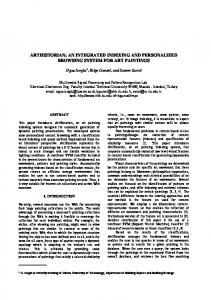
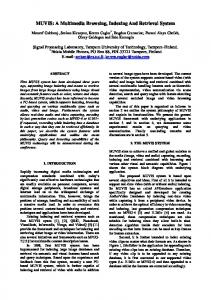
The interactive search task has been performed by 22 groups of 2 students all using the same system for 12 topics2 . Hence, we have 11 complete runs of 24 topics. As we only used one system, only one run could be submitted. We selected for each topic the group who used the select operation the most, expecting that a select would typically correspond to at least one correct item. Our selection of the ”best” run did not take into account whether examples were deselected or whether the examples should indeed be in the result set as visual inspection could have revealed. To show the overall quality of our system, we evaluated all runs that were made by the different students. Results are shown in figure 2. The results indicate that the system has higher potential than indicated by the submitted run as for some of the runs a significant improvement can be seen. Furthermore, when observing the search behavior it was revealed that in the course of the search often the average precision was even higher than the one that resulted at the end of the search session. It can also be concluded that the search method has its limitation as for most of the topics there was at least one system outperforming our system. We have made additional evaluations to understand the search behavior of students. Figure 3 and figure 4 are examples of the kind of plots we generated for evaluation purposes. The first class of plots shows the average precision as function of time where the individual actions taken by the students are shown. The second class of plots show the hits at depth 10, 30, 100, and 1000. These are also interesting, as the different depths reveal different aspects of the search method. Depth 10 is typically the one that is mostly consisting of the keyframes selected directly by the students. Depth 30 and 100 are such that all keyframes can be viewed on the screen and could hence be potentially selected. Finally, the result at depth 1000 is mostly a consequence of the query-by-example and the clustering in the visualization as it relies on keyframes not seen by the student.
5 5.1
User study Participants
The 44 Students who participated in the study were studying in Information Science or related subjects. 2 of them were females and 42 were males, ages ranged from 20 2 Note, we have numbered the topics from 1 to 25. To find the equivalent original topic in TRECVID simply add 99.
5
uva_ap_lines 1
ap submitted trec median trec max ap max ap uva median uva
Average precision
0.8
0.6
0.4
0.2
0
0
5
10
15
20
25
Topic
Figure 2: Plots of average precision.
group-6/Topic_25_ap.dat 0.8
average precision ComputeTextSelection Restart Select Unselect Feedback Saving result
0.7
Average precision
0.6
0.5
0.4
0.3
0.2
0.1
0
0
100
200
300 400 Time (seconds)
500
600
700
Figure 3: Average precision for topic 25 as function over time, including the actions taken by the students.
6
group-6/Topic_25_hit.dat 8
Hits at depth 1000 Hits at depth 100 Hits at depth 30 Hits at depth 10
7
Hits at various depths
6
5
4
3
2
1
0
0
100
200
300 400 Time (seconds)
500
600
700
Figure 4: The hits at different timepoints and varying values for the depth.
to 40 with a mean of 23 years. Before the start of the experiment they were asked to fill in a questionnaire about their prior experiences with searching for information in general and searching for multimedia items. The questions were answered on a five-point scale (for questions 1, 2, 4 and 5: 1 = never, 2 = once or twice a year, 3 = once or twice a month, 4 = once or twice a week, 5 = every day or more; for questions 3 and 6: 1 = less than a year, 2 = less than two years, 3 = two to four years, 4 = four to six years, 5 = six years or more). The results are summarized in Table 1. 1. How often do you conduct a search on world wide web search services (e.g Google, Alta Vista, Yahoo)? 2. How often do you conduct a search on specialized search systems either online (e.g. library catalogs, Amazon) or offline (e.g. Encarta)? 3. How long have you been using search systems? 4. How often do you conduct a search for multimedia items. (e.g. images, audio, video) on world wide web search services (e.g. Google, Google Image Search, Alta Vista, Yahoo)? 5. How often do you conduct a search for multimedia items on specialized search systems either online (e.g. library catalogs, Kazaa) or offline (e.g. Encarta, Corel)? 6. How long have you been using multimedia search systems? In summary, the overall experience with searching is high. All students search for information at least once a week and 92% has been searching for information for two years or more. All students search for multimedia items at least once a year, and 65% does this once a week or more. 88% of the students have been searching for multimedia for at least two years. 7
Question 1 2 3 4 5 6
N 44 44 44 43 41 43
Min Score 4 1 2 2 1 2
Max Score 5 5 5 5 5 5
Mean Score 4.75 3.34 4.00 3.70 3.61 3.30
Std. Dev .438 .987 .889 .773 1.070 .832
Table 1: Search experience of participants.
5
4
familiarity topic easy to start search
3
easy to do search
Mean answer
satisfied resuls expect high precisio
2
expect high recall 1
enough time search 1
3 2
5 4
7 6
9 8
11 13 15 17 19 22 24 10 12 14 16 18 21 23 25
Topic
Figure 5: Mean values of answers to questions per topic.
5.2
Topic questionnaires
After every topic, the students answered the following 7 questions on a five-point scale (1 = not at all, 2 = not very, 3 = somewhat, 4 = very, 5 = extremely): 1. Are you familiar with this topic? 2. Was it easy to get started on this search? 3. Was it easy to do the search on this topic? 4. Are you satisfied with your search results? 5. Do you expect that the result of this search contains few non-relevant items? 6. Do you expect that few relevant items are missing in the result? 7. Did you have enough time to do an effective search? The results are shown in figure 5. Topics 1, 11 and 19 score low on all questions.
8
6
5
Answer category
4
3
2
1 N=
42
42
Easy to use
Easy to learn
42
42
topics are similar system is similar
Question
Figure 6: Box plot of answers to four questions in exit-questionnaire, showing median, interquartile range, outliers and extreme cases.
5.3
Exit questionnaires
At the end of the session the students indicated on a five-point scale (1 = strongly disagree, 2 = disagree, 3 = neutral, 4 = agree, 5 = strongly agree) to what extend they agreed with four statements: 1. It was easy to learn to use this information system. 2. It was easy to use this information system. 3. The topics are similar to topics that I typically search for. 4. This system is similar to systems that I typically use for searching. In general, the subjects agreed that the system was easy to use, and were neutral with respect to the ease of learning. The topics and the system were both not similar to what the students had been using so far. Spearman’s rank correlation test showed a correspondence between similarity of the topics and ease of use (ρ = 0.35; p = 0.05) and between similarity of the topics and ease of learning (ρ = 0.34; p = 0.05).
6
Conclusion
We have developed an interactive search mechanism which starts with high-level concepts and then lets the user browse through the data using advanced visualization mechanisms to find examples. Final results are found using query-by-example. The results indicate that the system indeed has a rather good performance in finding information. Plots generated are extremely helpful in grasping the search paradigms used by the students employing the system for interactive search. Further analysis of the plots is underway. The current system also has a number of limitations, which are to be tackled in the coming year. First, the textual modality and visual modality are treated in different way. True integration of text, audio, and visual information is needed at all the steps in the interactive search process. Second, concerning the visualization, students often relied on the simple array of images, rather than the structure based visualization. This was mostly due to the fact that images were overlapping in 9
the display, so it was difficult to select images. We are currently optimizing the overlap of images in 2D display, while at the same time we pursue the use of 3D display mechanisms. Finally, query-by-example was based on global histograms, but a region based approach, where users select the proper region to use, would be more suited.
Acknowledgement We would like to thank Frans Verster, Jeroen van Rest, Guus Schreiber, Thang Pham, and Aristeidis Diplaros for discussions, development and other work as well as the students that participated in the interactive search task. This work is partly sponsered by the IOP MMI Project I’mIK (MMI0136).
References [1] L. Hollink, A. Schreiber, B. Wielinga, and M. Worring. Classification of user image descriptions. International Journal of Human Computer Studies, 2002. accepted pending revision. [2] A.W.M. Smeulders, M. Worring, S. Santini, A. Gupta, and R. Jain. Content based image retrieval at the end of the early years. IEEE Transactions on Pattern Analysis and Machine Intelligence, 22(12):1349–1380, 2000. [3] C.G.M. Snoek and M. Worring. Multimodal video indexing: a review of the state-of-the-art. Multimedia Tools and Applications, 2002. to appear. [4] J.B. Tenenbaum, V.De Silva, and J.C. Langford. A global geometric framework for nonlinear dimensionality reduction. Science, 290:2319–2322, 2000.
10