Interactive SIGHT into Information Graphics Seniz Demir
David Oliver
Edward Schwartz
University of Delaware
Millersville University
Carnegie Mellon University
[email protected]
[email protected]
Stephanie Elzer
Sandra Carberry
[email protected] Kathleen F. McCoy
Millersville University
University of Delaware
University of Delaware
[email protected]
[email protected]
[email protected]
ABSTRACT Information graphics (such as bar charts and line graphs) play a vital role in many multimodal documents. Unfortunately, visually impaired individuals who use screen reader programs to navigate through such documents have limited access to the graphics. This paper presents the Interactive SIGHT (Summarizing Information GrapHics Textually) system that provides visually impaired individuals with the high-level knowledge that one would gain from viewing graphics in electronic documents. The current system, which is implemented as a browser extension, works on simple bar charts. Once launched by a keystroke combination, Interactive SIGHT first provides a brief initial summary that conveys the underlying message of the bar chart along with the chart’s most significant features. The system is then able to generate history-aware follow-up responses that provide further information upon request from the user. User evaluations with sighted and visually impaired users showed that the initial summary and follow-up responses are very effective in conveying the informational content of graphics and that the system interface is easy to use.
Categories and Subject Descriptors H.5.2 [Information Interfaces and Presentation]: User Interfaces; K.4.2 [Social Issues]: Assistive technologies for persons with disabilities
General Terms Design, Human Factors
Keywords Accessibility, graph summarization, assistive technology
1.
INTRODUCTION
Due to their effectiveness in depicting quantitative data and the relations among them, information graphics (such as
Permission to make digital or hard copies of all or part of this work for personal or classroom use is granted without fee provided that copies are not made or distributed for profit or commercial advantage and that copies bear this notice and the full citation on the first page. To copy otherwise, to republish, to post on servers or to redistribute to lists, requires prior specific permission and/or a fee. W4A2010 - Technical, April 26-27, 2010, Raleigh, USA. Co-Located with the 19th International World Wide Web Conference. Copyright 2010 ACM 978-1-4503-0045-2 ...$5.00.
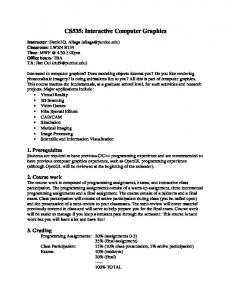
bar charts and line graphs) are widely used. In this work, we focus on information graphics from popular media such as Newsweek and USA Today. The majority of such graphics are intended to convey a message. For example the graphic in Figure 1 appeared in U.S. News and World Report and ostensibly is intended to convey that “The United States has the third highest gross domestic product per capita in 2001 among the countries listed”1 . Our corpus study of 100 randomly selected graphics from newspapers and magazines found that little or none of the graphic’s underlying message was captured by the article’s accompanying text in over 60% of the graphics [4]. Thus information graphics cannot be ignored. Moreover, as is the case for the graphic in Figure 1, captions on graphics are often very general and of limited utility in identifying the graphic’s message [7]. There has been a dramatic increase over the past decade in the amount of information available electronically. Unfortunately, many resources are provided in a format that is not readily accessible to everyone. For example, individuals with sight impairments have limited access to multimodal documents. The text of the document can be easily delivered via screen reader programs, but the document’s information graphics pose serious problems. Accessibility guidelines propose that alt text (text that conveys the content of a graphic) be included with information graphics. However, many authors and webpage designers are unaware of the accessibility problems that visually impaired people might face and do not consider making documents accessible to everyone. As a result, most electronic documents either do not include alt text or the alt text that is provided is very general and inadequate. In addition, the lack of guidance as to how information graphics should properly be described to visually impaired users still remains a limitation [2]. Therefore, techniques must be developed for providing effective access to information graphics so that all individuals can benefit from these valuable information resources. We have developed an interactive natural language system, Interactive SIGHT (Summarizing Information GrapHics Textually), whose goal is to enable visually impaired users to gain access to the content of graphics that appear in popular media. Once launched by a keystroke combination, Interactive SIGHT first provides the user with a brief summary of a bar chart with the inferred underlying message as the core content, and then responds to follow-up 1
Note that the bar for the United States is the only bar in Figure 1 that is annotated with its value and highlighted with a different color, thereby drawing attention to it.
Gross Domestic Product per Capita 2001 (In Thousands)
$40
$35
30 20 10 Luxembourg United States Japan Britain Norway Switzerland Denmark
Figure 1: Graphic conveying the rank of a bar
requests for further information from the chart. Interactive SIGHT utilizes a stereotypical user model and a dialogue history to generate different history-aware textual descriptions of a graphic. To our knowledge, our research is the first to address accessibility by providing access to the highlevel content of an information graphic. The system neither reproduces the graphic in an alternative medium (such as sound or touch) nor lists the data points in the graphic. Interactive SIGHT does not require any manual preprocessing of the graphic or any action by the webpage developer, and can be used without any special equipment or assistance from a sighted helper (only a web browser and screen reading software are required). Moreover, the system could be used to generate appropriate alt text for graphics. This paper presents Interactive SIGHT, describing how the user interacts with the system, and how the system generates the text for its initial summary and the responses to requests for follow-up information. The interactive nature of the system, its ability to respond to follow-up requests, and its ability to tailor responses to the user and the previous dialogue are enhancements over our earlier work on generating initial summaries of bar charts [11]. Section 2 discusses related work on providing visually impaired users access to graphics. Section 3 describes the overall architecture of the Interactive SIGHT system. Section 4 presents our methodology for situation-aware generation (i.e., generation based on whether the desired result is an initial summary of the graphic or a particular type of follow-up response). Finally, Section 5 discusses the results of the evaluation studies that were conducted with sighted and visually impaired users.
2.
RELATED WORK
Research has investigated alternative modalities for providing access to information graphics, such as sound [1], touch (via tactile and haptic presentations) [18] or a combination of the two [16]. However, these approaches have limitations. First, many of these systems require the use of special equipment which consequently affects the portability of the system and incurs some cost. Second, many of these systems require preparation work done by sighted individuals which limits the systems to graphics that are designed specifically for their use. Another branch of research deals with generating accessible graphics from input data or representation. Yu et al. [28] developed a web-based tool, where visually impaired users can generate virtual graphs automatically by entering data. The users can then either explore the graph using a haptic device or print its tactile version. A recent tool developed
by Goncu and Marriott [15] automatically generates tactile bar and pie charts from data given in a text file. The tool is designed to speed up the transcription of bar and pie charts that are often used in textbooks. Once given the data values depicted by a chart from a textbook, this tool generates a tactile version of the chart and hence makes that chart accessible to visually impaired students. Fredj and Duce [14] developed the GraSSML approach in order to improve the accessibility of diagrams by making their structural and semantic information available at the creation stage. The GraSSML approach, by means of its family of higher-level languages, captures the information behind a diagram and allows the generation of accessible presentations in different modalities (such as text and graphic) from that information. Although these previous works demonstrated the usefulness of their overall approach, they are not addressing the problem of making graphics that are already available on the web accessible to visually impaired users. Some researchers have considered constructing textual summaries of graphics. The system developed by Kurze [19] generates a description of the properties of a diagram such as the labels and ranges of the axes, and the number of data sets. The description of the diagram is then read to the user by a text to speech device. The user can also access the values depicted in the diagram. iGraph-Lite [12] is another language-based accessibility system, whose main objective is to make the information in a graphic accessible to visually impaired users through interactive communication. The system interacts with the user in two ways. First, the user can receive a brief template-based summary of what the graph looks like (such as the caption of the graph, and the maximum and minimum values of the graph). Second, the user can explore the graph via keyboard commands that provide more specific information about the graph such as the values of all points depicted in the graph. Unfortunately, these approaches do not provide the high-level content of a graphic and require the user to build a “mental map” of the graph, which can be very difficult for congenitally blind users [16]. Our system addresses access to graphics in settings that are different from other approaches. Tactile and haptic presentations or other data-driven approaches are particularly useful for analyzing scientific graphics (in science, math, and engineering), where the user needs to analyze the graphic in depth and where the time and expense spent for constructing the presentation are reasonable. However, our work focuses on graphics from popular media where the underlying message of the graphic and how it relates to the article are most important (required for full understanding of the article). Our interviews with visually impaired users indicate that they ignore the graphics in such articles because systems are not available that provide the kind of inexpensive, real-time access that they require. Interactive SIGHT, to our best knowledge, is the only one to start from a graphical image (as opposed to the underlying data) and provide users with inexpensive and relatively quick access to the knowledge that one would gain from viewing the graphic, thereby enabling effective use of this information resource.
3. SYSTEM ARCHITECTURE 3.1 Design Issues Interactive SIGHT is intended for users reading electronic articles from popular media. In many cases, a user will only
Figure 2: System architecture be interested in the high-level content of a graphic and not in its details. In such cases, conveying all of the informational content of a graphic at once would overwhelm the user, and in most cases many details would be conveyed that the user has no interest in. On the other hand, some users might want access to more detailed information from the graphic. Our system addresses these challenges by providing two facilities: one for generating a brief initial summary of the graphic and another for handling follow-up requests for further information. The current implementation of the system handles only simple bar charts; however, we believe that the overall framework and the underlying concepts are extensible to other kinds of graphics. In [22], it was observed that when participants were asked to write brief summaries of line graphs, their summaries consisted of the underlying message and the visually salient features of the graphic. These observations have influenced the design of Interactive SIGHT. The core of the initial summary produced by Interactive SIGHT is the graphic’s underlying high-level message (recognized by an inference system [9]); this message and salient characteristics of the graphic affect the selection of additional propositions for inclusion in the initial summary. Human subject experiments [25] revealed that since congenitally blind individuals have never seen bar charts before, they often cannot identify what other kinds of information they might request after receiving an initial summary. In other words, they did not know what further information was likely depicted in the bar chart, and thus they did not know what additional questions they could ask. To address the needs of people who are congenitally blind, Interactive SIGHT uses a menu-based interface, where requests for different kinds of follow-up information are presented as options and can be selected by end users in any order. The rest of this section describes the individual components of Interactive SIGHT whose architecture is shown in Figure 2.
3.2 The Browser Helper Object The user interface of the system is implemented as a Browser Helper Object (BHO) [11] that runs inside the process space of Microsoft Internet Explorer. The browser helper object currently works with Freedom Scientific’s JAWS screen reader, which is the most widely used screen reading soft-
ware [20]. However, the methodology could easily be adapted to work with other screen readers as well as other web browsers. When a webpage is opened in the browser, the BHO scans all of the graphics on that page. If a graphic is identified as a bar chart, the BHO inserts the graphic into the tab order of the page and appends “This is a bar chart. Press CONTROL and Z to determine the initial summary.” to the alt text of the graphic to ensure that the user will be alerted to its presence during the navigation. JAWS then starts reading the content of the page from top to bottom, including the alt texts (if any) associated with the graphics. When JAWS reaches a graphic during the navigation, the user can launch the system using a keystroke combination (CONTROL+Z). In the current implementation, if the graphic in focus is not a bar chart, the message “The selected graphic does not appear to be a bar chart” is read to the user. Otherwise, the BHO sends the user’s request to the Interaction Module which launches other system components to return the initial summary of the bar chart for presentation to the user. The BHO then accepts follow-up requests for further information about the chart, and presents the response generated for each request along with the navigation options that are available at the current exchange of the dialogue. All system responses and navigation options are read to the user by JAWS. This continues until the user decides to return to reading the webpage.
3.3 Interaction Module The Interaction Module (IM) is in charge of managing the interaction with the user. It receives requests from the Browser Helper Object, such as a request for an initial summary or a request for a particular type of follow-up information. The Interaction Module then calls the other modules to eventually obtain the text (produced by the Generation Module) that is returned to the Browser Helper Object for presentation to the user as an initial summary or as a response to a request for follow-up information. The Interaction Module also records the communicated propositions in a dialogue history, so that the Generation Module can relate the current response to the previous discourse. The next sections describe the various modules that are called and provide results to the Interaction Module.
3.4 Visual Extraction Module The Visual Extraction Module (VEM) [5] is called by the Interaction Module to analyze a graphic image sent by the BHO and uses very simple image processing techniques (similar to the work by Redeke [24]) to determine whether that graphic contains particular graphical elements (such as bars and axes) that identify it as a bar chart. If the graphic appears to be a bar chart, the VEM module creates an XML representation specifying the components of that graphic, such as the height and color of each bar, any annotations on a bar, the caption of the graphic, etc. This module currently handles vertical and horizontal bar charts that are clearly drawn with specific fonts and no overlapping characters. The charts can have a variety of textual components such as axis labels, caption, further descriptive text, and text inside the graphic. The current implementation cannot handle 3D charts, charts where the bars are represented by icons, or charts containing texts at multiple angles, but the work to overcome these restrictions is continuing2 . The VEM sends the XML representation of the graphic to the Intention Recognition Module.
3.5 Intention Recognition Module The Intention Recognition Module is responsible for recognizing the graphic’s intended message by reasoning about the communicative signals present in the graphic [9]. Three kinds of communicative signals that appear in simple bar charts have been identified. The first kind of signal is the relative effort required for various perceptual and cognitive tasks. The Intention Recognition Module adopts the AutoBrief [17] hypothesis that the graphic designer chooses the design that best facilitates the perceptual and cognitive tasks that a viewer will need to perform on the graphic in order to recognize its communicative goal. Thus, the relative effort for different perceptual tasks serves as a communicative signal about what message the graphic designer intended to convey. A set of rules are used for estimating the effort required to perform different perceptual tasks on simple bar charts; these rules were validated by eyetracking experiments [10]. The second and the third communicative signals used in the system are highlighting of objects in the graphic (such as the highlighting of the bar for United States in Figure 1) and the presence of certain verbs and adjectives in the caption that suggest a particular message category. These communicative signals are entered into a Bayesian network as evidence. The Bayesian network is dynamically constructed for each new graphic; the top level captures each of the twelve message categories that have been identified as the kinds of messages that can be conveyed by a bar chart (such as conveying an increasing trend or conveying the rank of a bar) and the children of these nodes capture alternative instantiations of the parameters for each message category. The Intention Recognition Module selects the message category and parameter instantiations with the greatest probability as the graphic’s intended message. For the graphic in Figure 1, this module recognizes that the graphic’s underlying message is that the United States ranks third with respect to the gross domestic product per capita in 2001 among the countries listed and produces a logical representation of this message (i.e., Rank Bar(United 2 To our knowledge, no existing accessibility system can handle these kinds of graphics either.
States,third,highest)). The logical representation of the inferred message and the XML representation of the bar chart are returned to the Interaction Module.
3.6 Generation Module The Interaction Module passes the logical representation of the graphic’s message, the graphic’s XML representation, and the kind of user request (in the case of a follow-up response) to the Generation Module (GM), which is responsible for selecting appropriate content for the current response. The selected content is organized and realized into a response by using a bottom-up generation approach [8]. This module returns the realized text to the Interaction Module, which then passes it to the Browser Helper Object for presentation to the user. The next section describes our generation methodology.
4. SITUATION-AWARE GENERATION A user who navigates through a webpage can start interacting with our system by pressing “CONTROL+Z” when encountering a chart. In such cases, the user first receives the initial summary of the chart and then responses to each request for follow-up information. This section discusses our methodology for generating these textual descriptions, including how the previous discourse is taken into account and how the architecture facilitates user-tailored responses. As examples, we show how our system behaves in a scenario where the user wants access to the bar chart in Figure 1.
4.1 Initial Summary To develop a mechanism for selecting appropriate content for an initial summary, we [8] first identified the set of propositions (PROP ALL) that capture information that someone might extract by looking at a simple bar chart (such as “the rate of change of the trend”). Because the number of propositions is large, we conducted a set of formal experiments, where 21 bar charts with different message categories were presented to twenty graduate students along with a subset of the identified propositions. The participants were asked to classify the propositions into one of three classes according to how important they felt it was to include that proposition in the initial summary: essential, possible, and not important. For each message category, we analyzed the sets of highly-rated propositions identified for the graphics associated with that message category. The results of the experiments led us to construct content identification rules specifying what should be included in the initial summary for an underlying message category based on the visual features present in a bar chart. The following is a representative content identification rule that is applicable to a graphic such as that in Figure 1 whose primary message (Rank Bar) is to convey the rank of a bar among the other bars listed: • If (message equals ‘rankbar’) and (value (bar in focus) close to value (maximum bar)) then include (propositions indicating the rank and value of the maximum bar) Consider the dialog window in Figure 3-a, which shows the initial summary generated by our system for the graphic in Figure 1. Since system responses appear in a text window, users could either listen to responses via JAWS screen reader or read them via a screen magnifier. In addition to the generated response, each dialog window presents a set
Gross Domestic Product per Capita 2001 This graphic is about United States. The graphic shows that United States at 35 thousand dollars is the third highest with respect to the dollar value of gross domestic product per capita 2001 among the countries listed. Luxembourg at 44.2 thousand dollars is the highest.
Figure 3: a) Initial summary of navigational menu options (buttons). To ease the interaction of users with the system, each navigational button is also associated with a unique keyboard accelerator. Users who are totally blind can tab to move through the menu options (which are read to them by JAWS) and press the space bar to choose the active option, or can activate an option by pressing its associated keyboard accelerator. Users with low-vision who use screen magnifiers can also activate a menu option by clicking its corresponding button. By choosing one of the options presented in the dialog window shown in Figure 3-a, the user can either obtain further information about the chart via follow-up responses (Main Menu button or “Shift+M” keystroke combination), reread the initial summary (ReRead button or “Shift+R” keystroke combination), or end the interaction with the system and return to the webpage (Exit button or “Shift+E” keystroke combination). If the user chooses the “Main Menu” option, the main follow-up window shown in Figure 3-b is presented. That window allows the user to request different kinds of follow-up responses from the system.
4.2 Follow-up Responses After the initial summary of a bar chart has been presented, there are still many propositions that have not been conveyed to the user from among the set of identified propositions (PROP ALL). Moreover, a particular user may be interested in only a subset of the available information. Since congenitally blind individuals might not know what kinds of questions can be asked about a chart, we provided a facility that would both guide them and avoid issues in understanding free-form questions. We have incorporated three different kinds of follow-up responses in Interactive SIGHT which are presented as options in the main follow-up window as shown in Figure 3-b: General, Focused, and Specific. Our goal was to provide access to the available information about a bar chart in varying detail and to allow users to determine and focus on the information of interest to them. The user could request a general follow-up response by clicking the “General Information” button or pressing “SHIFT +G”, if he simply wants to receive additional information about the graphic without specifying any preferences. In order to provide users the option to focus on a particular category of further information, we defined different kinds of focused follow-up responses. For each message type that can be recognized by the system, we identified the propositions that are relevant and classified these propositions into a number of different categories with respect to the kind of information they convey. For example, for graphics that convey the rank of a bar such as the graphic in Figure 1, if
b) Main follow-up menu the user clicks the “Focused Information” button or presses “SHIFT+F” in the main follow-up window, three focused follow-up categories are offered to the user as shown in Figure 5-a. These options are discussed later in the paper. The third category of follow-up response, specific followup, is appropriate if the user knows specifically what information he wants (such as “The gross domestic product per capita for Denmark in 2001” in Figure 1). This information might not be directly related to the graphic’s message or might not necessarily be part of the highly-rated propositions conveyed in the summary or in the first two kinds of follow-up responses. The system’s response to a specific follow-up might be augmented with additional salient propositions related to the information that was requested. If the user clicks the “Specific Information” button or presses “SHIFT+S” in the main follow-up window, specific followup categories that are common to all message types are presented to the user as shown in Figure 6-a. If the user selects one of these options, such as “Value and Rank of Single Bar”, he is prompted to indicate the bar of interest.
4.2.1 Content Selection for Follow-up Responses Our content selection approach ranks the propositions with respect to how important they are to be conveyed in a follow-up response at the current exchange so that the most highly-rated of these propositions can be selected for inclusion. Simply ranking propositions based on their a priori importance (which were obtained from the experiment described in Section 4.1) is likely to lead to a follow-up response that does not cohere because it may contain unrelated propositions or fail to communicate information normally communicated together or contain redundant information. Instead, we developed a more sophisticated graphbased ranking algorithm which utilizes an undirected weighted graph (relation graph). In a graph-based setting, we represent the possible propositions (PROP ALL) as vertices and the relations between propositions as edges. We construct a different relation graph for each message type that can be recognized by the system because different propositions are applicable to each message type. In the current implementation, we define four relation classes such as the Redundancy Relation, which expresses a relation between two propositions if they provide similar kinds of information in different terms or the information provided by one of the propositions can be deduced from the information provided by the other proposition (e.g., “the overall amount of change in the trend” can be deduced from “the range of the values in the trend”). We classify all relations between propositions into one of these four classes and assign dif-
ferent numeric scores to each class, which in turn specify the weights of the edges in the graph. The weight of a relation indicates how important it is to convey the propositions sharing that relation in the same response. We also incorporate a stereotypical user model in this graph-based setting to assess the a priori importance of the propositions. Within this graph-based setting, the task of ranking propositions is transformed into the problem of first determining the importance of each vertex and then ranking vertices accordingly. We use the weighted PageRank metric [3, 26] as the basis for our ranking approach, which calculates the importance of a vertex by taking into account the importance of all other vertices and the relation of vertices to one another. Our approach iteratively runs PageRank and makes proper adjustments on the edges of the relation graph after each iteration in order to favor the selection of related propositions in the same response as well as discouraging the selection of propositions that are unrelated or that convey redundant information. Other novel features of this approach (described below) also provide our system the ability to generate successive history-aware texts and the flexibility to generate different texts with different parameter settings.
4.2.2 Content of General Follow-up Responses Once the user requests a general follow-up response, Interactive SIGHT ranks the propositions using the content selection approach and organizes the most highly-rated propositions into a response. The number of propositions conveyed in a response is currently set to four. An extra proposition is added if there is a single leftover proposition. For the graphic in Figure 1, if the user requests a general followup response after receiving the initial summary, our system generates the response shown in Figure 4.
The dollar value of gross domestic product per capita 2001 is 25 thousand dollars for Britain, which has the lowest dollar value of product per capita 2001. United States has 1.4 times more product per capita 2001 than Britain. The difference between the dollar value of gross domestic product per capita 2001 for United States and that for Britain is 10 thousand dollars.
Figure 4: General follow-up response after summary
4.2.3 Content of Focused Follow-up Responses Once the user requests a focused follow-up response and selects one of the categories that are applicable to the graphic, Interactive SIGHT ranks the propositions and presents the most highly-rated propositions classified in that category as a response. For example, for graphics that convey the rank of a bar (such as the United States in Figure 1), we define three focused follow-up categories (as shown in Figure 5a), where the bar in focus is the bar whose rank was the intended message of the graphic: • A comparison of the bar in focus with the bars that have the highest and the lowest values • A comparison of the bar in focus with the bar that has the closest higher value, and a comparison of the value of the bar in focus with the average value for all bars
• More information about all bars listed in the graphic If the user is interested in the first focused follow-up category after receiving the initial summary of the graphic in Figure 1, Interactive SIGHT generates the response shown in Figure 5-b.
4.2.4 Content of Specific Follow-up Responses The specific category of follow-up responses allows the user to get down to the detailed information about individual bars in a bar chart. Once the user requests a specific follow-up response, he should select one of the four kinds of specific follow-up responses that are defined for all message types (as shown in Figure 6-a). The user can either receive more information about all bars, a group of bars, or a single bar, or can compare two bars. For example, consider again the graphic in Figure 1. If the user requests specific follow-up after receiving the initial summary and clicks on the first button in Figure 6-a to indicate his desire to learn the dollar value of gross domestic product per capita in 2001 for all countries, Interactive SIGHT generates the response shown in Figure 6-b3 . For the other kinds of specific followup responses, the user needs to specify which bar or bars he is interested in. For example, if the user requests the value and rank of a particular bar (by clicking the third button in Figure 6-a), all bars in the chart are listed as radio buttons in a separate window and the user is asked to select the bar that is of interest to him before a response is generated by the system. In contrast to other kinds of follow-up responses, no ranking takes place in this follow-up and all propositions that are of interest to the user are presented.
4.3 History Awareness To be able to mimic human interactions, a dialogue system needs to keep a dialogue history and a user model which are heavily used while generating utterances [6, 13]. Utterances that are generated without exploiting the previous discourse seem awkward and unnatural [23]. Our system keeps a dialogue history to relate the current response to the initial summary and any previous follow-up responses in order to omit information that has been conveyed recently, to determine when repetition of previously communicated information is appropriate, and to use discourse markers to signal repetitions. For example, after receiving the initial summary of a graphic, the user might request a focused follow-up, whose response would realize a piece of information which has already been given in the initial summary. Our system then needs to determine whether that information should be omitted or repeated in the response, and to mark the repeated information if it is included. To generate history-aware responses, we adjust the weights on the edges of the relation graph to give preference (all other factors being equal) to propositions that have not yet been communicated in a response. Thus, if a proposition was included in a response, we penalize the edges connected to the vertex corresponding to that proposition in order to reduce its ability to compete for inclusion in subsequent responses. We treat propositions which share a Redundancy Relation with a selected proposition in the same manner; we argue that it is reasonable to assume that these 3
In the current implementation, the repetition of propositions that were conveyed earlier is signalled with the discourse marker “Recall that”.
The dollar value of gross domestic product per capita 2001 is 25 thousand dollars for Britain, which has the lowest dollar value of product per capita 2001. The dollar value of this product per capita 2001 for United States is 79.2 percent of that for Luxembourg. United States has 1.4 times more product per capita 2001 than Britain.
Figure 5: a) Main focused follow-up menu
b) Focused follow-up response after summary
Recall that Luxembourg has the highest dollar value of product per capita 2001. The dollar value of gross domestic product per capita 2001 is 44.2 thousand dollars for Luxembourg, 38.3 thousand dollars for Norway, 35 thousand dollars for United States, 34.8 thousand dollars for Switzerland, 33.3 thousand dollars for Japan, 30.8 thousand dollars for Denmark, and 25 thousand dollars for Britain. Britain has the lowest dollar value of product per capita 2001.
Figure 6: a) Main specific follow-up menu propositions were also conveyed in that response since they provide information similar to the communicated proposition but in different terms. Our ultimate goal is to encourage the system to preferably select propositions that haven’t been conveyed before and to repeat a previously communicated proposition only when it is appropriate. In the rest of this section, we show how our system behaves in different scenarios where it is engaged in a dialogue with the user to convey more information about the graphic in Figure 1. For the graphic in Figure 1, if the user (after receiving the initial summary shown in Figure 3-a) requests the first category of focused follow-up shown in Figure 5-a and receives the response shown in Figure 5-b, and then requests a general follow-up response, Interactive SIGHT generates the response shown in Figure 7.
The graphic lists the countries Luxembourg, Norway, United States, Switzerland, Japan, Denmark, and Britain. The dollar value of gross domestic product per capita 2001 is 38.3 thousand dollars for Norway, which has the second highest dollar value of product per capita 2001. The dollar value of this product per capita 2001 is 34.8 thousand dollars for Switzerland, 33.3 thousand dollars for Japan, and 30.8 thousand dollars for Denmark.
Figure 7: General follow-up response after summary and the focused follow-up response in Figure 5-b In this scenario, the focused follow-up response in Figure 5-b conveys the dollar value of gross domestic product per capita in 2001 for Britain along with its rank, and its relative difference from that for United States. Once these propositions are presented to the user, the edges connected to their corresponding vertices are penalized. These
b) Specific follow-up response after summary adjustments eventually change the rankings of all propositions which in turn make the system convey the highly-rated propositions in the general follow-up response shown in Figure 7, which differ from the propositions included in the general follow-up response in Figure 4 (which immediately followed the initial summary in that scenario). In our next scenario, we reverse the order of the requests; now the user consecutively receives the initial summary and the general follow-up response (shown in Figure 4) for the graphic in Figure 1, and then requests the first category of focused follow-up. Since the information about the dollar value of gross domestic product per capita in 2001 for Britain was recently conveyed in the previous general followup response, Interactive SIGHT omits the facts related to Britain (which were conveyed in the scenario associated with Figure 5-b) and instead generates the focused follow-up response shown in Figure 8.
Recall that the dollar value of gross domestic product per capita 2001 is 35 thousand dollars for United States, which has the third highest dollar value of product per capita 2001, and is 44.2 thousand dollars for Luxembourg, which has the highest dollar value of product per capita 2001. The dollar value of this product per capita 2001 for United States is 79.2 percent of that for Luxembourg.
Figure 8: Focused follow-up response after summary and the general follow-up response in Figure 4
4.4 User Model One notable feature of Interactive SIGHT is that its architecture enables the generation of user-tailored follow-up responses given a user model. Like many other generation
systems such as COMIC [13] and MATCH [27], Interactive SIGHT incorporates a user model that assesses the a priori importance of the propositions that might be communicated, thereby reflecting the preferences of a stereotypical user. However, after a number of interactions with a user, we might collect a user model showing the kinds of information which that user is most interested in and leverage this information as the a priori importance of the propositions. This would lead our system to generate responses which are tailored to that user. Consider a scenario where a user has the tendency to request a comparison of the entity whose rank is emphasized in the graphic with the entity which has the closest higher value. We can reflect this tendency by increasing the a priori importance of the propositions related to that comparison. In this case, for the graphic in Figure 1 where United States is the country whose rank is emphasized and Norway is the country with the closest higher value, Interactive SIGHT would generate the general follow-up response shown in Figure 9 after presenting the summary of the graphic; this follow-up response includes the comparison without the user having to explicitly request it.
The dollar value of gross domestic product per capita 2001 is 38.3 thousand dollars for Norway, which has the second highest dollar value of product per capita 2001. Norway has 1.1 times more product per capita 2001 than United States. The difference between the dollar value of gross domestic product per capita 2001 for Norway and that for United States is 3.3 thousand dollars.
Figure 9: General follow-up response after summary We could also adjust the kinds and weights of relations used in the relation graph in order to capture a user’s preferences. For example, if the user is more interested in receiving propositions conveying contrasting information (such as the maximum and minimum values presented in a bar chart), we could assign a higher numeric score to the edges reflecting a contrast relation. As a result, the ranking of the propositions for follow-up responses would be different.
5.
USER EVALUATIONS
We conducted two different evaluation studies to evaluate the effectiveness of our overall methodology in enabling users to gain access to the content of bar charts. In the first study, we focused on the informational content of the initial summary and general follow-up responses. Our goal was to determine how effective Interactive SIGHT is in identifying the information that should be conveyed about a bar chart, and organizing and presenting this content to end users. Since the study involved evaluating the system’s responses for different bar charts, sighted individuals were used for the study. 19 sighted individuals (graduate students) participated in the study. Each of the participants was first informed about the goal and the overall structure of our system. The participants were told that the initial summary should include the most important information that they thought should be conveyed about the graphic and the remaining pieces of information should be conveyed via general follow-up responses. They were also told that the informa-
tion in the first follow-up response should be more important than the information that appears in subsequent follow-up responses. In order to restrict the participants to evaluating only the content of system responses but not the usability of the system, the participants were presented with the responses generated by our system in a paper-based setting. Twelve graphics from different newspapers and magazines were used in the experiments, and three graphics among these were presented to each participant. For each of the graphics, the participants were first given the initial summary of the graphic which is generated by Interactive SIGHT. They were then shown the graphic and asked to specify whether or not they were suprised or felt that the summary was misleading. The participants were also asked to specify if there was anything omitted that they thought was important enough that it should have been included in the initial summary. None of the participants thought that the content of the summaries were misleading. In addition, the responses of the participants indicated that there was no consensus regarding omitted propositions that should have been included. Thus, we conclude that our system constructs appropriate initial summaries. Subsequently, the participants were given two consecutive general follow-up responses which were generated by Interactive SIGHT to convey further information about that graphic. They were then asked to specify whether or not any part of the responses should be communicated earlier or omitted, and to evaluate the system on the basis of their satisfaction with the responses (from 1 to 5 with 5 being the best). Within this context, the score given by a participant measured how satisfied the participant was with the content, organization and realization of the responses as a whole. The participants gave the system an average rating of 3.7 out of 5. The average score given by a participant ranged from 2.33 to 5. Some of the participants even commented that we provided more information than they could easily get from just looking at the graphic. Verbosity was most often cited as the main reason for lower scores being assigned to the output. Since the 3.7 average rating of the system is much closer to the high end of the rating scale than to the low end, the results of this study show that our system is effective in identifying the information that should be conveyed about a bar chart and appropriately presenting this information. Our goal in the second study was to determine the effectiveness of Interactive SIGHT in providing visually impaired users with the important knowledge that should be gleaned from the graphic. In this task, we asked visually impaired participants to use our system in order to answer key questions about the informational content of a bar chart. In order to identify the key questions that reflected the most important knowledge that one should glean from a graphic, we conducted a series of experiments with 17 sighted individuals, who didn’t participate in the first study. We used twelve bar charts from popular media with different intended messages and presented four of these graphics to each participant. For each graphic, the participants were asked to construct and provide the answers to three questions that they believed were the most important questions that one should be able to answer after viewing that graphic. When constructing questions, the participants were totally unaware of the content of the responses generated by our system for those bar charts (i.e., they based the question/answer pairs only on the graphic itself and had no knowledge of our sys-
tem). We then presented the graphics along with the list of collected questions to two graduate students who have expertise in natural language processing. For each graphic, these students were asked to eliminate the questions which they believed could not be answered solely from the bar chart. Questions which weren’t eliminated by either of these graduate students and were most often asked by the participants were identified as key (or important) questions. For example, the following are three representative key questions that we obtained for the graphic in Figure 1: • What is the gross domestic product per capita for United States in 2001? • Which country had the highest gross domestic product per capita in 2001? • What is the gross domestic product per capita for Britain in 2001? Seven visually impaired users participated in our second study. The participants had varying degrees of vision, but none could view the graphics without substantial magnification (which then allowed them to see only small pieces of a graphic at a time). The participants who were totally blind used the JAWS screen reader during the experiment. Prior to the start of the experiment, the participants were informed about the interaction modalities provided by the system and instructed on how to interact with the system. For the experiment, we used three graphics with different underlying message types. For each of these graphics, the participants were presented with three key questions, which were the top three most often asked questions from among the key questions identified for that graphic; the participants were then asked to use our system in order to answer these questions. The study concluded with an interview, consisting of a mix of open-ended and quantitative questions, regarding the participants’ thoughts about the overall system and the content and presentation of the responses. All participants correctly answered all of the key questions presented to them. The results of this study showed that our system effectively enabled these users to gain access to the content of these graphics in that they could obtain the information that seems most important to sighted individuals. For some of the key questions, the participants utilized only the information provided in the initial summary to find the correct answer, but they often requested a couple of follow-up responses to answer all of the questions presented to them. It is particularly noteworthy that the participants requested all three kinds of follow-up responses during their interaction with the system, and each participant followed a different path (the order and kinds of follow-up responses) while obtaining further information about the same bar chart. The responses that we received from the participants during the interviews were overwhelmingly positive, and they expressed satisfaction with the overall methodology, the interaction modalities provided to them, and the language of responses. The participants were very excited about the possibility of being able to access the content of graphics and the flexibility of requesting different kinds of follow-up responses. For example, one participant remarked that, “I think that having a system that can describe bar charts to blind and visually impaired users is an extremely valuable resource. If this program had been available to me, I would have had the ability to function as everyone else would.”. All participants also noted that they would use Interactive
SIGHT if it was available for use in everyday web browsing so that they do not have to ignore the graphics while navigating the web. Two of the interview questions were numerical in nature: • On a scale of 1-10 with 1 being not useful at all and 10 being extremely useful, how useful would this system be in providing the content of a bar chart? • On a scale of 1-10 with 1 being extremely difficult and 10 being extremely easy, how easy was it to use the system? The users gave the system an average rating of 9.4 with respect to its usefulness. The average user rating for the ease of use of the system was 8.7. We received valuable feedback from the participants on how to improve the system’s ease of use. For example, one of the participants who used screen magnification software mentioned that the radio buttons presented in a dialog window were hard to see and click on. We are planning to make changes in the presentation of the radio buttons (such as making them bigger or coloring them with a different color) in order to make them stand out more from the background. In designing the user interface, we applied various accessibility recommendations to the layout and navigational elements. In the second study, we also analyzed the impact of our design choices. For example, visually impaired users commonly navigate through webpages via either listening to the entire page before moving on or directly searching for particular items on the page using the TAB key [21]. For those users who prefer to listen to the entire page, pages with too many links and buttons undoubtedly take a significant amount of time. In the current implementation, we limit the number of buttons in a dialog window to seven or less. In our studies, we observed that the participants navigated through each button at least twice before making their decisions. Thus, our decision to limit the number of buttons in a dialog window makes it easier to remember the choices associated with the buttons and probably reduces the time spent in each window. We also took the results of accessibility studies into account in designing the layout of the windows and the navigation opportunities between them. Individuals with sight impairments often tend to memorize the layout of a webpage so that they can later navigate through that page easily. To enable our users to become familiar with the design of the interface, the layout of each window and the placement of the navigational buttons in different windows are the same. To aid our users in remembering the keyboard accelerators, buttons that perform the same operation in different windows are associated with the same keyboard accelerator. For example, if the user presses “SHIFT+M” at any point, the system will display the main follow-up menu which is shown in Figure 3-b. All of our participants were satisfied with the layout of the dialog windows and excited about having different ways of navigating through these windows.
6. CONCLUSION Articles from popular media often contain information graphics. Unfortunately, these graphics are not readily accessible to individuals with visual impairments. We contend that providing alternative access to what the graphic looks like is not enough. Instead, for graphics in popular media, the user should be provided with the message and knowledge that one would gain from viewing the graphic in order
to enable effective and efficient use of this information resource. Our Interactive SIGHT system is the first to address accessibility by providing access to the high-level knowledge conveyed by a graphic while enabling the user to obtain more detailed information if desired. Interactive SIGHT first provides a brief initial summary of a bar chart which captures the underlying message of the graphic along with its most important and significant features, and then responds to different kinds of follow-up requests for further information about that graphic. User evaluations showed that the system responses (summary and follow-up responses) are effective in providing visually impaired people with access to the knowledge conveyed by charts. In addition, visually impaired individuals found the system very useful and easy to use. Although the current implementation handles only bar charts, the work on extending the system to line graphs and grouped bar charts is under way using the same general methodology. We consider other possible directions towards further developments of this work. For instance, some graphs can be deliberately misleading, such as by starting the bottom of the y-axis at some point other than zero. We will address this in future work by taking the intent to mislead the viewer into account in our initial summaries.
7.
ACKNOWLEDGEMENTS
[11]
[12]
[13]
[14]
[15] [16]
[17]
This material is based upon work supported by the National Institute on Disability and Rehabilitation Research under Grant No. H133G080047.
[18]
8.
[19]
REFERENCES
[1] J. L. Alty and D. Rigas. Exploring the use of structured musical stimuli to communicate simple diagrams: the role of context. International Journal of Human-Compututer Studies, 62(1):21–40, 2005. [2] H. K. Ault, J. W. Deloge, M. J. Morgan, and J. R. Barnett. Web accessibility of statistical data for blind and low vision users. In the Proc. of CWUAAT, 2002. [3] S. Brin and L. Page. The anatomy of a large-scale hypertextual web search engine. Computer Networks and ISDN Systems, 30(1–7):107–117, 1998. [4] S. Carberry, S. Elzer, and S. Demir. Information graphics: An untapped resource for digital libraries. In the Proc. of SIGIR, 2006. [5] D. Chester and S. Elzer. Getting computers to see information graphics so users do not have to. In the Proc. of ISMIS, 2005. [6] J. Chu-Carroll. Mimic: an adaptive mixed initiative spoken dialogue system for information queries. In the Proc. of the 6th Conference on Applied Natural Language Processing, 2000. [7] M. Corio and L. Lapalme. Generation of texts for information graphics. In the Proc. of ENLG, 1999. [8] S. Demir, S. Carberry, and K. F. McCoy. Generating textual summaries of bar charts. In the Proc. of INLG, 2008. [9] S. Elzer, S. Carberry, I. Zukerman, D. Chester, N. Green, and S. Demir. A probabilistic framework for recognizing intention in information graphics. In the Proc. of IJCAI, 2005. [10] S. Elzer, N. Green, S. Carberry, and J. Hoffman. A Model of Perceptual Task Effort for Bar Charts and its Role in Recognizing Intention. International
[20]
[21]
[22]
[23]
[24] [25]
[26]
[27]
[28]
Journal on User Modeling and User-Adapted Interaction, 16(1):1–30, 2006. S. Elzer, E. Schwartz, S. Carberry, D. Chester, S. Demir, and P. Wu. A browser extension for providing visually impaired users access to the content of bar charts on the web. In the Proc. of WEBIST, 2007. L. Ferres, P. Verkhogliad, G. Lindgaard, L. Boucher, A. Chretien, and M. Lachance. Improving accessibility to statistical graphs: the igraph-lite system. In the Proc. of ASSETS, 2007. M. E. Foster and M. White. Assessing the impact of adaptive generation in the comic multi-modal dialogue system. In the Proc. of IJCAI Workshop on Knowledge and Reasoning in Practical Dialogue Systems, 2005. Z. B. Fredj and D. A. Duce. Grassml: accessible smart schematic diagrams for all. Universal Access in the Information Society, 6(3):233–247, 2007. C. Goncu and K. Marriott. Tactile chart generation tool. In the Proc. of ASSETS, 2008. A. Kennel. Audiograf: A diagram-reader for the blind. In the Proc. of the 2nd Annual ACM Conference on Assistive Technologies, 1996. S. Kerpedjiev and S. Roth. Mapping communicative goals into conceptual tasks to generate graphics in discourse. In the Proc. of IUI, 2000. S. E. Krufka and K. E. Barner. A user study on tactile graphic generation methods. Behaviour and Information Technology, 25(4):297–311, 2006. M. Kurze. Giving blind people access to graphics. In the Proc. of the Software-Ergonomie Workshop, 1995. C. Law, J. Jacko, and P. Edwards. Programmer-focused website accessibility evaluations. In the Proc. of ASSETS, 2005. B. Leporini and F. Paterno. Testing the effects of web usability criteria for vision impaired users. In Technical Report - ISTI - C.N.R., 2004. K. F. McCoy, S. Carberry, T. Roper, and N. Green. Towards generating textual summaries of graphs. In the Proc. of HCI, 2001. J. D. Moore. Indexing and exploiting a discourse history to generate context-sensitive explanations. In the Proc. of the Workshop on Human Language Technology, 1993. I. Redeke. Image & graphic reader. In the Proc. of ICIP, 2001. E. Schwartz. A browser extension for providing visually impaired users access to the content of bar charts on the web. Honors Thesis - Millersville University, 2007. R. Sinha and R. Mihalcea. Unsupervised graph-based word sense disambiguation using measures of word semantic similarity. In the Proc. of ICSC, 2007. M. Walker, S. Whittaker, A. Stent, P. Maloor, J. Moore, M. Johnston, and G. Vasireddy. Generation and evaluation of user tailored responses in multimodal dialogue. Cognitive Science, 28(5):811–840, 2004. W. Yu, K. Kangas, and S. Brewster. Web-based haptic applications for blind people to create virtual graphs. In the Proc. of HAPTICS, 2003.