Eurographics/ IEEE-VGTC Symposium on Visualization (2007) Ken Museth, Torsten Möller, and Anders Ynnerman (Editors)
Interactive Visual Exploration of Unsteady 3D Flows K. Bürger† , J. Schneider, P. Kondratieva, J. Krüger, R. Westermann Computer Graphics and Visualization Group, Technische Universität München
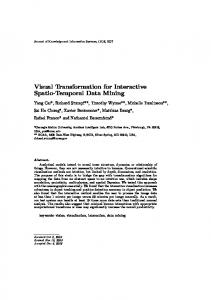
Abstract In this paper we present GPU-based techniques for the interactive visualization of large unsteady 3D flow fields on uniform grids. We propose a novel dual-core approach to asynchronously stream such fields from the CPU, thus enabling the efficient exploration of large time-resolved sequences. This approach decouples visualization from data handling, resulting in interactive frame rates. Built upon a previously published GPU particle engine for flow visualization we have developed new strategies to compute and to visualize path lines and streak lines on the GPU. To provide additional visual cues, focus+context techniques for polygonal meshes have been integrated. The proposed techniques are used in the visual analysis of the Terashake 2.1 earthquake simulation data, and they have been shown to be very effective in revealing the relevant information in this data. Categories and Subject Descriptors (according to ACM CCS): I.3.0 [Computer Graphics]: General; I.3.7 [Computer Graphics]: Three-Dimensional Graphics and Realism Keywords: Flow visualization; unsteady flow; GPU-based techniques; particle engine
1. Introduction Interactive visual exploration of unsteady 3D flows is still one of the grand challenges in many areas of science and engineering. Popular applications where such fields arise include computational fluid dynamics and mechanics, as well as medical imaging techniques like functional CT. In the unsteady case the expert gains insight into the underlying physical phenomena especially from the dynamics of the flow. Consequently there is a dire need for real-time techniques that provide rapid visual feedback. These techniques, however, have to be supported by interactive and intuitive metaphors to enable the user to focus on relevant details and to flexibly select the most appropriate visualization option. Only then the massive amount of 3D information provided to the user can be filtered adequately. Despite the advances in CPU and graphics hardware technology, existing visualization techniques for reasonably sized unsteady 3D flow fields still cannot run at acceptable rates. As numerical and rendering capabilities continue to increase, so does the size of the data sets to be visualized. Today, time-resolved numerical simulations comprised of bil†
[email protected] c The Eurographics Association 2007.
Figure 1: Visualization of the time-resolved Terashake 2.1 simulation data. On a dual core processor equipped with a single GPU particle-based visualization using 256K primitives in combination with volume rendering runs at over 40 fps. lions of grid points are available, making the visualization difficult due to memory constraints. Figure 1 shows such a gigantic field that consists of 227 time steps at resolution 750 × 375 × 100 and requires over 70GB to store velocity and scalar information. As these requirements will continuously increase in the future, there is a dire need for flow
K. Bürger et al. / Interactive Visual Exploration of Unsteady 3D Flows
visualization techniques that comprehensively address these issues. In this paper, we present a novel visualization technique for unsteady 3D flow fields that addresses the aforementioned requirements. This technique is based on a streaming approach for time-resolved sequences. Compared to previous visualization techniques for such fields, both the mapping of visualization data onto renderable primitives and the rendering of these primitives is performed entirely on the GPU. Our approach has the following properties: • Memory efficiency: Asynchronous streaming of the data allows the visualization of an unlimited amount of time steps. Recent advances of multi-core architectures are exploited to abstract from the limited size of the local GPU memory. • Exploration efficiency: Since the reconstruction of local flow features – e.g. stream, streak, and path lines, as well as derived scalar quantities – is integrated into the rendering process on the GPU, our system provides instantaneous visual feedback to the user. This accommodates a more efficient and better understanding of even very complex flow phenomena. • Visualization efficiency: Particle tracing and the computation of characteristic lines is performed on the GPU to visualize the dynamics of unsteady flows. This results in a significant performance gain compared to previous approaches. • Cost efficiency: The visualization techniques presented in this work are especially designed for off-the-shelf PC hardware. To further assist the user in the analysis of complex flows, focus+context techniques have been integrated. These techniques enable the user to emphasize selected regions of interest and to reduce the massive amount of 3D information typically produced by particle-based visualization techniques. It also eases the problem of occlusions typically inherent to 3D flow visualization techniques. The current system supports the visualization of polygonal models to better reveal the spatial relationships between flow structures and boundaries of the flow domain, as well as arbitrary clip geometries to restrict the visualization of particles to the regions of interest. To verify the effectiveness of the presented techniques they have been used for the visual analysis of the Terashake 2.1 earthquake simulation data [ODM∗ 06] provided in the context of the IEEE Visualization 2006 Contest. This contest is designed to foster comparison of visualization techniques and to provide benchmarks for the visualization community based on a particular subject of visualization. By showing that correct answers to dedicated questions from a team of experts can be obtained primarily via visual data exploration, the effectiveness of the used techniques was to be proven. As will be shown by a number of results throughout the remainder of this paper, the techniques we propose are very effec-
tive in revealing the relevant information in this particular data set. By a number of additional examples this observation is backed up. The remainder of this paper is organized as follows: In the next section we will discuss related work. Data handling and transfer issues inherent to visualization techniques for unsteady flow fields will be addressed in Section 3. The GPUbased particle engine is presented in Section 4. Next, various visualization options are discussed. To validate our results we present some insight we gained when working with the Terashake data set and additional simulation results. We finally suggest a number of directions for future research.
2. Related Work In contrast to steady 3D flow and unsteady 2D flow, the literature dealing with interactive techniques for unsteady 3D flow is amazingly sparse. In this section, we will review existing approaches and try to motivate how our system can fill this gap. Unlike Laramee et al. [LEW∗ 06], we will classify approaches more coarsely into dense methods and sparse methods. Dense methods, such as LIC [CL93] seek to reconstruct all characteristic lines at once. To overcome occlusion effects, the process is usually restricted to regions of interest, such as vortex regions [WSE05] or stream surfaces [WE04, Sta98]. The restriction to regions of interest culminates in image-based techniques for flow visualization [vW03, LJH03], which trade highly interactive frame rates, even for unsteady flow, versus artifacts due to the screenaligned nature of the regions. In contrast, sparse methods reconstruct characteristic lines only at specific, carefully selected, discrete locations. Particle tracing [SvWHP94, KL96, KRG03, BL91, KSW04] and the reconstruction of stream, streak, and path lines [Lan96] fall into this category. Also methods that seek to extract topological structures and skeletons [HH89,TSW∗ 05] or features in general [PLV∗ 02] can be considered sparse methods. Both classes are appealing in their own right, depending on which aspects of the data should be emphasized; however, Figure 2 clearly demonstrates that for large amounts of primitives sparse methods naturally converge towards dense methods. Traditionally, dense methods have more problems with unsteady fields, since it is not a priori clear how noninstantaneous characteristics such as streak or path lines can be integrated into the reconstruction. This was addressed by several authors [FC95,SK97] but the major problem remains: spatio-temporal coherence. Recent publications mostly treat these problems [WSE05], but considerable effort is still required. Lately, the demand for interactivity was recognized in the flow visualization community, and many authors propose to exploit GPUs to achieve significant speed-ups [JEH01, WSE05, LTH06]. Especially for c The Eurographics Association 2007.
K. Bürger et al. / Interactive Visual Exploration of Unsteady 3D Flows
view port are paged in [CE97]. Ellsworth et al. [EGM04] extend the method and apply it to terascale data sets. Their system manages billions of particle traces but has extraordinary requirements in computing and storing all potentially visible traces. Also, a flexible choice of rendering primitives is not addressed. Ueng et al. [USM97] propose an out-of-core algorithm to perform stream line reconstruction. Ahrens et al. [ABM∗ 01] utilize a large computing cluster to perform parallel data streaming and visualization, but none of these approaches addresses 3D unsteady flow. 3. Data Handling Figure 2: Visualization of a large eddy simulation of the flow
around a cylinder. Dense particle sets are visualized using oriented rendering primitives to achieve a “LIC-like” look.
3D flow, where occlusion effects are a serious problem, interactivity results in invaluable benefits. Firstly, the motion parallax provides an excellent depth cue. Secondly, different views can be generated rapidly, alleviating occlusion problems. Furthermore, an animated visualization clearly shows dynamic structures in the flow, while communicating both direction and magnitude of the flow. While a mapping of the time axis into the final image is still feasible for 2D unsteady flow [STW∗ 06], this cannot be understood intuitively in 3D flows. Consequently, we mandate to preserve the time axis as an important feature of the data set. Most sparse methods pay particular attention to proper seeding strategies [TB96, PBL∗ 05]. However, recent work by Wiebel et al. [WS05] indicates—maybe opposing common belief—that there is a need for a simple, controllable, and very localized probing metaphor. Mimicking the dyeand smoke-injection of real-life windtunnel experiments, such a metaphor elegantly circumvents problems naturally arising when seeding in unsteady flow fields. Krüger et al. [KKKW05] show that a probing metaphor combined with rapid visual feedback is a convenient and highly effective method to explore the complex dynamic structures present in many flow fields. Probing the flow is a very intuitive and valuable tool that gives engineers full control of the visualization process, rather than forcing them to rely on an automatic seeding algorithm. For 3D unsteady flow, recent methods seeking to extract topological features [GTS04,TSW∗ 05] yield both significant and non-trivial insight into the data, but most of them cannot run at interactive rates. Also, since critical points are not Galilean-invariant, such methods might not be suited for every application. To achieve interactivity when visualizing large, steady flow fields, Bruckschen et al. [BKHJ01] propose to precompute a large amount of particle traces and store them in external memory. During visualization, traces inside the c The Eurographics Association 2007.
In this section we describe the necessary modifications to the GPU-based particle engine proposed by Krüger et al. [KKKW05] to enable interactive visualization of unsteady 3D flows, given in form of a discrete set of vector fields. On the GPU these fields are stored in 3D textures, enabling efficient access to interpolated velocities. The extended engine employs multi-threading by assigning one thread to consecutively stream one time step after another from disc to the GPU, and another thread to manage visualization specific GPU calls. Since these threads are concurrent per se, the visualization process is entirely decoupled and mostly unaware of the streaming data upload. Consequently, data transfer does not block the visualization thread. To advect particles seamlessly in an unsteady field v˜ represented by a discrete set of vector fields {v(t ˜ i ), i ∈ [1, n]} at time steps ti , we need to store at least three fields in GPU memory. For example, Euler integration requires read access to two fields at times ti ,ti+1 , and a third field ti+2 has to be available once time integration proceeds beyond ti+1 . By implementing a ring buffer, we can dynamically choose how many time steps to keep on the GPU, depending on the order of the time-integration scheme. As soon as the time index t of the visualization enters the interval [ti ,ti+1 ], the memory manager is notified. The manager then advances in the sequence by overwriting the GPU container storing time step ti−1 with the next time step ti+2 (see Figure 3). This leads to a very smooth transition in time, and, if the time needed to stream the next time step is smaller than the physical time associated with one interval, the whole sequence can be explored in real time. Since graphics cards lack the ability to fetch data directly from disk, the memory manager prefeches as many time steps as possible from disk and stores them in CPU system memory. If the entire sequence fits into RAM, it is buffered at application startup and can then be streamed without any further disc access. Otherwise, the manager uses an additional ring buffer which provides containers for a systemspecific or user-defined number of data sets. This is illustrated on the right of Figure 3. If only one thread is used to implement visualization and data handling, both disc transfer and the upload of data to the
K. Bürger et al. / Interactive Visual Exploration of Unsteady 3D Flows
GPU will block the entire application. This is because both operations are issued via blocking system calls. Decoupling the two tasks into separate threads enables the particle engine to issue rendering calls even while new data is streamed to the GPU. Multi-core architectures benefit most from this implementation; yet even for single core CPUs we observe a significant gain in visualization performance. This is due to the fact that the operating system scheduler alternatively switches between the two threads, enabling parallel execution of data upload and rendering. Particle Tracing [t 0,t 1]
t1
t0
Particle Tracing [t 1,t 2]
t1
t2
t2
t3
RAM GPU Field(t2)
RAM GPU Field(t3)
t2
t3
t3 t4
t4
Particle Tracing
1
RAM GPU Field
2
t5
t5
t6
HD RAM Field(t5)
HD RAM Field(t6)
HD RAM Field
3
Figure 3: In the left and middle images one cycle performed by the
data handler when advancing in the sequence is depicted. The rightmost image illustrate the separation of the asynchronous stream manager into distinct threads.
Currently, the GPU visualization module and the two memory managers are running in two separate threads (see Figure 3, left). Once the visualization thread enters the next time interval, for which the required time steps are available, it requests the next time step of the sequence that is not yet resident via standard thread communication mechanisms. The memory manager either acknowledges that this time step has already been successfully uploaded to the GPU, or the requested time step is streamed to the GPU. Afterwards, the system memory is updated, overwriting the block containing the now obsolete time step. Note that in this scenario contiguous streaming can be realized with only one buffer in CPU system memory. Table 1 compares the raw data throughput that is achieved for streaming two different data sequences on different architectures. Note that this throughput has been measured with the visualization thread not imposing any additional load. If visualization is enabled, including rasterization and shader operations on the GPU, our experiments have shown a loss in throughput of about 15%. Both test machines are equipped with 3GB RAM, two WD Raptor 74GB harddisks in a RAID0, and an NVIDIA GeForce 7900GTX with 512MB video memory. The single-core CPU is a P4 3.2GHZ, while the dual-core CPU is a Core2 Duo 6600. As can be seen, on the dual-core architecture using the same
disk and memory system the multi-threading approach already yields a noticeable gain in throughput. Table 1: Performance measurements of the stream manager under various configurations.
Cylinder Flow (32 MB/Field)
Terashake 2.1 (64 MB/Field)
HD → CPU
CPU → GPU
HD → CPU
1-Core
90 MB/s
1130 MB/s
95 MB/s
CPU → GPU 1317 MB/s
2-Core
94 MB/s
1240 MB/s
100 MB/s
1590 MB/s
On future quad-/multi-core architectures the memory management can be split further into separate threads to decouple streaming from disk to CPU and from CPU to GPU (see Figure 3, right). Using multiple threads running on different cores to manage the data, the use of ring buffers in system memory is likely to be amplified due to consistency requirements. Still, for off-the-shelf PCs, loading from disk is clearly the bottleneck of the system. To alleviate this problem we can simply prefetch additional time steps into CPU system memory when the user restarts or pauses the application. A further increase in performance can be gained if more efficient RAID systems are employed. 4. GPU Particle Tracing Particle tracing is realized by numerically solving the ordinary differential equation d x˜ = v( ˜ x(t),t) ˜ with x(t ˜ 0 ) = x0 , dt where x(t) ˜ is the current particle position, dx dt is the tangent to the particle trajectory, and v˜ the interpolated unsteady field. For a detailed description on the efficient implementation of a GPU particle engine we refer the reader to [KKKW05]. The engine provides a set of integration schemes ranging from Euler and Runge-Kutta to an embedded RK3(2), where higher order time-integration schemes require multiple time steps to be available on the GPU. Especially the RK3(2) has proven itself to be a very reliable and convenient integration scheme, since it provides fast, 3rd order integration and an estimate ε of the integration error. While ε is usually used to adapt the step size, in real-time applications such an adaption compromises the physical interpretation of particle velocities. To avoid this problem, we use ε to hint the user about the error visually and allow to adapt the step size manually. Of all the modules of the GPU particle engine, only the particle advection module has to be changed to account for unsteady flow fields. This module will be described briefly in the following. Object-space particle positions are stored in RGB-color components of a floating point texture of size M × N, such that M × N matches the amount of desired primitives. The α component of each texture element contains the respective particle’s lifetime. With respect to the asymmetric fragment vs. vertex processing capabilities of recent GPUs, particle c The Eurographics Association 2007.
K. Bürger et al. / Interactive Visual Exploration of Unsteady 3D Flows
advection is entirely performed in the fragment stage. Since mutual exclusion prohibits concurrent read/write access to a single texture, in each time step updated particle positions are rendered into a second render target of the same size and format as the current container (see Figure 4). These two textures, A and B, are used in a “ping-pong”-like fashion; A is the current read buffer containing old particle positions, and B is the current write buffer to which the result of the advection is written. After each advection cycle A and B are swapped. The time steps required to integrate the particles’ characteristic lines are bound to 3D texture units.
lifetime per particle (see [KKKW05] for full detail). If a particle dies, its initial position and lifetime is fetched and written to buffer B. To render particles on the GPU we use the possibility to access texture maps in vertex units. A static “dummy” vertex buffer is stored on the GPU containing as many vertices as there are particles. Whenever particles are displayed this vertex buffer is rendered. A simple vertex shader then replaces each dummy position with the respective particle’s position. In this way, any readback to the system memory is avoided. 5. Visualization of Characteristic Lines
Figure 4: A fragment stream is generated by rendering a quad that covers as many pixels as there should be items in the stream. For the sake of simplicity we will only discuss the implementation of an Euler scheme here, where two time steps suffice to perform the numerical integration over time. For unsteady flows the field v˜ is sampled on a discrete spacetime lattice, which requires spatial and temporal interpolation. Spatial interpolation is usually performed by the GPU, temporal interpolation has to be implemented in a shader program based on an appropriate linear interpolation weight ω . This weight is fed into the pipeline as a shader variable to perform the desired interpolation in time. In a fragment shader the following operations are executed: • Texture Access: Current particle positions and lifetimes are read from buffer A. • Death Test: The shader checks for invalid positions, i.e. particles outside the domain or particles whose lifetime has expired. If one of these conditions is true the particle is reincarnated at a different location. Otherwise the particle is advected through the flow. – Advection: Based on each particle’s position p(t),t ∈ [ti ,ti+1 ], values are fetched from both v(t ˜ i ) and v(t ˜ i+1 ). Additional fetches may be necessary if the hardware does not support automatic spatial tri-linear interpolation for the texture format used. Once tri-linearly interpolated values have been fetched, temporal interpolation using ω yields the velocity v( ˜ p(t),t). ˜ The particle is then advected using the chosen integration scheme and written to buffer B. If higher order integration schemes are to be used, additional texture fetches have to be performed. Compared to steady flow fields, the amount of 3D texture fetches is at least doubled due to quadri-linear vector interpolation. – Reincarnation: Reincarnation is realized by using an additional texture storing one starting position and c The Eurographics Association 2007.
To offer additional visualization modes for unsteady flow fields we have integrated GPU based construction of stream, streak, and path lines into the particle engine. Figure 5 shows such lines in an unsteady flow around a cylinder. For the construction of characteristic lines particles are initially positioned inside a user-defined probe. The construction of stream and path lines essentially uses particle advection as described before. For the construction of streak lines, however, we perform a slightly different strategy. Throughout the following discussion we will assume that characteristic lines of M × N particles are to be computed. 5.1. Stream Lines A stream line describes an instantaneous particle path, which is a path of a particle in an unsteady flow frozen at time t. Traces of all particles released are stored in a texture atlas large enough to store L blocks of M × N entries, where L is the number of advection steps to be performed every frame. If the size of this atlas exceeds the maximum texture size, many of such atlases might have to be stored. Particle advection is performed as described above, but after each advection step the content of the output buffer is copied into the respective part of the atlas. Once all particle trajectories have been computed, a vertex buffer containing L entries is rendered M ×N times as a line strip, with a vertex shader replacing vertex coordinates by the respective values from the atlas. The application takes care of setting appropriate 2D texture coordinate offsets as uniform shader variables to correctly access the atlas. 5.2. Path Lines A path line describes a particle trajectory over time in an unsteady flow. GPU construction of path lines differs from the construction of stream lines as only one advection step per frame is computed in the time-varying field. Thus ω goes periodically from 0 to 1 in user-defined increments and the textures containing the v(t ˜ i ) are updated consecutively on the GPU. If the number of positions along the path line exceeds L, the texture atlas is accessed in a ring-like manner. This means that in each frame the oldest of all stored positions
K. Bürger et al. / Interactive Visual Exploration of Unsteady 3D Flows
Figure 5: Comparison between stream (white), streak (green) and path lines (red) in the same data set. of a particle is overwritten by the current position. Since in this way the start vertex of the lines to be rendered is shifted, texture coordinates have to be adapted using modulo arithmetic in the vertex shader. As a result, line primitives of growing length are constructed and displayed. As soon as the amount of traced positions (frames) exceeds L, the traces start to move with the flow. If a particle dies it cannot simply be reincarnated, as this creates an incorrect line segment from the last position before the reincarnation to the new seed position. Instead, invisible line segments are generated in this case. The fragment shader copies the old position but marks the particle by setting its α -component to 0. Then the next advection step determines that the particle dies, but also that it has been marked during the last pass. In this case a new initial seed position is read and the α -component is left at 0. In the next step, the shader recognizes that the particle has been properly reincarnated during the last pass, and sets the α -channel of the respective entry back to 1. The particular line segments can finally be masked out using α -blending. 5.3. Streak Lines In contrast to path lines, streak lines do not depict the history of particles moving in an unsteady flow, but rather describe the paths traced by dye continuously injected into the flow at a fixed position. In this case all the positional information stored in the texture atlas has to be updated every frame. Thus, instead of using two ping-pong buffers of size M × N, as in the construction of stream and path lines, these two buffers now have to be as large as the entire texture atlas. Note that all L × M × N particles can be advected in a single rendering pass. Again the atlas is implemented as a ring buffer, seeding new initial positions after L frames into the respective texture entries.
and visualization run concurrently in separate threads we achieve 1) a significantly higher overall system performance and 2) much more homogeneous frame rates by selecting the time increments used for path integration according to the expected time needed for data throughput. Second, numerical and memory access operations are more than doubled due to interpolation in the 3+1D data set. Due to the second constraint we observe in all our experiments a loss in performance of about 20-40%, depending on the geometry and rasterization load imposed by the rendering of particle sprites. The computation of stream lines in unsteady flow fields comes at the expense of recalculating the whole texture atlas, i.e.,the entire set of lines within the frozen time step, within one frame. Path lines, on the other hand, only cause a slightly higher computational load than particle tracing, because copying per-frame results into the atlas as well as the proposed line primitive rendering can be realized without noticeable performance loss. For streak lines, numerical integration in the 4D field has to be performed every frame and for each position stored in the atlas. On the other hand, streak lines can effectively be used to emphasize changes in unsteady flow (see Figure 6 for a snapshot of an interactive visualization). A comparative performance analysis between stream, streak, and path lines is given in Table 2.
6. Discussion and Results Compared to particle tracing in steady flows, the tracing of particles in unsteady flows is more time-consuming due to the following reasons: Firstly, the velocity fields have to be updated on the GPU, imposing additional bandwidth requirements. This problem has been alleviated by the multithreading approach presented in this work. As data handling
Figure 6: Dye injection in the cylinder flow. Semi-transparent particles are injected into the field using the probing metaphor. c The Eurographics Association 2007.
K. Bürger et al. / Interactive Visual Exploration of Unsteady 3D Flows
Table 2: Performance measurements (in fps) for stream / path / streak lines of varying length L. amount 128 512 1024
L=100 133 / 872 / 870 125 / 586 / 400 98 / 252 / 208
L=500 30 / 835 / 330 29 / 238 / 88 27 / 114 / 45
L=1000 15 / 388 / 175 15 / 125 / 47 15 / 60 / 24
In Figure 7 an alternative rendering mode using particles is shown, where we just test whether a particle is close to a clip plane. If so, its position is projected into this plane, the aligned particle sprite is rendered, and the integration starts at the new position. As can be seen, the flow structures within the plane can be effectively visualized.
Figure 8: Several wave types are revealed by specific particle patterns that are formed in the unsteady flow visualization. From left to right: P-waves, S-waves, and L-waves are shown. These three types can be recognized most effectively by particles in motion. Orange marks the wave propagation direction, and white marks local particle motion. visualizations. To analyse these very special waves we used a mixed modality visualization using particles and additional color-coding on a context-surface. Therefore, the xyz components of the near-surface displacements were first mapped to RGB-colors. These colors were then used to modulate the topographic map overlayed to the height-field over the simulation domain. Furthermore, normals on the height-field were perturbed by the displacement to further emphasize displacement maxima. This results in caustic-like patterns on the ground that clearly indicate important regions (see Figure 9). As can be seen in all of the examples shown, by augmenting the visualization data with additional modalities such as height-fields, textures, geometries etc., the colocation of different features becomes very easy. 8. Conclusion and Future Works
Figure 7: Particles-in-plane visualization. 7. Validation To validate the proposed visualization techniques we employed them for the visual exploration of the Terashake 2.1 earthquake simulation [ODM∗ 06]. Each time step holds one 3D floating point velocity vector per grid cell. Particle-based visualization as described in this work was employed for the classification of interesting types of waves as they typically occur in earthquakes. By the possibility to interactively advect and render huge amounts of particles, specific structures formed by the particle traces can be observed easily. These structures show typical flow patterns caused by compressional (P), shear (S), and Love (L) waves. In the analysis of these patterns it turned out to be very helpful to interactively zoom into the data and to visualize particular regions using different visualization modes like oriented particles or path and streak lines. Due to the efficiency of the proposed visualization techniques, and thus the possibility to visually convey the dynamics of the flow in real time, all relevant patterns could be understood almost immediately (see Figure 8). Only one particular wave type, the so called Rayleigh (R) waves, was very difficult to understand using particle-based c The Eurographics Association 2007.
In this paper we have presented interactive techniques for the visualization of large unsteady 3D flows. We have shown that on recent dual-core architectures even high-resolution data sets can be streamed to the GPU at interactive rates. We have exploited features of recent graphics accelerators to advect particles on the GPU, saving particle positions in graphics memory, and then sending these positions through the GPU again to obtain images in the frame buffer. This approach allows for interactive streaming and rendering of millions of particles, and it enables virtual exploration of high resolution fields in a way similar to real-world experiments. To our best knowledge, this is for the first time ever that large unsteady 3D flows can be visualized at interactive rates on consumer class PCs. Our experiments, and in particular a thorough validation of the proposed techniques using a benchmark for the visualization community clearly demonstrate the effectiveness of these techniques for the purpose of visual data analysis. In the future, we will investigate parallelization strategies on multi-core CPUs and distributed systems including multiple GPUs. In this respect, the question how to efficiently parallelize particle-based visualization methods on distributed memory architecture has to be answered first. Furthermore, we would like to extend the proposed methods about alternative visualization modes to display different modalities most effectively.
K. Bürger et al. / Interactive Visual Exploration of Unsteady 3D Flows [EGM04] E LLSWORTH D., G REEN B., M ORAN P.: Interactive terascale particle visualization. In Proc. IEEE Vis (2004), pp. 353–360. [FC95] F ORSSELL L., C OHEN S.: Using line integral convolution for flow visualization: Curvilinear grids, variable-speed animation, and unsteady flows. IEEE Transactions on Visualization and Computer Graphics 1, 2 (1995), 133–141. [GTS04] G ARTH C., T RICOCHE X., S CHEUERMANN G.: Tracking of vector field singularities in unstructured 3D time-dependent datasets. In Proc. IEEE Vis (2004), pp. 329–335. [HH89] H ELMAN J., H ESSELINK L.: Representation and display of vector field topology in fluid flow data sets. IEEE Computer 22, 8 (1989), 27–36. [JEH01] J OBARD B., E RLEBACHER G., H USSAINI M.: Hardware-accelerated texture advection for unsteady flow visualization. In Proc. IEEE Vis (2001), pp. 155–162. [KKKW05] K RÜGER J., K IPFER P., KONDRATIEVA P., W ESTERMANN R.: A particle system for interactive visualization of 3D flows. IEEE Transactions on Visualization and Computer Graphics 11, 5 (2005), 744–756. [KL96] K ENWRIGHT D., L ANE D.: Interactive time-dependent particle tracing using tetrahedral decomposition. IEEE TVCG 2, 2 (1996), 120–129. [KRG03] K IPFER P., R ECK F., G REINER G.: Local exact particle tracing on unstructured grids. Computer Graphics Forum 22, 2 (2003), 133–142. [KSW04] K IPFER P., S EGAL M., W ESTERMANN R.: Uberflow: A GPU-based particle engine. In Proc. EG Graphics Hardware Workshop (2004), pp. 115–122. [Lan96] L ANE D.: Visualizing time-varying phenomena in numerical simulations of unsteady flows. In 34th Aerospace Science Meeting & Exhibit (1996). [LEW∗ 06] L ARAMEE R., E RLEBACHER G., W EISKOPF D., G ARTH C., T RICOCHE X., W EINKAUF T., T HEISEL H., P OST F., V ROLIJK B., H AUSER H., D OLEISCH H.: Texture and feature-based flow visualization. In Tutorial #2, IEEE Vis. 2006. [LJH03] L ARAMEE R., J OBARD B., H AUSER H.: Image space based visualization of unsteady flow on surfaces. In IEEE Vis (2003), pp. 131–138. [LTH06] L I G.-S., T RICOCHE X., H ANSEN C.: GPUFLIC: Interactive and accurate dense visualization of unsteady flows. In Proc. EG/IEEE Eurovis (2006), pp. 29–33. [ODM∗ 06] O LSEN K., DAY S., M INSTER J., C UI Y., C HOURASIA A., FAERMAN M., M OORE R., M AECHLING P., J ORDAN T.: Strong shaking in los angeles expected from southern san andreas earthquake. Geophysical Research Letters 33, L07305 (2006). [PBL∗ 05] PARK S., B UDGE B., L INSEN L., H AMANN B., J OY K.: Dense geometric flow visualization. In Proc. EG/IEEE Eurovis (2005), pp. 21–28. [PLV∗ 02] P OST F., L ARAMEE R., V ROLIJK B., H AUSER H., D OLEISCH H.: Feature extraction and visualization of flow fields. In Proc. Eurographics (2002), pp. 69–100. [SK97] S HEN H.-W., K AO D.: Uflic: A line integral convolution algorithm for visualizing unsteady flows. In Proceedings IEEE Visualization 97 (1997), pp. 317–323. [Sta98] S TALLING D.: Fast Texture-Based Algorithms for Vector Field Visualization. PhD thesis, Konrad-Zuse-Zentrum für Informationstechnik Berlin, 1998.
Figure 9: Snapshot of the TeraShake 2.1 data set. Near-surface
[STW∗ 06] S HI K., T HEISEL H., W EINKAUF T., H AUSER H., H EGE H.-C., S EIDEL H.-P.: Path line oriented topology for 2D time-dependent vector fields. In Proc. EG/IEEE Eurovis (2006), pp. 139–146. [SvWHP94] S ADARJOEN A., VAN WALSUM T., H IN A., P OST F.: Particle tracing algorithms for 3D curvilinear grids. In IEEE Scientific Visualization, Overviews, Methodologies, and Techniques (1994), pp. 311–335.
displacements are color-coded and visualized together with particles. Top: Observe the characteristic patterns formed by the particles. Bottom: Red particles indicate a large longitudinal displacement, while green indicates a large transversal component.
[TB96] T URK G., BANKS D.: Image-guided streamline placement. In Proc. Computer Graphics and Interactive Techniques (1996), pp. 453–460.
References
[TSW∗ 05] T HEISEL H., S AHNER J., W EINKAUF T., H EGE H.-C., S EIDEL H.-P.: Extraction of parallel vector surfaces in 3D time-dependent fields and applications to vortex core line tracking. In Proc. IEEE Vis (2005), pp. 631–638.
[ABM∗ 01] A HRENS J., B RISLAWN K., M ARTIN K., G EVECI B., L AW C., PAPKA M.: Large-scale data visualization using parallel data streaming. IEEE Computer Graphics & Applications 21, 4 (2001), 34–41. [BKHJ01] B RUCKSCHEN R., K UESTER F., H AMANN B., J OY K.: Real-time out-ofcore visualization of particle traces. In Proc. IEEE Symposium on Parallel and Large Data Visualization and Graphics (2001), pp. 45–50. [BL91] B RYSON S., L EVIT C.: The virtual windtunnel: An environment for the exploration of three-dimensional unsteady flows. In Proc. IEEE Vis (1991), pp. 17–24. [CE97] C OX M., E LLSWORTH D.: Application-controlled demand paging for out-ofcore visualization. In Proc. IEEE Vis (1997), pp. 235–244. [CL93] C ABRAL B., L EEDOM L.: Imaging Vector Fields Using Line Integral Convolution. Computer Graphics (SIGGRAPH Proceedings) (1993), 263–270.
[USM97] U ENG S., S IKORSKI C., M A K.-L.: Out-of-core streamline visualization on large unstructured meshes. IEEE TVCG 3, 4 (1997), 370–380. [vW03] VAN W IJK J.: Image based flow visualization for curved surfaces. In IEEE Vis (2003), pp. 123–130. [WE04] W EISKOPF D., E RTL T.: A hybrid physical/device-space approach for spatiotemporally coherent interactive texture advection on curved surfaces. In Proc. Graphics Interface (2004), pp. 263–270. [WS05] W IEBEL A., S CHEUERMANN G.: Eyelet particle tracing – steady visualization of unsteady flow. In IEEE Vis (2005), pp. 607–614. [WSE05] W EISKOPF D., S CHAFHITZEL T., E RTL T.: Real-time advection and volumetric illumination for the visualization of 3d unsteady flow. In Proc. EG/IEEE Eurovis (2005), pp. 13–20.
c The Eurographics Association 2007.