applications of the spiral visualization to data exploration tasks, present ...
Interactive Data Exploration, Serial Periodic Data. ...... Visualizing the Evolution of
Web.
Interactive Visualization of Serial Periodic Data John V. Carlis and Joseph A. Konstan Department of Computer Science and Engineering University of Minnesota Minneapolis, MN 55455 USA +1 612 625-4002 {carlis,konstan}@cs.umn.edu month, and year to year. At the same time, looking only at the serial dimension hides important information. The tree may grow more extensively each spring, and may cease growing altogether each winter.
ABSTRACT
Serial periodic data exhibit both serial and periodic properties. For example, time continues forward serially, but weeks, months, and years are periods that recur. While there are extensive visualization techniques for exploring serial data, and a few for exploring periodic data, no existing technique simultaneously displays serial and periodic attributes of a data set. We introduce a spiral visualization technique, which displays data along a spiral to highlight serial attributes along the spiral axis and periodic ones along the radii. We show several applications of the spiral visualization to data exploration tasks, present our implementation, discuss the capacity for data analysis, and present findings of our informal study with users in data-rich scientific domains.
Serial periodic data must be examined both serially and periodically at the same time to discover certain patterns. Consider a tree for which we have size information measured daily for several years. Neither the serial (day to day) nor the periodic (winter to winter) dimension alone would help us discover whether trees exhibit later growing seasons as they age, or perhaps after each year of floods. (This simple example is contrived, but we discuss below several more complex real examples including patterns in chimpanzee feeding behaviors and film release dates.) Other examples of serial periodic data include experience and frequency. Experience can be thought of as a measure of age within a system. Students, for example, may find that their distribution of time spent on various activities progresses serially as they gain experience in time management, but has periodic properties that reflect the beginning of each academic year, midterms, and holiday jobs. An example of serial periodic frequency data is musical notes. An increase of one octave from middle C is another C note (in this case, the serial dimension is transformed logarithmically).
Keywords
Information Visualization, Spiral, Data Visualization, Interactive Data Exploration, Serial Periodic Data. INTRODUCTION
Information visualization is the practice of mapping data sets into visual media for the purposes of assisting users in exploring these data sets or communicating about them to others. As a practiced discipline, information visualization dates back over two centuries, as documented in [27]. More recently, the visual display ability of computers has allowed more extensive interactive visualization, from the constrained drawings of Sketchpad [26], to representations of hierarchical data [23], large documents [22], and time-sequenced data [19]. While the visualization of many data types has been explored, including fairly specialized cases such as citation tracking [15] and document tree usage tracking [5], none of the existing visualization techniques adequately support the exploration of serial periodic data.
The examples presented here illustrate pure serial periodic data. Pure data has a single, continuous dimension in which each period has equal duration. By contrast, many phenomena, including temporal phenomena, are better modeled as event-anchored serial periodic data. Eventanchored data has periods with different durations; the start of a new period is indicated by an event. Examples of this type of data include multi-day racing data and projectbased time tracking. Multi-day races such as the Tour de France have stages that each take a different amount of time; the data set as a whole has a serial dimension--the end of one lap precedes the start of the next--along with a periodic one. We may choose to examine these together to discover whether a particular racer is improving his starts or finishes as the race progresses, or whether he peaks more rapidly after long stages than after short ones. Project-based time tracking looks at the use of time over the course of projects, from start to finish and onto the
Serial periodic data has a serial (continuous) dimension that exhibits periodicity. The most common example is temporal data that exhibits seasonality. A tree's growth, for example, continues serially from day to day, month to This paper appears in the proceedings of UIST’98, the 11th annual Sympoium on User Interface Software and Technology, San Francisco, November, 1998.
1
• Multimedia presentation authoring tools often show multiple "tracks" of data in parallel along a timeline [e.g., 6]. • The LifeLines [19] visualization tool shows different categories and incidents of events (in criminal justice history and medical record applications) laid out along a zoomable, browsable timeline. None of these timeline systems, however, provide any support for viewing the periodic aspects of the data.
next one. We can again explore both serial and periodic trends by examining how a person's efficiency at a particular phase of each project is affected by the pattern and number of prior projects. While there are many exciting problems involved in event-anchored data, this paper focuses on pure data, except for some discussion of on-going work. Despite the wide prevalence of serial periodic data, few interfaces support exploring it. This owes, in part, to the propensity to use tabular layouts that visually exaggerate distances across the period boundary. For example, our calendars visually separate the 31st of December from the very next day— the 1st of January. Similarly, in music, high and low C notes appear far apart on the staff, hiding the fact that, when sung, they are heard as the “same” note.
Other visualizations use angles and radii for display. Circular line graphs [8] map two different variables onto the radius (r) and angle (Θ ) dimensions, whereas spirals map one variable and use r and Θ to explore its serial and periodic nature. Similarly, wind rose graphs [8] map compass direction to Θ and duration to r. A wide range of interactive data exploration is supported by tools employing dynamic query and focus+context interface techniques.
This paper presents a visualization technique and tool for exploring serial periodic data through a spiral data layout that maps the serial dimension to the spiral in a manner such that each period fills 360 degrees (one lap). In this visualization, serial data is explored by viewing along the spiral and periodic data is explored along the radii. Before presenting our design, we evaluate the appropriateness of existing visualization techniques.
Dynamic query systems, such as the FilmFinder and HomeFinder applications using starfield displays, allow users to rapidly explore large data sets through convenient interfaces to range and join queries [1]. This technique is particularly appealing for our scientific applications, such as chimpanzee feeding behavior, because of the large volume of data available for exploration. Unfortunately, while starfield displays easily can show two independent dimensions (e.g., longitude and latitude in the HomeFinder, or length and release date in the FilmFinder), they do not support display of periodic and serial attributes of the same data dimension. We have incorporated a limited set of dynamic query capabilities into our spiral visualization tool, have found them to be useful, and expect to incorporate more of them as applications demand.
Motivation and Related Work
This work is motivated by the fact that current visualization tools do not support users in simultaneously exploring serial and periodic attributes of serial periodic data. We do not make this claim lightly; it is rarely worthwhile to develop new visualization techniques since so many useful ones already exist. This section provides a brief survey of the techniques we explored as alternatives to developing our own. One well-established set of techniques involves tabular display of data. A range of spreadsheets, from commercial products such as Excel to research visualization spreadsheets [4] provide the ability to arrange data in tabular form. More sophisticated tools such as the Table Lens [20] and FOCUS table browser [25] provide greater exploration support through interactive manipulation of the table view. Unfortunately, it is very difficult to view data serially and periodically in a table or spreadsheet. Laying data out with one period per row (or column) can allow some periodic exploration (but only for a single datum per time unit, except for the visualization spreadsheet). While it is possible to augment this with replication to give a limited ability to view data serially, we found this interface to be awkward and unsatisfying.
Focus+context interfaces provide users with a view on the details of a small part of a data set while using area, perspective, or volume to show the surrounding context in reduced detail. A variety of these techniques has been shown to be suitable for different data types. Examples include hyperbolic browsers for trees [12], a perspective wall for linear documents [16], a document lens for documents organized in pages [22], and a variety of special lenses for viewing maps and graphs [e.g., 24]. Of these, the one with the most promise was the document lens, since pages have a periodic component. We found, however, that the document lens, while very good for helping users manage serial exploration of pages, was not particularly useful for exploring periodic patterns. We still find focus+context techniques interesting, but have not yet determined how they can be applied to the spiral.
A variety of linear displays exist that use a timeline as the basis for representation. Many useful interactive tools using timelines have been created specifically for temporal data:
One additional general visualization technique that has been explored recently is the zooming interface [18, 3, and 21]. This technique allows users to see an overview of
2
data, or to zoom into a subset of the data with greater detail. Unlike focus+context interfaces, the context is generally not immediately visible, but can be accessed by zooming back out. The data analysis tasks we have, however, require extensive manipulation and exploration at full scale. Zooming does not help users explore periodic and serial trends. Accordingly, we provide zooming to help users focus on a smaller or larger number of periods, but otherwise have not found zooming to be particularly useful.
the dictionary, spiral as a noun means “the path of a point in a plane moving around a central point while continuously receding from or approaching it,” or “a threedimensional curve (as a helix) with one or more turns about.” A helix is “a coil formed by winding wire around a uniform tube.” In mathematics, spirals have been studied for millennia and there are dozens of variations [e.g., 7, 11, 13, and 14], some of which do not look like common spirals. For example, a Cornu spiral looks like a fancy “S” and a spherical spiral looks like a helix drawn on a ball instead of a cylinder. For the visualization of serial-periodic data, we use only planar spirals, both because planar spirals leave an additional dimension for visualizing data attributes and because, so far, non-planar spirals have not given us any useful displays. Recently, Keim [10] uses a spiral-like space-filling curve for serial pixel data, and Hascoet [9] uses spirals to compactly display lists of rank-scale document similarity data.
Finally, there are a number of special-purpose interfaces that have been developed to solve data exploration and navigation problems. The cone tree [23] for tree or hierarchical data and the butterfly [15] for citation links both support well-structured navigation tasks, but do not match our data sets. The calendar visualization [17] has a periodic temporal aspect to it, but it does not directly support viewing data in serial fashion, watching a value increase as it progresses from day to day across weeks.1 Perhaps the closest match is the use of a helix to represent an instant in music; indeed musical representation provided some motivation for this work. The helix, however, showed only a single time instant, whereas the planar nature of the spiral allows us to represent music over time.
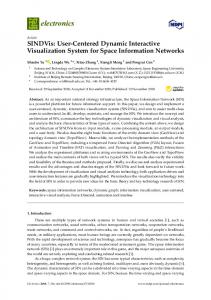
The most common planar spirals are the spiral of Archimedes [2], the hyperbolic spiral and the logarithmic spiral. The line of the latter two moves rapidly away from the origin. We use the spiral of Archimedes, because it moves away from the origin at a constant rate and, therefore, is more compact. For the rest of this paper when we use “spiral” we mean the spiral of Archimedes. An Archimedean spiral (see figure 1) is expressed in a polar equation:
The rest of this paper presents the spiral visualization concept, walks through several examples of using spiral visualizations to explore data and communicate about data, and presents our implementation, evaluation, and ongoing work.
r = αΘ where x = r cos Θ r = sqrt (x2 + y2)
CONCEPTUAL BACKGROUND: WHY A SPIRAL?
The term “spiral” can be used generally or specifically. In
y = r sinΘ Θ = tan–1 (y/x)
We think in terms of a “spiral axis,” where we wind an axis for a serial-periodic variable into a spiral so that the periods align as we want them to. If T is an axis and c is a sizing constant then for t, a point on T, its position in the plane can be found using: x = c * t * cos(t * 2 * Π) y = c* t * sin(t * 2 * Π); We have found the beginning of the spiral too crowded for displays and offset t by a user-supplied indenting value. That is, t = t +indent. To understand a spiral display of serial - periodic data consider the example shown in figure 2: • This spiral contains data on the consumption of Baphia Capparidifolia by chimpanzees in the Gombe preserve in Tanzania for the years 1980 through 1988. • There is one lap of the spiral for each year and one month for each spoke. The spiral and spokes are displayed to help the user identify years and months. January is at 3 o'clock, April at 12 o'clock, etc. Since
Figure 1. A Spiral of Archimedes. (for color figures see the electronic proceedings or www.cs.umn.edu/~carlis)
1
The calendar visualizer refers to a spiral calendar, but that spiral is a receding stack of increasingly coarser calendars that bears little resemblance to our spiral work in goals or methods.
3
hidden when the nature of the data display makes them more distracting than useful. • The spiral is indented 2 laps and has 9 laps drawn. Since a lap is once around the spiral, an extra, harmless lap was drawn. • The inner laps are shorter than the outer ones. You can think of the T axis being stretched as it is wound around the origin. • The spiral and blots are scaled so that no blots overlap. Notice that the region surrounding each blot contains its serial and periodic neighbors. It is visually easy to look at what happened the month prior or following (counterclockwise or clockwise) or at this season in years past (inward) or future (outward). For this data set all blots appear at a spiral-spoke intersection. Other data sets have data appearing at any point along the spiral, and some use radius offsets from the spiral to organize multiple data points or highlight data attributes.
Figure 2. An indented spiral, with spokes, showing monthly consumption percentages for Baphia Capparidifolia during the period 1980 – 1988.
the data set has monthly values, we do not represent the differences in the number of days in each month. • For many months, a blot is displayed. The area of the blot is proportional to the observed consumption percentage during that month of that year. • The primatologists2 studying this display readily saw and explained patterns, e.g., chimpanzees eat new leaves of this plant, which are produced at the beginning and the end of the rainy season which is approximately October – April, and, more particularly, late rainy season consumption was steadier than that in early season. • They also saw and sought explanations for anomalies, e.g., in 1984, which was a drought year, consumption was considerably lower in the early rainy season, and high consumption in August 1983 occurred when the rainy season came early. Figure 2 also illustrates some of the properties of the spiral display, including: • We have chosen an “elevation” view of the spiral with a viewpoint so that the spiral centers on and fills the square-viewing window. • To help orient the user, we display both the spiral line and spokes emanating from the origin. These can be
2
With a spiral one can display large amounts of data at
We have been working with Prof. Anne Pusey, Director of the University of Minnesota’s Jane Goodall Institute--Center for Primate Study, Jane Goodall and other scholars to computerize and analyze the field notes from Goodall’s famous decadeslong field study. The initial impetus for the spiral work reported here came from their frustrations in analyzing seasonal variations in chimpanzee behaviors.
Figure 3. A spiral display of monthly consumption percentages for all 112 foods during the period 1980 – 1988.
4
once. For example, figure 2 shows only a small subset of the consumption data for chimpanzees; figure 3 shows all 112 foods. In this spiral:
of the spiral, and demonstrate ways in which spiral visualizations can reveal interesting attributes of data.
• Each food appears in its own z range above the spiral’s x-y plane. • The foods appear in order by their names; there is no quantitative meaning to a high or low z. • Each food has been assigned one of twelve colors. A panel (described below) shows the matching of names and colors. • Rather than use blots, here we use lidless, hollow “cans,” where the volume of a can is proportional to consumption. • The figure’s viewpoint is above the spiral plane, off to the side, and zoomed out. • The viewpoint and the relative scales of the height of a can, a can’s area, and the spiral’s size were chosen to allow a considerable amount of data to be notable and, at the same time, to have little data obscured. However, some distortion occurs. This figure is just one of many views we explored when looking at this data with primatologists. The user controls rotation, zoom, pan, and tilt along with the set of data to be displayed and the mapping between data and visual form. From this view, we can readily see which foods are eaten most and least, either overall or at different times of the year. We can then explore those foods in more detail individually or in smaller sets.
The next two examples show how a plain spiral can be augmented to show several data sets simultaneously. Figure 4 shows the twelve most commonly eaten foods with additional “boundary lines" showing the onset of the
Chimpanzee Food Consumption
Figure 4. A spiral display of year-month consumption percentages for 12 highly consumed foods during the period 1980 – 1988. Rotated and zoomed in to show one season and boundary lines.
rainy season for each year. This figure illustrates several additional visual mappings: • Consumption values for each month appear as "spikes" with a length proportional to the consumption level. The height scale and fixed width value can be adjusted by the user. Here, each spike is four pixels wide. • Each food has its own color. Since several spikes appear at each month, they are arranged in a consistent order and form a "flag." Users can choose to keep flags oriented perpendicular to the sight line to improve visibility. • A boundary line, a long black line, is drawn to show the beginning and end of the season of interest. They allow the user to focus on a period of interest. For different data, tick marks, short black lines drawn perpendicular to the spiral, are used. Tick marks provide a visually distinct appearance that supports comparison with irregularly occurring events. Accordingly, a user can observe that the consumption of a particular food is late one year, but that the lateness is consistent with a late rainy season. Figure 5 shows data about the group sizes in which two different chimps (red and blue) travel. This example illustrates the use of multiple, linked spirals:
Together, these examples illustrate most of the idea behind spiral visualization. We hasten to point out that, at least for now, the spiral is a visualization model that requires exploration. For users exploring data sets, it is valuable and often necessary to view the data in different ways to reveal different patterns. For users seeking to communicate to others, it is often useful to explore different viewpoints and mappings before settling on a small number of still images that highlight the patterns of interest. To support these exploration and communication tasks, we provide a number of annotation features not shown in these brief examples. They include the ability to align different spirals vertically (similar to the model of the web ecology visualization tool [5]) and the ability to define data-derived border lines to illustrate phenomena external to the data set (e.g., the start of the rainy season or a period of drought). EXAMPLE USES OF SPIRAL VISUALIZATION
The two examples shown above illustrate the basic use of the spiral. This section presents a set of examples from our work with primatologists, along with some experimental visualization of sound and movie data. Through these examples, we illustrate other useful features
• The upper spiral shows the average group size, while the lower shows the maximum group size. Each
5
spiral is assigned a z-value that can be controlled by the user. • The spirals rotate, zoom, pan and tilt together.
and their data are close but do not mingle. Neuron Firing Data
In our exploration of chimpanzee data, we have found several techniques to be useful. Because of the volume of data collected, we often wish to scan through the data in an organized manner, either one food at a time or seasonally, one spoke at a time. Figure 2 shows a singlefood view, which can be animated to step through a set of different foods. While exploring a different data set-neuron-firing activity--we found it particularly useful to step through the individual spokes. Figure 6 shows a set of neuron cell firing data for a particular part of the stimulus cycle. In this spoke of the spiral (the spiral line itself disappears since it is orthogonal to the display), we see the firing rates, relative to normal, for different cells: • Each cell is assigned a color. The spikes have positive or negative value to reflect the deviation of firing rate from normal. • From left to right, we move from the inside of the spiral outward. Each flag displays the firing rate of each cell of interest. This view made it easier to detect cells that lost sensitivity when "fatigued" by repeated stimulation. In general, it is often useful to focus in on a set of data, and then move back to the whole data set, very much in the way users do with dynamic queries. Sound
In several cases, we have found it useful to explore different lap rates. For example, changing a lap from one year to two years helps explore biennial cycles. Even more exciting, however, is exploring data where the periodicity is unknown. Figure 7 shows a set of quantized sound data. This data comes from research conducted by colleagues interested in finding the formants of a recording to allow them to shorten or lengthen it while preserving quality. To help them discover periodicity, we tighten the spiral, changing the time per lap looking for values where the data lines up. Figure 7 shows three different views based on different time per lap values. The data comes from a compact disc recording of five instruments.
Figure 5. A spiral display of average and maximum groups sizes for two chimpanzees.
• The z values and scales have been chosen so that as we explore the data (notably with tilt) the two spirals
This figure is the first example we provide of interval data. Interval data occurs between two points on the spiral axis rather than at a point. More specifically: • Each interval with sound appears as a rectangle of height 1 (on) that is bent around the spiral. White space means either that no sound occurs or that sounds cancel out. • Scale values were chosen to fill out the spiral. No white space is left between the outer bent rectangle and the next spiral lap line. • The angle that a blue bent rectangle fills is important. Its actual length depends in part on which lap it is in.
Figure 6. A single spoke of a spiral display of neuron firing frequencies. The user can animate this display to step forward through the spokes.
6
Increasing the spiral’s indent would lessen the
FilmFinder data [1], augmented by release dates obtained
Figure 7. Tightening a spiral view of sound data from five instruments. From left to right the structure of the sound reveals itself.
difference in displayed length of equal-time intervals and give the display more of a donut appearance. • The three snapshots in the figure only weakly indicate the emergence of organization in the data as the time per lap parameter lessens. The dynamic display at first (left) appeared disorganized, then (center) some wilted stalks emerged, and then (right) they straightened. • The right snapshot shows several straight stalks, some of which are missing some values.
from the Internet Movie Database (www.imdb.com). Figure 8 shows blots for movie releases with colors corresponding to genre. Figure 9 looks at horror movies in greater detail. From this simple example, we learn that: • Historically, very few movies have been released in December. • After 1985, there was a significant increase in the number of July movie releases. • Horror movies are disproportionately released in the weeks preceding Halloween. With up-to-date data plus data on box office sales and academy award nominations, we could proceed to explore the hypothesis that films released early in the year are less likely to be nominated for an academy award, or the hypothesis that big-budget films are released at specific times of the year.
Movie Data
Finally, we were interested in exploring the value of spiral visualization on data sets used by other interactive visualization researchers. We decided to look at movie data to explore the seasonality and change in seasonality of movie releases over time. We use a subset of the
Figure 8. A display of movie data by release date (1930 - 1996). Color is movie genre and blot diameter is movie popularity. Square blocks mark five-year intervals.
Figure 9. Spiral display of horror movies shows a disproportionate number released just before Halloween.
7
Figure 10. The spiral viewer prototype with several control panels displayed.
Like cans and blots, balls can be offset in the z-dimension to provide additional data display.
BASIC IMPLEMENTATION AND PROTOTYPE
In this section we give details of the prototype implementation and its user interface.
The toolbar controls the viewpoint on what is being displayed. Viewpoint controls are straightforward: pan, tilt, zoom and rotate. Clicking on one of these buttons moves the viewpoint a user-set amount. A sliders subordinate window has slider controls for these 4 viewpoint functions. Extra controls allow one to quickly get a plan, an elevation, or a “home” (above the spiral plane, off to the side, somewhat zoomed out), or to mark an interesting viewpoint and return to it.
Our prototype program is written in Tcl (about 4,000 lines) and C (about 7,000 lines). It uses the Mesa implementation of OpenGL for its graphics. We run it on Sun Sparc workstations under the Solaris operating system. The spiral rendering code follows the equations presented above. The interesting prototyping challenge has been providing extensive control to the visualization operator to allow effective exploration. We use the term visualization operator because the model of usage has been for a content expert (e.g., a primatologist) to work together with a tool expert (i.e., one of our group) to explore the data together. We discuss this design decision in more detail below.
The settings window contains one line for each variable3 in a scrollable frame plus a number of other controls. Each variable has a number, a color, a name, a name change field, a position/position change field, a variable scale value, a variable scale change field, a z-offset and a zoffset change field. We chose to have display/new value pairs, rather than editable fields, because of the common case where the new values for a set of variables each
Figure 10 shows a reduced main window with a set of the most frequently used control panels. The main interface window is a graphics window augmented with buttons that bring up additional control panels, change the display style, save the configuration, or quit. Display styles include the can, spike, and blot shown above; the episode display shown in the sound example; a dot, which displays a unit-sized icosahedron at the position where the top of a spike would appear; and a ball which displays an icosahedron with volume proportional to the data value.
3
8
In the interface, we adopted the term variable for the primary enumerated attribute. Primatologists considered each food to be a variable; genre was the variable in the movie example. While there can be multiple enumerated attributes in a spiral, we have not yet incorporated a clean interface for specifying them independently.
depend on several old values. The window has controls for toggling on/off the display of variables and for determining their relative order in flag displays.
Users quickly buy into the notion of a spiral display. Even our fledgling efforts yielded positive feedback, perhaps because they were saddled with poor tools for dealing with their serial periodic data. However, they were not selfsufficient and needed an experienced operator of the software to help them explore.
The display window allows the user to set the constant factor (units per lap), to set an acceleration factor (attenuating the spiral), and to display more spirals, each with its own z-offset. It also has controls to toggle the display of the spiral, spokes, boundary ticks or lines, and a z-axis pole, among other features
Users react to the spiral displays. When they saw a pattern, they tried to explain the pattern to each other by telling stories. When they saw an anomaly they sometimes told stories, but they also went back to the original data to see if it had been entered correctly. (In one case a whole file of papers had to be re-checked manually.) Sometimes they, with our help, put together a portfolio of spiral display printouts to show to distant colleagues.
The laps window allows the user to control how much spiral is displayed and how much data is displayed. The animate window looks slightly different depending on whether the constant factor, variable, spoke, or (spiral) offset (of one variable) is being animated. Its purpose is to allow a user to quickly step through the data. Animating the constant factor is useful when searching for periodicity. Animating by variable or by spoke allows the user to focus on a portion of the data. Animating spiral offset allows a user to search for, for example, leading indictors such as “2 months after the onset of the rainy season this food is no longer eaten extensively.”
Users want more. Our users did not run out of ideas for analyses. Indeed the opposite occurred. Often a display whetted their appetites for further study. New opportunities arise. Several times, as we showed result to uninvolved colleagues, we found ourselves with new data to analyze. For example, we are beginning an extension to support with spiral displays the management of battery energy for the University of Minnesota’s successful solar car team.
Continuing Work
While our prototype has proven to be extremely useful, we also recognize that it is far from complete. Among the steps we hope to take in the near future are:
On-Going and Future Work
In addition to the improvements we plan to make to the spiral visualization tool, there are several key research objectives for our future work:
• Experimentation with alternative input devices for navigation and control; 3-DOF input devices would be an improvement, though 6-DOF may be too flexible. • General improvements to the UI, including creation of reusable viewing and animation templates, better use of shortcuts and menus, and simplification of the structure. • Exploration of automated, data-driven style and view selection. Long-term, we also hope to create tighter integration with spreadsheet and database tools to permit more flexible manipulation and filtering of data as part of exploration.
• More extensive usage studies. Our informal evaluation has been very successful, and formal evaluation may need to wait for an improved interface, but it is a high priority for us. • Better support for exploration without a trained operator. The users who need this tool are willing to spend some time learning to use it; we need to meet them halfway with a simplified interface and better data-driven defaults. • Better integration with other data exploration tools. The spiral is evidently not the appropriate tool for all forms of data exploration--it should be integrated with other tools to form a more powerful visualization toolbox. • More complex spirals. A colleague asked what happens when spirals occur in multiple dimensions. We have also considered spiral-based scrolls as a focus+context interface. Much work remains.
DISCUSSION
We are very excited by our initial results with spiral visualization. One particularly satisfying part of this work is the ease with which users and colleagues accept the notion of serial periodic data. Seasonality appears to be a fundamental concept that people recognize and accept. In this section we briefly report our experiences with users and our high-level plans for future work.
CONCLUSION
Experience with Users
We highlighted a type of data, serial periodic, which occurs frequently but has not been the subject of visualization research. Arranging data in a spiral provides the user with easy visual cues to both serial and periodic aspects of the data, along with interactions such as the change in period over time.
Pretty pictures are worth little if real users find no value in a system. We have interacted with about a dozen users so far, drawn from a variety of disciplines, but mostly from biological sciences. From these lessons, we distilled a few observations.
9
11. Lauweirer, H. Fractals: Endlessly Repeated Geometric Figures. Princeton, NJ: Princeton University Press, pp. 59-60, 1991. 12. Lamping, J. and Rao, R. Laying out and visualizing large tree using a hyperbolic space. In Proceedings of UIST '94. 13. Lawrence, J. D. A Catalog of Special Plane Curves. New York: Dover, pp. 186 and 189, 1972. 14. Lockwood, E. H. A Book of Curves. Cambridge, England: Cambridge University Press, p. 175, 1967. 15. Mackinlay, J.D., Rao, R., and Card, S.K. An organic user interface for searching citation links. In Proceedings of CHI '95. 16. Mackinlay, J.D., Robertson, G.G., and Card, S.K. The perspective wall: detail and context smoothly integrated. In Proceedings of CHI '91. 17. Mackinlay, J.D., Robertson, G.G., and DeLine, R.. Developing Calendar Visualizers for the Information Visualizer. In Proceedings of UIST '94. 18. Perlin, K. and Fox, D. Pad: an alternative approach to computer interface physics. In Proceedings of SIGGRAPH '93. 19. Plaisant, C., et. al. LifeLines: visualizing personal histories. In Proceedings of CHI 96. 20. Rao, R. and Card, S.K. The table lens: merging graphical and symbolic representations in an interactive focus + context visualization for tabular information. In Proceedings of CHI '94. 21. Rennison, E. Galaxy of news: an approach to visualizing and understanding expansive news landscapes. In Proceedings of UIST '94. 22. Robertson, G.R. and Mackinlay, J.D. The document lens. In Proceedings of UIST '93. 23. Robertson, G.R., Mackinlay, J.D., and Card, S.K. Cone Trees: animated 3D visualizations of hierarchical information. In Proceedings of CHI '91. 24. Sarkar, M., et. al. Stretching the Rubber Sheet: A Metaphor for Viewing Large Layouts on Small Screens. In Proceedings of UIST '93. 25. Spenke, M., Beilken, C., and Berlage, T. FOCUS: The interactive table for product comparison and selection. In Proceedings of UIST 96. 26. Sutherland, I. Sketchpad: A man-machine graphical communication system. In AFIPS Conference Proceedings, Spring Joint Computer Conference. AFIPS, Arlington, VA, 1963. 27. Tufte, E.R. The Visual Display of Quantitative Information. Graphics Press, Cheshire, CT, 1983.
Spiral layout supports many different display options. Indeed, in some ways it is comparable to trees (which display hierarchies) or tables (which display data categorized on two axes). We have presented a tool that implements several useful display options, and plan to explore more of them. Finally, our users have found these visualizations to be useful in extracting seasonality and periodicity data that is not evident from other views of the data set. ACKNOWLEDGEMENTS
We would like to thank a number of people for their assistance in this work. They are: Brian Bailey, Elizabeth Boschee, Jake Chen, Apostolos Georgeopolos, Jane Goodall, Kalid Hamdy, David Herring, Douglas Perrin, Anne Pusey, Alex Safonov, Tim Susman, Patrick Starr, and Jennifer Williams. We also acknowledge the support of the National Science Foundation through grants IRI 9410470 and DBI 97-23816. REFERENCES
1. Ahlberg, C., Williamson, C., and Shneiderman, B. Dynamic queries for information exploration: an implementation and evaluation. In Proceedings of CHI '92. 2. Archimedes. Uber Spiralen. (Artur Czwalina, translator). Leipzig, Akademische verlagsgesellschat m.b.h., 1922. 3. Bederson, B.B. and Hollan, J.D. Pad++: a zooming graphical interface for exploring alternate interface physics. In Proceedings of UIST '94. 4. Chi, E.H., et. al. A Spreadsheet Approach to Information Visualization. To appear in IEEE Computer Graphics and Applications, July 1998. 5. Chi, E.H., et. al. Visualizing the Evolution of Web Ecologies. In Proceedings of CHI 98. 6. Drapeau, G.D. Synchronization in the MAEstro multimedia authoring environment. In Proceedings of ACM Multimedia '93. 7. Gray, A. Modern Differential Geometry of Curves and Surfaces. Boca Raton, FL: CRC Press, pp. 69-70, 1993. 8. Harris, R.L., Information Graphics: A Comprehensive Illustrated Reference. Management Graphics, Altanta, 1996. 9. Hascoët, M. Analytical versus empirical evaluation of spatial displays. In CHI 98 Conference Summary. 10. Keim, D. A., Enhancing the Visual Clustering of Query-Dependent Database Visualization Techniques Using Screen-filling Curves. In Database Issues for Data Visualization, Wierse, A., et al, Eds., Springer Verlag, 1995.
10