GEOPHYSICAL RESEARCH LETTERS, VOL. 35, L13704, doi:10.1029/2008GL034119, 2008
Interannual memory effects for spring NDVI in semi-arid South Africa Yves Richard,1 Nade`ge Martiny,1 Nicolas Fauchereau,2 Chris Reason,2 Mathieu Rouault,2 Nicolas Vigaud,1 and Yann Tracol3 Received 26 March 2008; revised 25 April 2008; accepted 30 April 2008; published 4 July 2008.
[1] Almost 20 years of Normalized Difference Vegetative Index (NDVI) and precipitation (PPT) data are analysed to better understand the interannual memory effects on vegetation dynamics observed at regional scales in Southern Africa (SA). The study focuses on a semi-arid region (25°S–31°S; 21°E – 26°E) during the austral early summer (September – December). The memory effects are examined using simple statistical approaches (linear correlations and regressions) which require the definition of an early summer vegetation predictand (December NDVI minus September NDVI) and a consistent set of potential predictors (rainfall amount, number of rainy days, rainfall intensity, NDVI and Rain-Use-Efficiency) considered with 4 to 15-month time-lag. An analysis over six SA subregions, corresponding to the six major land-cover types of the area reveals two distinct memory effects. A ‘‘negative’’ memory effect (with both rainfall and vegetation) is detected at 7 to 10-month time-lag while a ‘‘positive’’ memory effect (with vegetation only) is observed at 12 to 14-month time-lag. These results suggest that interannual memory effects in early summer vegetation dynamics of semi-arid South Africa may preferably be driven by biological rather than hydrological mechanisms. Citation: Richard, Y., N. Martiny, N. Fauchereau, C. Reason, M. Rouault, N. Vigaud, and Y. Tracol (2008), Interannual memory effects for spring NDVI in semi-arid South Africa, Geophys. Res. Lett., 35, L13704, doi:10.1029/2008GL034119.
1. Introduction [2] In semi-arid African regions, characterized by annual rainfall between 200 and 600 mm, the vegetative photosynthetic activity, well-described by the remotely sensed Normalized Difference Vegetative Index (NDVI), is highly sensitive to interannual variability of precipitation (PPT). For southern Africa (SA), the NDVI-PPT relationship was particularly well documented during the last decade [Fuller and Prince, 1996; Gondwe and Jury, 1997; Jury et al., 1997; Kogan, 1998; Richard and Poccard, 1998; Oesterheld et al., 2001]. [3] More recently, the annual NDVI has proved to be highly dependent on rainfall of the concurrent year and, to some extent, of the previous year. These persistence effects
1
Centre de Recherches de Climatologie, UMR 5210 CNRS/Universite´ de Bourgogne, Dijon, France. 2 Oceanography Department, University of Cape Town, Rondebosh, South Africa. 3 Centro de Estudios Avanzados en Zonas Aridas (CEAZA), La Serena, Chile. Copyright 2008 by the American Geophysical Union. 0094-8276/08/2008GL034119
in vegetation dynamics, referred to as ‘‘memory effects’’, have actually been observed in different semi-arid African regions [Schwinning et al., 2004; Martiny et al., 2005; Philippon et al., 2005; Camberlin et al., 2007]. The goal of this study is to better understand, on a SA semi-arid region (25°S–31°S; 21°E–26°E), the nature and associated time-lags of the mechanisms involved in the memory effects. [4] Since the NDVI-PPT relationship is sensitive to the vegetation type [Camberlin et al., 2007], the SA region is divided into six sub-regions, representative of a given landcover type and associated ecosystem. For each ecosystem: (1) we focus on vegetation activity during the first half of the summer rainfall season (September – December), hereafter called ‘‘early summer’’, the memory effects being more efficient at the beginning of the vegetative season (the impact of the concurrent-year rainfall gets more and more important later in the season), and (2) we establish a statistical link between vegetation activity and a set of potential predictors defined from the rainfall and vegetation data sets.
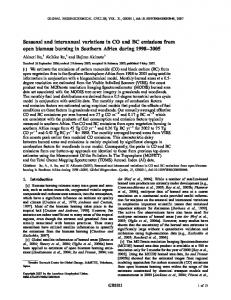
2. Study Region [5] The study region (25°S – 31°S; 21°E–26°E), which includes parts of Botswana and South Africa (parts of the Northern Cape, the Free State and the North – West provinces), is characterized by semi-arid conditions. The main part of the rains occurs between November and April. Based on the land-cover map of Africa prepared in the framework of the Global Land Cover 2000 (GLC2000) project [Bartholome´ and Belward, 2005], six vegetation types, all of the savanna type, are identified within this SA region (Figure 1a). It is worth noting that with less than 650 mm/year, African arid and semi-arid savanna ecosystems may be considered as ’stable’ in which water constrains woody cover and permits grasses to coexist [Sankaran et al., 2005].
3. Data and Methods [6] The NDVI Advanced Very High Resolution Radiometers (AVHRR) data set provided by the Global Inventory Modelling and Mapping studies (GIMMS) group at NASA [Tucker et al., 2005] has been used to characterize the continental land cover. The bi-monthly NDVI at an 8-km spatial resolution is extracted from July 1981 to December 1999, in agreement with the PPT data set. [7] Daily PPT data are extracted from the Water Research Commission (WRC) rain-gauge database [Lynch, 2003], providing 1160 complete and validated time series in the SA region for the 19 years selected (1981 – 1999). The daily PPT measurements are spatially and linearly interpolated on
L13704
1 of 6
L13704
RICHARD ET AL.: INTERANNUAL MEMORY EFFECTS FOR SPRING NDVI
L13704
Figure 1. (a) The SA region and land-cover types from GLC2000 and (b) the 8-km spatial resolution NDVI from AVHRR in September (top) and December (bottom).
regular grids at the NDVI spatial resolution, with 64 points in longitude and 72 points in latitude. Among the 4608 gridpoints, only 4096 are documented due to missing data mainly over Botswana. [8] Simple statistical techniques (linear correlations and regressions) may help to identify the main reasons for the green-up in austral early summer, and better understand the memory effects. An early summer vegetation predictand and the associated set of potential predictors are identified. [9] Except for irrigated areas (typically, the Vaal and Orange valleys), the strongest growths between two successive NDVI values are detected during early summer, from September to December (Figure 1b). For each of the 4096 grid-points, we define the early summer vegetation predictand as the difference between December and September NDVI: early summer NDVI (Sep– Dec0) in the following. The early summer NDVI, spatially averaged over each SA sub-region, is then related to the concurrent and lagged rainfall amounts based on linear regressions, in order to separate the direct NDVI response to rainfall from the other effects, including memory effects. For such purpose: (1) simple linear regressions are performed between the early summer NDVI and 2-month running means of rainfall amounts: the residual values represent the NDVI variations which could not be interpreted as direct vegetation responses to rainfall; and (2) the residuals of the linear regression, showing a maximum of correlation between early summer NDVI and rainfall amounts, are correlated with potential predictors with 4 to 15-month time-lag. These lagged relationships are supposed to be mainly representative of the memory effects. [10] The potential predictors, spatially averaged over each SA sub-regions, are defined, based on 3-month (trimestrial) running means of rainfall amounts, number of rainy days, rainfall intensity (rainfall amounts/number of
rainy days), NDVI, and Rain-Use Efficiency (RUE) expressed as the ratio of NDVI to rainfall amounts.
4. Results 4.1. Direct Response of Vegetation to Rainfall [11] The synchronous and lagged correlations between the early summer NDVI and the rainfall amounts depict a maximum of correlation between the early summer NDVI (Sep– Dec0) and the October – November integrated rainfall amount (Oct – Nov0). The six associated linear regressions, obtained for each SA sub-regions, are presented in Figure 2. Interestingly, substantial enhancements of NDVI (corresponding to green-up onsets with Sep – Dec0 > 0.02) are found only when rainfall during Oct – Nov0 period exceeds 40– 50 mm, confirming the existence of a rainfall threshold for these semi-arid biomes, whereas in forested areas, several authors have noticed leafing of woodland canopies in the virtual absence of contemporaneous rainfall. [Fuller and Prince, 1996; Schwinning and Sala, 2004; Zhang et al., 2005]. Beyond these thresholds (Oct –Nov0 rainfall > 40/50 mm and Sep– Dec0 NDVI > 0.02), the scatter-plots describe strong linear trends, whatever the vegetation type. For example, dry 1990, 1994 or 1997 early summers are associated with a lack of green-up between the September and December months, whereas 1993 early summer was both rainy and green. Nevertheless, some early summers differ from the typical relationship. For example, taking into account the Oct – Nov0 rainfall amounts, 1988 or 1991 are not very green, while 1987 or 1999 surprisingly are. It is also worth noting that the highest slopes are found for types 11 and 12, located in the North – Eastern corner of the SA region, which is also the wettest sector of the area. However, as no particularly wet early summers have occurred elsewhere during the 19-year time-period, it is
2 of 6
L13704
RICHARD ET AL.: INTERANNUAL MEMORY EFFECTS FOR SPRING NDVI
L13704
Figure 2. Linear regressions between early summer NDVI (December NDVI minus September NDVI, Sep– Dec0) and October –November (Oct – Nov0) integrated rainfall amounts for the six SA sub-regions, representative of a given landcover type and associated ecosystem: dotted lines, Oct – Nov0 rainfall 40/50 mm and Sep –Dec0 NDVI 0.02 thresholds; red, dry early summer with lack of green-up; green, wet early summer with a strong green-up; blue, wet early summer without a strong green-up; and purple, dry early summer with a surprising green-up.
difficult to conclude that rainfall is less efficient for the driest ecosystems. 4.2. Sever to 14-month Memory Effects [12] The residuals of the linear regression between the early summer NDVI and the Oct –Nov0 integrated rainfall amount are now considered. The correlation between the residuals and the rainfall amounts (Figure 3, bold dark grey curve) is not significant when the time-lag is lower than seven months. It is negative, and become significant, between seven months (referring to the 15 February – 15 May period, with the 1st April considered as the median date) and ten months (referring to the 15 November – 15 February period, with the 1st January, start of the late summer rainy season, considered as the median date). The relationship with the previous late summer rainy season is observed for the six SA ecosystems, from type 11 – open deciduous shrub to type 21 – bare soil.
[13] This 7 to 10-month time-lag effect (Figure 3, light grey column) is stronger for the driest biomes (types 13, 14, 15, 21), and always positively linked to efficient rainfall (i.e. positive correlation with the RUE, thin black curves). It is worth noting that similar results are obtained when considering other rainfall variables such as number of rainy days (thin dark grey curves), and rainfall intensity (bold light grey curves). Finally, the negative correlations between the residuals and the NDVI (Figure 3, bold black curve) also result from the rainfall patterns, with one to two months delay. [14] The residuals of the six linear regressions (Figure 3) are also correlated, but positively, with a one-year time-lag (12 to 14-month time-lag, represented by the dark grey column (bold black curves). Interestingly, these correlations are independent from the rainfall predictors (grey curves), and are maximum (between 0.3 and 0.7) for a lag of about 13 months (referring to the 15 August – 15 November
3 of 6
L13704
RICHARD ET AL.: INTERANNUAL MEMORY EFFECTS FOR SPRING NDVI
L13704
Figure 3. Correlations between the early summer NDVI and different predictors: bold dark grey, rainfall amounts; thin grey, number of rainy days; bold light grey, rainfall intensity; bold black, NDVI; and thin black, RUE. The horizontal axis represents the trimestrial time-lags: AMJ stands for the average of the predictors over the period 15th April – 15 June, the 1st June being the median date. The ‘‘0’’ and ‘‘ 1’’ indices represent the concurrent year and the previous year, respectively. The light (dark) grey shadow in the backward of each plot stands for the 7 to 10-month (12 to 14-month) timelag. The dashed black horizontal lines represent the 95% significant level of correlations. period, with the 1st October considered as the median date). They are significant for the most homogeneous and short vegetation types 14 – open grass and 21 – bare soil (and also 11, which is under-represented in the SA region), suggesting that 12 to 14-month time-lag effect is more noticeable over the western parts of the SA region which is covered by grass rather than shrubs.
5. Discussion and Conclusions [15] For the six SA sub-regions, representative of a given land-cover type and associated ecosystem, the interannual variations for the 1981 –1999 period of the early summer NDVI (December NDVI minus September NDVI) have
proved to be mainly driven by the Oct –Nov0 integrated rainfall amount. On the other hand, the interannual variability of the winter conditions (May to August), always very dry in SA, does not seem to influence early summer NDVI. These results are true for most of the different vegetation types. Conversely, the vegetation type plays an important role in both observed memory effects, which correspond to two distinct time-lags. [16] Firstly, the ‘‘negative’’ 7 to 10-month time-lag memory (related to rainfall and vegetation), associated with January to April (late rainy summer season) meteorological conditions, can be summarized as follows: above-normal rainfall amounts, which imply above-normal NDVI, do not support the green-up of the next early summer. This
4 of 6
L13704
RICHARD ET AL.: INTERANNUAL MEMORY EFFECTS FOR SPRING NDVI
‘‘negative’’ effect rules out a memory linked to soil moisture. A potential explanation could consist in the fact that heavy rainfall and, hence, surface run-off surplus, could wash carry the seeds of former early summer species away (such results were obtain after a run-off experiment in semi arid woodland in Northern Ethiopia, with a seed loss of nearly 33% [Aerts et al., 2006]) or make them root or even germinate prematurely. Such hypotheses are consistent with the results obtained mainly for grassland types 13 and 14, but not with type 12 (closed grassland). An asynchronous germination could guarantee that seedling mortality is spread over a longer period, thus providing better possibilities of success for some of them. This asynchrony produced by the intervention of different disperser types has been interpreted as an adaptation to geographical zones where rainfall is rather unpredictable [Nogales et al., 2006]. [17] The bad or late filling of seeds due to abundant late summer rains can also explain a negative correlation with early summer NDVI and thus an indirect effect of the seed bank for annual herbaceous species. The direct impact consists of a germination step of herbaceous type during the late summer which does not allow a correct regeneration of the seed bank. Usually, the dry matter derived from this late summer vegetation cannot be degraded entirely, thus creating a barrier for the next early summer germination period. In addition, high productivity related with NDVI during the previous late summer can also support the dynamics and health of herbivorous populations which increase the pressure the next early summer [Kelt et al., 2004]. The needs will be particularly high during the early summer reproductive season. [18] Secondly, the ‘‘positive’’ 12 to 14-month time-lag memory (related to NDVI alone), which was already observed in 2001 by O’Connor et al. [2001], concerns the Rainfall Use Efficiency. It can be interpreted as follows: a strong photosynthetic activity at the beginning of early summer (Sep – Oct 1), followed by modified environmental factors due to water availability during Oct– Nov 1 of the previous year, could control the germination response, which could in turn affect the dynamics of communities dominated by annual species [Rivas-Arancibia et al., 2006] a year later. Such explanation would be consistent with the results obtained for ecosystems of type 13 and 14, the former being covered by sparse shrubs, thus, favouring less germination. [19] Ecological rules such as the relation between the production of seeds during early summer and the response of grasslands can also explain the 10 –12 memory effect [Knapp et al., 2004; Meserve et al., 2003; Gutie´rrez et al., 2000]. Moreover, the dormancy and bet-hedging traits of certain ephemerals are identified as delayed germination strategies in arid and desertic zones associated with high climatic variability [Venable, 2007; Clauss and Venable, 2000]. In addition, straw produced during a rainy season generally improves the conditions for germination (protection against evaporation) and turn-over of nutrients available for the next year (delay for the degradation and decompositon). [20] In summary, the current paper led to a better understanding of the nature and associated time-lags regarding the mechanisms involved in the memory effects, which have proved to be preferably attributed to biological processes (herbivorous, seed bank, straws. . .) instead of hydrology
L13704
(i.e. memory linked to soil moisture). However, the analyses were performed on a relatively short time-period, and it would be interesting, for future studies, to extend the length of the time series by including recent measurements in order to test the robustness of the observed relationships and associated analyses. Note, however, the limitation over South Africa, as the high-resolution WRC rainfall data set is not available after 1999. Another aspect of interest would be to better study the biological processes determining the memory effects linked to vegetation. [21] Acknowledgments. Rainfall data were provided by the Water Research Commission (WRC). We thank the Global Inventory Monitoring and Modelling Systems (GIMMS) group at the National Aeronautics and Space Administration (NASA) for providing with the NDVI data set. Mathieu Rouault, Nicolas Vigaud and Nicolas Fauchereau thank the WRC, UCT and NRF for support. This is a contribution to a PICS CNRS NRF France South Africa project.
References Aerts, R., W. Maes, E. November, M. Behailu, J. Poesen, J. Deckers, M. Hermy, and B. Muys (2006), Surface runoff and seed trapping efficiency of shrubs in a regenerating semiarid woodland in northern Ethiopia, Catena, 65, 61 – 70. Bartholome´, E., and A. S. Belward (2005), GLC2000: A new approach to global land cover mapping from Earth observation data, Int. J. Remote Sens., 26, 1959 – 1977. Camberlin, P., N. Martiny, N. Philippon, and Y. Richard (2007), Determinants of the interannual relationships between remote sensed photosynthetic activity and rainfall in tropical Africa, Remote Sens. Environ., 106, 199 – 216. Clauss, M. J., and D. L. Venable (2000), Seed germination in desert annuals: An empirical test of adaptive bet hedging, Am. Nat., 155, 168 – 186. Fuller, D. O., and S. D. Prince (1996), Rainfall and foliar dynamics in tropical southern Africa: Potential impacts of global climatic change on savanna vegetation, Clim. Change, 33, 69 – 96. Gondwe, M. P., and M. R. Jury (1997), Sensitivity of vegetation (NDVI) to climate over southern Africa: Relationships with summer rainfall and OLR, S. Afr. Geogr. J., 79, 52 – 60. Gutie´rrez, J. R., G. Arancio, and F. M. Jaksic (2000), Variation in vegetation and seed bank in a Chilean semiarid community affected by ENSO 1997, J. Vegetation Sci., 11, 641 – 648. Jury, M. R., S. Weeks, and M. P. Gondwe (1997), Satellite-observed vegetation as an indicator of climate variability over southern Africa, S. Afr. J. Sci., 93, 34 – 38. Kelt, D. A., P. L. Meserve, M. L. Forister, L. K. Nabors, and J. R. Gutie´rrez (2004), Seed predation by birds and small mammals in semiarid Chile, Oikos, 104, 133 – 141. Knapp, A. K., et al. (2004), Generality in ecology: Testing North American grassland rules in South African savannas, Front Ecol. Environ., 2, 483 – 491. Kogan, F. N. (1998), A typical pattern of vegetation conditions in southern Africa during El Nin˜o years detected from AVHRR data using threechannel numerical index, Int. J. Remote Sens., 19, 3689 – 3695. Lynch, S. D. (2003), Development of a RASTER database of annual, monthly and daily rainfall for southern Africa, Rep. 1156/1/03, 78 pp., Water Res. Comm., Pretoria, S. Afr. Martiny, N., Y. Richard, and P. Camberlin (2005), Interannual persistence effects in vegetation dynamics of semi-arid Africa, Geophys. Res. Lett., 32, L24403, doi:10.1029/2005GL024634. Meserve, P. L., D. A. Kelt, W. B. Milstead, and J. R. Gutie´rrez (2003), Thirteen years of shifting top-down and bottom-up control, BioScience, 53, 633 – 646. O’Connor, T. G., L. M. Haines, and H. A. Snyman (2001), Influence of precipitation and species composition on phytomass of a semi-arid African grassland, J. Ecol., 89, 850 – 860. Oesterheld, M., J. Loreti, M. Semmartin, and O. E. Sala (2001), Interannual variation in primary production of a semi-arid grassland related to previous-year production, J. Vegetation Sci., 12, 137 – 142. Nogales, M., C. Nieves, J. C. Illera, and D. P. Padilla (2006), Native dispersers induce germination asynchrony in a macaronesian endemic plant (Rubia fruticosa, Rubiaceae) in xeric environments of the Canary Islands, J. Arid Environ., 64, 357 – 363. Philippon, N., E. Mougin, L. Jarlan, and P.-L. Frison (2005), Analysis of the linkages between rainfall and land surface conditions in the West
5 of 6
L13704
RICHARD ET AL.: INTERANNUAL MEMORY EFFECTS FOR SPRING NDVI
African monsoon trough CMAP, ERS-WSC, and NOAA-AVHRR data, J. Geophys. Res., 110, D24115, doi:10.1029/2005JD006394. Richard, Y., and I. Poccard (1998), A statistical study of NDVI sensitivity to seasonal and interannual rainfall variations in southern Africa, Int. J. Remote Sens., 19, 2907 – 2920. Rivas-Arancibia, S. P., C. Montao`a, J. X. Velasco Hernandez, and J. A. Zavala-Hurtado (2006), Germination responses of annual plants to substrate type, rainfall, and temperature in a semi-arid inter-tropical region in Mexico, J. Arid Environ., 67, 416 – 427. Sankaran, M., et al. (2005), Determinants of woody cover in African savannas, Nature, 438, 846 – 849. Schwinning, S., and O. E. Sala (2004), Hierarchy of responses to resource pulses in arid and semi-arid ecosystems, Oecologia, 141, 211 – 220. Schwinning, S., O. E. Sala, M. E. Loik, and J. R. Ehleringer (2004), Thresholds, memory, and seasonality: Understanding pulse dynamics in arid/semi-arid ecosystems, Oecologia, 141, 191 – 193. Tucker, C. J., J. E. Pinzon, M. E. Brown, D. A. Slayback, E. W. Pak, R. Mahoney, E. F. Vermote, and N. El Saleous (2005), An extended
L13704
AVHRR 8-km NDVI data set compatible with MODIS and SPOT vegetation NDVI data, Int. J. Remote Sens., 26, 4485 – 4498. Venable, L. (2007), Bet hedging in a guild of desert annuals, Ecology, 88, 1086 – 1090. Zhang, X., M. A. Friedl, C. B. Schaaf, A. H. Strahler, and Z. Liu (2005), Monitoring the response of vegetation phenology to precipitation in Africa by coupling MODIS and TRMM instruments, J. Geophys. Res., 110, D12103, doi:10.1029/2004JD005263. N. Fauchereau, C. Reason, and M. Rouault, Oceanography Department, University of Cape Town, 7701 Rondebosh, South Africa. N. Martiny, Y. Richard, and N. Vigaud, Centre de Recherches de Climatologie, UMR 5210 CNRS/Universite´ de Bourgogne, 6 Bd. Gabriel, F-21000 Dijon, France. (
[email protected]) Y. Tracol, Centro de Estudios Avanzados en Zonas Aridas (CEAZA), Benavente 980, La Serena, Chile.
6 of 6