postsecondary programs at their child's school regarding financial aid possibilities, ...... percent (147 respondents) reported having a vocational degree, and it is ...
The Intergenerational Breakthrough of First-Generation Higher-Education Students Anat Gofen Institute for Research on Poverty, UW-Madison School of Public Policy, Hebrew University February 2008 Abstract The first children in a family to attain a higher education embody the realization of social mobility. This study focuses on how the intergenerational cycle of disadvantage is broken. Data were drawn from the National Educational Longitudinal Study 88/2000, selecting only individuals whose parents did not attain college, and comparing the ones who succeeded in breaking the intergenerational cycle to those who did not. The study presents a new approach to the conceptual framework of family capital, defined as the ensemble of means, strategies, and resources embodied in the family’s way of life that influences the future of the children. Family capital elaborates how prioritization of education is reflected through key nonmaterial resources at a family’s disposal. Previous analysis has often portrayed first-generation students as succeeding despite their family background. In contrast, this study suggests that, whereas they face many material challenges, the families of first-generation students are often a key resource through nonmaterial supports rather than a constraint. The analysis demonstrates a significant link between breaking the intergenerational cycle and family capital, as conceptualized here. This study emphasizes the essential role of the family in breaking the intergenerational cycle. Anat Gofen, February 2008 Under review, please do not circulate
1
First-generation higher-education students embody the realization of "equal opportunity" as evidenced by one's chances to acquire education at any level, independent of one’s background. The importance of first-generation students is that their educational mobility leads to social mobility, as education is key for many other aspects of well-being (e.g., Cohn and Geske 1990; Haveman and Wolfe 1984; Mortenson 2000). However, a long tradition of intergenerational mobility research has demonstrated a strong link between the educational achievements of parents and the educational achievements of their offspring (e.g., Biblarz and Raftery 1999; Haveman and Wolfe 1995; Karen 2002; Mayer 1997). Evidence from these studies indicates that to a large extent children “inherit” their parents’ educational achievements, although parents and adolescents, even those of low socioeconomic status, value education and have high ambitions (e.g., Jencks et al. 1972; Kim and Schneider 2005; Schneider 2003). Breaking that intergenerational cycle is difficult, because although they may be ambitious, many of them will not fulfill their expectations due to limited resources (Schneider 2003). Families of first-generation college students are an exception to the rule, especially families of students who complete their degree. We seem to know much about the intergenerational persistence of educational achievement but relatively little about breaking that pattern of persistence. Unlike most studies in the field, which examine the link between parental education to that of their offspring, this study investigates only individuals whose parents did not attain college, and seeks to reveal why and how some individuals succeed in breaking the intergenerational cycle, while others do not. The comparison between individuals who had the same starting point, but experienced a different outcome enables investigation of how an intergenerational breakthrough takes place. Anat Gofen, February 2008 Under review, please do not circulate
2
We appear to know much about the life of first-generation college students, not only during their college years, but also prior to college: demographic characteristics, academic preparation, the college choice process, and the transition from high school to postsecondary education. Nevertheless, relatively little is known about what enabled those students to become the first in their families to attend college and to complete a college degree. A few recent studies (McCarron and Inkelas 2006; Kim and Schneider 2005; Schneider 2003; Swanson and Schneider 1999), which explored successful transitions from high school to postsecondary education, demonstrate how different aspects of the individual’s life, such as family background, parental educational level, parental expectations, extracurricular activities, and social capital of the family affect the path to college. The study presented here accords with these studies, though it differs in several important ways: First, it offers a deeper theoretical framework to investigate the role of the family in creating an intergenerational breakthrough, specifically in the context of individuals who are first in their family to attain college. This framework, referred to as family capital, emphasizes the contextual setting of the family in which aspects of social capital and cultural capital intersect, and treats it as crucial for intergenerational breakthrough. Family capital is defined as the ensemble of means, strategies, and resources embodied in the family’s way of life that influences the future of the children. Family capital is implicitly and explicitly reflected in behavior, core values, time usage, time perception, and emotional processes. Second, this study focuses on potential first-
Anat Gofen, February 2008 Under review, please do not circulate
3
generation students. And third, it emphasizes degree completion, not only college enrollment. Previous analysis has often portrayed first-generation students as succeeding despite their family background. In contrast, this study suggests that, whereas they face many material challenges, the families of first-generation students are often a key resource rather than a constraint. My main argument is that the investment of nonmaterial resources a family makes during its formative years can lead to intergenerational breakthrough, which is exemplified in individuals who are the first in their family to attain college. INTERGENERATIONAL MOBILITY AND FIRST-GENERATION HIGHER-EDUCATION STUDENTS Intergenerational mobility research and studies investigating first-generation students share similar concerns and demonstrate similar findings: upward mobility is not easy to achieve, and breaking the intergenerational cycle is often an exception to the rule. There is a long tradition of intergenerational mobility research that typically addresses the whole population, whereas the study of first-generation students is an emerging field that usually focuses on individuals who are the first in their family to attain college and compares them to their peers, referred as second-generation students. Intergenerational mobility research focuses on how the socioeconomic status of one’s family of origin is associated with one’s own (e.g., Warren and Hauser 1997). Many studies have demonstrated a strong link between the socioeconomic status of parents and the socioeconomic status of their offspring, indicating that to a large extent children “inherit” their parents’ socioeconomic status (e.g., Bowles and Gintis 2002; Anat Gofen, February 2008 Under review, please do not circulate
4
Conley 2001; Mulligan 1999; Solon 1992, 2002), and will most probably continue to follow that rule (e.g. Gamoran 2001). Specifically, an individual’s educational attainment is strongly linked to his or her parents’ educational attainment. Being the first in their families to go to college, first-generation students challenge that notion. The growing number of first-generation students is one of the trends in postsecondary education in the United States (Baker and Velez 1996; Kojaku and Nunez 1998; Pascarella and Terenzini 1998). Choy (2001) compares access rates of firstgeneration students to college students whose parents have a college degree. His findings indicate that among potential first-generation students, 27 percent of 1992 high school graduates went on to college. This rate increased to 75 percent among those whose parents had some college experience, and to 93 percent among those who have at least one parent with an undergraduate degree. The emerging research on first-generation students typically focuses on: (a) comparing first-generation students to their peers (second-generation higher-education students) in various respects, such as access rates, academic preparation, demographic characteristics, college experience, academic achievements, cognitive development, academic expectations, and responses to intervention programs (e.g., Choy 2001; Pascarella and Terenzini 1998); and (b) identifying patterns within the group of firstgeneration students, such as selectivity of college attended (e.g., Davies and Guppy 1997; Lopez-Turley 2006), dropout rates, and transition among colleges (e.g, Goldrick-Raab 2006; Tienda and Alon 2005). Comparison of first-generation students with their peers whose parents attained college indicates major differences. Examination of demographic characteristics, Anat Gofen, February 2008 Under review, please do not circulate
5
academic preparation, the college choice process, and college expectations indicates that first-generation students tend to be at a distinct disadvantage in several respects: essential knowledge about postsecondary education (e.g., the enrollment process and financial demands), level of family income, family support, educational degree expectations and plans, and academic preparation in high school (e.g., Berkner and Chavez 1997; Horn and Nunez 2000; Hossler, Schmit and Vesper 1999; Pratt and Skaggs 1989; Stage and Hossler 1989; Warburton, Bugarin and Nunez 2001; York-Anderson and Bowman 1991). Comparing the transition from high school to postsecondary education (e.g., Lara 1992; London 1989; Rendon and Hope 1996), as well as persistence in college, degree attainment, and early career labor market outcomes (e.g., Billson and Terry 1982; Choy 2001; Horn 1998; Nunez and Cuccaro-Alamin 1998; Warburton, Bugarin and Nunez, 2001) provides more evidence concerning the disadvantages of first-generation students, especially with respect to degree completion and level of degree. Not only do firstgeneration students confront the anxieties, dislocations, and difficulties of any college student, but their experiences often involve substantial cultural and social and academic transitions as well. After interviewing first-generation students, London (1989) emphasized the difficulties in achieving social mobility, which include isolation, confusion, and conflict. THE ROLE OF THE FAMILY IN EDUCATIONAL ATTAINMENT Ever since Blau and Duncan (1967) illustrated how family background affects the socioeconomic status of children through their education, most of the stratification studies have explored the educational attainment of children (Conley 2001). A wellestablished literature demonstrates how various family characteristics affect the Anat Gofen, February 2008 Under review, please do not circulate
6
educational outcomes of children; especially influential are how parents supervise the schooling of their offspring through allocation of resources, choosing among educational options, and emphasizing the value of education (Baker and Stevenson 1986). Family characteristics include family background, such as income (e.g., Conley 2001) and cultural capital (e.g., DiMaggio 1982; Roscigno and Ainsworth-Darnell 1999); family functioning, such as parental involvement (e.g., Fan and Chen 2001; Muller and Kerbow 1993) and parental expectations (e.g., McCarron and Inkelas 2006). Some scholars emphasize that there is an “overall quality” of family traits which determines the academic competence of children (Clark 1983). Lareau (2000, 2003), who introduced new insights about the daily life of middle-class, working-class, and poor families, argues that the daily-life aspects of parents and children, such as the use of language and the use of time, are strongly associated with their social class. This study further investigates the Lareau’s insights, however, I emphasize the variation among families whose parents did not attain college. Evaluating family socioeconomic status, family background, and parental involvement among first-generation students indicates that they experience a strong “culture shock” in college (Inman and Mayes 1999). Not only do they generally come from lower-income homes, where parents lack the knowledge of campus environment and the enrollment process, they also encounter, on average, a lower level of family support and a lower level of importance placed on college by parents (McConnell 2000; York-Anderson Bowman 1991). Parents of first-generation students generally help their children less (Thayer 2000), and specifically do not help them in the process of deciding
Anat Gofen, February 2008 Under review, please do not circulate
7
what college to choose, compared to parents with a college degree (Billson and Terry 1982; Choy 2001; York-Anderson and Bowman 1991). Those studies often portray first-generation students as succeeding despite their family background. I argue that to a large extent this conclusion derives from the comparison of first-generation students with their peers. Comparing first-generation students to potential first-generation students who did not break the cycle will reveal that families of first-generation students are a key component in the breakthrough process. Investing the nonmaterial resources at a family’s disposal serves as a strategy to channel their educational expectations and aspirations into educational attainment; put differently, they are translating their high value of education into actual results. This argument follows many studies of primary and secondary education, which demonstrate the important role the family plays, even among disadvantaged families, with respect to academic achievements of children (e.g., Buchmann and Dalton 2002; Hanson 1994). Kim and Schneider (2005) study the effect of social capital on the transition to postsecondary education, focusing on how the alignment of parental support affects the adolescent transition to postsecondary education. Employing Coleman’s approach to social capital, they demonstrate how various aspects of interpersonal relationships of parents and children, such as discussions, aspirations, and time spent together, support this transition. Following this approach, this study focuses on family capital as the conceptual framework for analyzing the breakthrough of first-generation highereducation students, and suggests that the predictors of the intergenerational breakthrough are reflected in the investment of nonmaterial resources parents make during the formative years. Anat Gofen, February 2008 Under review, please do not circulate
8
CONCEPTUALIZING FAMILY CAPITAL The meaning of capital emphasizes the investment of resources that is made for the benefit of future outcomes (Lin, 2001). Parents who invest in their children usually expect that future benefits will follow their investment. Becker and Tomes (1986) specified the underlying assumption of parents’ investment in their children’s health, skills, and learning through their concern about their children’s future success and economic capabilities. By and large, scholars make use of the terms family capital, family-based social capital, and family social capital as a subset of social capital. Social capital essentially reflects the value embedded within social relations. The literature presents two approaches to this well-known notion. One approach, usually referred to as Coleman’s approach to social capital, focuses on the relationships within and between social organizations, put differently, “social closure.” This approach “emphasizes solidarity, social control, identity and the enforcement of pro-academic norms” (Kim and Schneider 2005:1198). Coleman (1990:300) placed social capital in the context of the family: “Social capital is the set of resources that inhere in family relations and in community social organizations and that are useful for the cognitive or social development of a child or a young person.” Following that notion, scholars who study social capital, view the family as one of the contexts for generating and accumulating social capital (Coleman 1990; Furstenberg 2005; Furstenberg and Hughes 1995; Putnam 1995, 2000), and therefore usually referred to as family social capital or family-based social capital. The second approach to social capital, as presented by Bourdieu (1986), “focuses on differential access to institutional resources” (Kim and Schneider 2005:1198)3. This Anat Gofen, February 2008 Under review, please do not circulate
9
approach views social capital as an attribute of the individual, which is determined by one’s social context. Reflecting the extent to which an individual has access to resources through social relationships, both on a personal basis and by group membership, social capital captures the value embedded in available networks that can be altered into gains, mainly economic, and therefore serves as a mechanism of social inequality. Family capital as a subset of social capital, takes on different aspects in different studies. Sometimes it pertains to the social capital found within the family unit and in other cases the social capital that a family unit “owns.” In other words, family capital may express the social links among family members, sometimes the social relationships of a family, and sometimes the accumulation of human and cultural capital within the family. Employing family capital as a conceptual framework, I argue that the predictors of the intergenerational breakthrough are reflected in the investment of nonmaterial resources parents make during the formative years. However, family capital is here presented in a perspective different from its customary use in the literature. Instead of considering a specific type of capital, I emphasize the context or the setting in which capital resides.
Anat Gofen, February 2008 Under review, please do not circulate
10
Social Capital
Family-based Social Capital
Family Capital
Family-based Cultural Capital
Family members’ Human Capital
Human Capital Cultural Capital
Figure 1. Conceptualization of Family Capital The concept of family capital captures the various ways in which the family affects the future of its children, especially with respect to the investment process. Accordingly, family capital does not highlight only interpersonal relationships, as does social capital, or values, as does cultural capital. As an alternative, family capital attempts to capture all aspects of investment made by the family for the benefit of the children’s future. Hence, family capital is constructed from aspects of social capital, aspects of cultural capital, and additional features of a family’s day-to-day life. Furthermore, family capital emphasizes the unique and vast influence the family exerts on its members’ life,
Anat Gofen, February 2008 Under review, please do not circulate
11
by distinguishing it from other social organizations or networks. My definition of family capital is as follows: The ensemble of means, strategies, and resources embodied in the family’s way of life that influences the future of the children. Family capital is implicitly and explicitly reflected in behavior, core values, time usage, time perception, and emotional processes. This definition implies that every family has family capital, and that family capital is generic and applicable in a variety of contexts: family capital of foreignborn individuals, family capital of single-parent families, family capital of large households, etc. As families of first-generation students are usually not rich in terms of economic resources, in the study presented here, family capital focuses on the nonmaterial resources at a family’s disposal. Family capital is examined as predicting intergenerational mobility, and differentiating between those individuals who succeeded in breaking the intergenerational cycle, by comparing them to individuals who did not succeed in breaking the cycle, the latter being a more common pattern. The leading questions asked here are: What differentiates families of first-generation students from other families in which parents did not attain college? Do these families share common motives and strategies? Can we identify those motives and strategies? DATA AND MEASURES Data were drawn from the National Educational Longitudinal Study (NELS), which was conducted by the National Center for Education Statistics (NCES) of the U.S. Department of Education. NELS 88/2000 is a stratified national probability sample of 24,599 eighth-grade students from 1,052 schools in the United States who were asked about family, attitudes, behaviors, relationships, school work, and daily activities. Anat Gofen, February 2008 Under review, please do not circulate
12
Parents, teachers, and school administrators also participated in the survey. The sample of respondents was followed up four times-in 1990, 1992, 1994, and 2000. In the final wave (2000) the sample included 12,144 participants, all 26 or 27 years old. Sample Investigating why and how some individuals succeed in breaking the intergenerational cycle and some do not requires focusing on individuals who had the same starting point, that is, individuals whose parents did not attain college. Out of 12,144 cases, 8,573 are potentially first-generation students, that is, neither parent attained college. The sample definition is based on the NELS variable of highest education level of parents. Participants who had one parent who completed a two-year or more college degree were dropped (3,476 participants). Participants with a missing value for highest education level of parents (95) were dropped as well. As the variables are drawn from all waves, only the participants in all waves, including the base year (1988) and the four follow-up years (1990, 1992, 1994, and 2000) were selected (N=7,630). Among them, 7,442 had transcript data that were used to define the participant’s educational attainment. For the rest, 208 respondents, I used the self-reported educational level.4 Breakthrough measurement Because many respondents who enrolled in college dropped out without completing a degree (60 percent of those who enrolled in college did not complete a degree), the intergenerational breakthrough is measured in three ways: enrolling in college, completing a two-year college degree or more, and completing a bachelor’s degree or more. A first-generation student who enrolled in college is a participant who Anat Gofen, February 2008 Under review, please do not circulate
13
either attended college in the past or currently attends college (74 percent). A firstgeneration student who completed a two-year degree is a participant who completed at least one degree from a two-year college (nearly 40 percent of those who enrolled). A first-generation student who completed a bachelor’s degree or more is a participant who completed a bachelor’s degree or higher (30 percent of those enrolled). Scholars argue that “Most students who fail to graduate do not drop out because they were incapable of meeting academic requirements. They have for many other reasons. Inability to do the academic work is often much less important than loss of motivation, dissatisfaction with campus life, changing career interests, family problems, financial difficulties, and poor health” (Bowen and Bok 1998:55). Explanatory variables The independent variables consist of two groups: the participant’s background variables and family capital indicators. Background variables include those known to be linked to educational achievement. Family capital indicators include seven variables, based on eighteen variables in NELS. Nine of them are taken from the parent’s questionnaire and nine are taken from the participant’s questionnaire. All seven indicators are based on two criteria: (a) it is an indicator for prioritizing education via nonmaterial resources of the family; and (b) it reflects a family’s perspective. Most of the variables either ask the parent about an issue that relates to their child (e.g., financial aid for college, discussing the future), or ask the child about an issue that relates to one’s parents (e.g., what he/she knows about different parental expectations).
Anat Gofen, February 2008 Under review, please do not circulate
14
(A) Background variables Participant’s gender, an indicator for female, was included, as women have been shown to attain higher levels of education than men (e.g., Buchmann and DiPrete 2006). Participant’s race are indicators for African Americans, Asian, Hispanic, and, Native Americans. White is the omitted category. Participant immigration status is an indicator for foreign birth, as the literature indicates that the academic achievements of the foreign-born are lower than those of native born, even during kindergarten through high school (Schmid 2001). Family income is measured as the log of family income on the average of NELS income measures at 8th, 10th, and 12th grades. Family income values are coded as the midpoint of response categories. Family stability is an indicator for both biological parents living with the participant in 8th grade. Birth order indicates how many older siblings the participant has. Being early in the birth order was found to be an advantage with respect to academic achievements (e.g., Hanushek 1992). Siblings measures the number of siblings the participant has in 8th grade. Studies indicate a negative relationship between family size and educational attainment (e.g., Alwin and Thornton 1984; Blake 1985). School socioeconomic status, which reflects peer effects, is assumed to affect the academic achievement of children (e.g., Cooley 2006). It is measured as the percentage of free lunches provided in the school of the participant in 8th grade.
Anat Gofen, February 2008 Under review, please do not circulate
15
Grades, as an indicator for personal abilities and somewhat for teacher evaluation, are measured as the grades of the participant in 8th grade, as reported by the school (on a 4.0 scale). (B) Family capital indicators Family capital of first-generation students in this study mainly reflects those nonmaterial resources at a family’s disposal that reflect the enforcement of pro-academic values. Nearly all the indicators also reflect the involvement of parents in their offspring’s life, essentially with respect to academic achievements. Saving money is based on two questions presented to the parents about saving money: one during 8th grade, asking the parents whether they save money for college, and one during 12th grade, asking the parent whether he/she encourages his/her child to save money for college. Financial aid awareness is based on six questions in the parent’s questionnaire regarding eligibility to apply for college financial aid. Five of the questions include scholarships and grants, state loan programs, federal loan programs, college loan programs, and private education loans. Each answer of “yes” or “no” accumulated one more point, indicating that the parent is aware of this financial aid program. Each answer of “don’t know about this program” accumulated no points. For participating in postsecondary programs at their child’s school regarding financial aid possibilities, this variable accumulated one more point. This variable is an indication of parents’ awareness of financial aid possibilities, which reflects the time investment of parents to find out about the different possibilities, regardless of whether they are using this option or not. Anat Gofen, February 2008 Under review, please do not circulate
16
Discuss future plans consists of parents’ report of the frequency of discussing higher education plans with their children. This frequency reflects an involvement of the parent and a means through which pro-academic norms are enforced. Algebra consists of a question referred to the student in 8th grade, asking whether the parents want the student to take algebra in high school. Parents who did not attain college and expect their children to take algebra in high school reflect high expectations not only in a general manner but also in that they understand what is needed in order to succeed academically. Parental expectation is constructed from two variables asking the student in 8th grade how far in school the parents expect him/her to go. This variable is the accumulation of those two expectations. Using the parental expectations as perceived by the child mirrors a family perspective, as it emphasizes how the participant views parental expectations. School preparation and attendance consists of a factor analysis for five answers of the student regarding school preparation and attendance during 10th grade. Although this measure can be perceived as individual behavior rather than embedding a family perspective, interviews of first-generation students and their parents reveal that school attendance and preparation are considered as a main strategy, especially among parents with low levels of education, to express the importance of education (Gofen 2007a). Grades importance consists of a question asked in the 10th grade regarding the importance of grades. This indicates achievement as a family value, which has been found to be a central value in first-generation families (Gofen 2007a). Analytic plan Anat Gofen, February 2008 Under review, please do not circulate
17
To explore the role that family capital plays in upward mobility, logistic models were employed to estimate three outcomes, as many first-generation college students drop out without completing their degree: (1) enrollment in college (vs. non-enrollment); (2) completing a two-year degree or more (vs. college enrollment); and (3) completing a bachelor’s degree or more (vs. college enrollment). These three outcomes do not represent mutually exclusive groups, as students who completed a degree also appear in the group of students who enroll in college. However, these outcomes reflect three nested groups, each of which reflects a higher achievement from the former group: attending college, completing a two-year or more college degree, and completing a bachelor’s degree or more. Each outcome was estimated only with the background variables; then the family capital indicators were added. The background variables were chosen in order to control for background characteristics that have been found to affect educational achievements. Approximately 2,000 observations were omitted due to missing values of family capital variables. Of those observations, more than 91 percent are missing two variables or less of the family capital indicators. Estimating the models using multiple imputed data produced mainly similar results (see Appendix A). FINDINGS This analysis investigates whether the family capital of first-generation highereducation students predicts the intergenerational breakthrough. Family capital is perceived as the investment of nonmaterial resources during formative years that are aimed at educational achievements. This investment is regarded as the prioritization of education through saving money for the future, awareness of parents concerning financial Anat Gofen, February 2008 Under review, please do not circulate
18
aid possibilities, and frequency of discussions of future plans with their children. From the children’s perspective, indicators of family capital include school attendance and preparation, attitude toward grades, and perception of parental expectations concerning academic achievements and taking algebra. Predicted Probability to Breakthrough by Family Capital 1
Pr (breakthrough)
0.9 0.8 0.7 0.6 College Enrollment
0.5
B.A. or more
0.4 0.3 0.2 0.1 0 0
1
2
3
4
5
6
7
Family capital
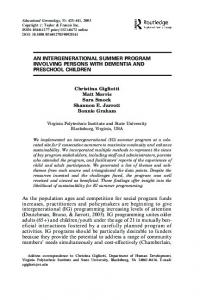
Figure 2: Predicted probability of Breakthrough by Family Capital2
Figure 2 illustrates the relationship of family capital to the probability of breakthrough. Predicted probabilities come from logistic regression models predicting two outcomes: college enrollment and a bachelor’s degree or more completion. As shown in Figure 2, increasing the level of family capital raises the predicted probability of breakthrough, both with respect to college enrollment and completing a bachelor’s degree or more. Furthermore, the predicted probability of completing a bachelor’s degree or more requires drastically higher levels of family capital than those of college enrollment. Anat Gofen, February 2008 Under review, please do not circulate
19
Maximum level of family capital increases the predicted probability of college enrollment to more than 0.977, whereas only to 0.703 with respect to completing a bachelor’s degree or more. Also, college enrollment levels off whereas bachelor’s degree or more completion does not. Table1. Background of Respondents Whose Parents Did Not Attain College, by academic achievement: mean values; (standard errors in parentheses) All
Never
Enrolled
Completed
Completed
Sample:
Attended
to
Two-Year or
B.A. or
Potentially
College
College
more College
more
First-
Variable Description
Degree
Generation Students Female
.542
.489
.560
.590
.596
(.498)
(.500)
(.496)
(.491)
(.490)
African
.106
.110
.104
.073
.074
American
(.307)
(.313)
(.305)
(.261)
(.263)
Asian
.047
.020
.056
.074
.086
(.211)
(.140)
(.230)
(.263)
(.281)
.155
.156
.155
.104
.093
(.362)
(.363)
(.362)
(.306)
(.291)
Native
.013
.022
.010
.005
.003
American
(.114)
(.147)
(.100)
(.075)
(.059)
Immigrants
.062
.043
.069
.083
.090
.241
(.203)
(.253)
(.277)
(.287)
Family
10.131
9.859
10.225
10.380
10.424
Log of average value of
Income
(.769)
(.818)
(.727)
(.653)
(.654)
family income (8th, 10th, 12th
Hispanic
grades). Income values coded as midpoint of response categories. Ranges 5.5212.20. Parents’
1.429
1.161
1.523
1.626
1.661
Highest parental education,
education
(.730)
(.784)
(.686)
(.607)
(.584)
8th grade.
Family
.661
.609
.680
.751
.756
If both biological parents live
Stability
(.473)
(.488)
(.466)
(.432)
(.429)
with the participant in 8th grade than is 1, 0 otherwise
Birth Order
1.548
1.786
1.465
Anat Gofen, February 2008 Under review, please do not circulate
1.345
20
1.301
Number of older siblings,
Siblings School SES Grades N
(1.764)
(1.901)
1.707
(1.612)
(1.558)
ranges 0 to 12
2.400
2.745
2.281
2.090
2.041
Number of siblings, 8th grade
(1.624)
(1.709)
(1.576)
(1.493)
(1.460)
3.461
3.846
3.326
2.950
2.867
Percentage of free lunches at
(1.958)
(1.829)
(1.984)
(1.964)
(1.963)
school, 8th grade
2.861
2.455
3.001
3.283
3.386
4.0 grade scale, 8th grade, as
(.733)
(.709)
(.688)
(.592)
(.542)
reported by school
7,630
1,975
5,655
2,247
1,708
Source: National Educational Longitudinal Study 88/2000, NCES Note: Weighted to be generalizable to the population of U.S. high school students
Table 1 presents the average background and family capital characteristics of five groups: (a) the whole sample — potential-first-generation students, that is, participants whose parents did not attain college; (b) potential-first-generation students who did not enroll in college; and three groups of breakthroughs: (c) first-generation students who enrolled in college; (d) first-generation students who completed a two-year college degree or more; and (e) first-generation students who completed a four-year degree or more. Results indicate that there are more women (54 percent) than men (46 percent) who are potential-first-generation students. Fewer women did not attend college (49 percent), and more women managed to break the intergenerational cycle: 56 percent attended college, 59 percent completed a two-year college degree or more and, nearly 60 percent completed a four-year college degree or more. African Americans constitute over 10 percent of potential-first-generation students; 11 percent of those never attended college, and lower percentages of those completed a degree (7.3 percent among a twoyear degree or more and 7.4 percent among four-year degree completion or more). As expected, Asians, who compose 4.7 percent of potential-first-generation students, succeeded to a greater extent than the other racial groups. They constitute only 2 percent Anat Gofen, February 2008 Under review, please do not circulate
21
of those who did not enroll in college, whereas 7.4 percent of those who completed a two-year college degree or more and 8.4 percent of those who completed a four-year college degree or more. Hispanics are represented in equivalent rates among potentialfirst-generation students, college nonattendance, and college attendance (15.5, 15.6 and, 15.5 percent, respectively). Of those who completed a degree there is a lower percentage (10.4 percent), and only 9.3 percent of those completed a bachelor’s degree or more. Foreign-born students had relative success in completing a degree: whereas they constitute 6.2 percent of those who are potential-first generation students, they compose 9 percent of those who completed a bachelor’s degree or more. Table 1 indicates also a monotonic increase in background characteristics: the higher the achievement, the higher the measures of background conditions. Higher outcome is associated with higher income, higher parental educational level, higher family stability, and higher socioeconomic status of the school. Note that being late in birth order and having fewer siblings increases achievement. Grades, which measure the personal ability of the participant and include in some manner the teachers’ evaluation of the participant as well, show the same tendency − the higher the outcome, the higher the grades.
Anat Gofen, February 2008 Under review, please do not circulate
22
Table2. Family Capital of Respondents Whose Parents Did Not Attain College: mean values (standard errors in parentheses) All
Never
Enrolled
Completed
Completed
Sample:
Attended
to
Two-Year or
B.A. or
Potentially
College
College
more College
more
Variable Description
Degree
FirstGeneration Students Save money
.799
.561
.864
.982
1.010
Parent saving money for
(.714)
(.644)
(.719)
(.731)
(.734)
college at 8th grade and parent encouraging the child to save money at 10th grade. Ranges 0-2
Financial aid
3.135
2.290
3.348
3.858
3.986
Based on parental awareness
awareness
(1.891)
(1.751)
(1.865)
(1.762)
(1.713)
for 5 scholarships/ grants/ loan programs and participating in school guidance program. Ranges 06.
Discuss
2.497
2.108
2.629
2.750
2.774
Asking the parent about the
future plans
(.651)
(.727)
(.565)
(.467)
(.449)
regularity of college plans discussions with their child. Range 1-3, a higher value means higher regularity
Algebra
1.057
.838
1.132
1.247
1.303
Asking the student, 8th grade,
(.772)
(.724)
(.774)
(.774)
(.766)
whether his/her guardians want him/her to take algebra in high school. Range is 0-2, the higher the value, the more certainty about guardian’s wish
Parental
8.528
7.308
8.932
9.433
9.719
Adding the schooling
Expectations
(3.232)
(3.492)
(3.035)
(2.704)
(2.445)
aspiration of the mother (0-6) and of father (0-6) according to the student’s report
Attendance &
0.000
-.157
0.047
.177
.207
Factor analysis of 5 variables
preparation
(.820)
(.912)
(.784)
(.710)
(.682)
about attendance and preparation to school, 10th grade.
Anat Gofen, February 2008 Under review, please do not circulate
23
Importance of
3.374
3.138
3.444
3.598
3.640
Based on question to the
grades
(.741)
(.812)
(.703)
(.620)
(.597)
student, how important grades are for him/her. Ranges 1-4
N
7,630
1,975
5,655
2,247
1,708
Source: National Educational Longitudinal Study 88/2000, NCES Note: Weighted to be generalizable to the population of U.S. high school students
As shown in Table 2, family capital characteristics reveal the same tendency: students who completed a bachelor’s degree or more are richer in terms of family capital than those who completed a two-year college degree or more; the latter have more family capital than those who enrolled in college, and those who enrolled in college have more family capital than those who did not. Put differently, the higher the achievement, the higher the measures of investment in education via nonmaterial resources. Even though they themselves did not have a college degree, parents whose children broke the intergenerational cycle are aware of different financial aid possibilities for college, they save money for college, and they frequently discuss college plans with their children. That reflects the ability of a parent to “translate” their high valuation of education into daily action. Family capital as measured from the children’s’ perspective indicates similar results. The higher the achievement, the higher the participants’ report of family capital indicators. Students who achieve more perceive higher expectations from their parents and perceive grades as important. These expectations are expressed both with respect to studying algebra in high school and to general academic achievements, asked in 8th grade. Participants who achieved more tended to miss or be late to classes less often and to prepare homework more often.
Anat Gofen, February 2008 Under review, please do not circulate
24
Regression analysis results, presented in Table 3, specify the effect of background conditions and the effect of family capital controlling for background characteristics on the intergenerational breakthrough. Also, they demonstrate the moderating effect of family capital on background measures. Table3. Logistic Regression Model for Intergenerational Breakthrough of 1992 High School Graduates (standard errors in parentheses) Enrolled
Enrolled
Completed
Completed
Completed
Completed
College Vs.
College Vs.
A 2-year Degree
A 2-year Degree
BA or more
BA or more
Not
Not
or more Vs.
or more Vs.
Vs. Enrolled
Vs. Enrolled
enrolled
enrolled
Enrolled
Enrolled
College
College
College
College
Model 5
Model 6
Model 2
Model 3
Model 4
.301***
.320*
.273**
.215*
.272**
.154
(.092)
(.142)
(.088)
(.106)
(.093)
(.107)
African
.585**
-.062
-.140
-.538**
.185
-.306
American
(.185)
(.317)
(.186)
(.199)
(.211)
(.222)
Asian
.303
.069
.146
-.418
.208
-.067
(.440)
(.577)
(.230)
(.260)
(.238)
(.284)
.820***
.818**
-.531***
-.738***
-.381*
-.587**
(.152)
(.269)
(.142)
(.172)
(.160)
(.191)
Native
-.091
.229
-.830
-1.112
-1.063
-1.042
Americans
(.324)
(.439)
(.668)
(.755)
(.743)
(.812)
Immigrants
.271
.000
.506*
.876***
.453*
.917***
(.256)
(.379)
(.198)
(.234)
(.203)
(.260)
.517***
.450***
.307***
.228*
.381***
.264**
(.071)
(.127)
(.076)
(.098)
(.083)
(.099)
.553***
.232*
.090
-.089
.157*
.010
Model 1
Background Female
Hispanic
Family income
Parental
Anat Gofen, February 2008 Under review, please do not circulate
25
education
(.065)
(.105)
(.069)
(.086)
(.078)
(.097)
Family
-.120
-.399*
.281**
.154
.218*
.042
Stability
(.104)
(.169)
(.105)
(.135)
(.109)
(.129)
Birth Order
.106***
.099*
.041
.042
.024
.068
(.032)
(.049)
(.041)
(.048)
(.040)
(.047)
-.169***
-.063
-.134***
-.108*
-.162***
-.160**
(.035)
(.054)
(.040)
(.052)
(.042)
(.052)
-.091***
-.133***
-.080**
-.075*
-.104***
-.078*
(.027)
(.039)
(.026)
(.032)
(.028)
(.032)
.875***
.663***
1.182***
.814***
1.494***
1.100***
(.066)
(.094)
(.069)
(.082)
(.077)
(.090)
Siblings
School SES
Grades
Family Capital .274*
.045
.041
(.111)
(.071)
(.072)
Financial aid
.149***
.231***
.240***
awareness
(.038)
(.030)
(.031)
Discuss future
.584***
.260*
.384***
plans
(.129)
(.113)
(.120)
Algebra
.260**
.090
.148*
(.087)
(.068)
(.070)
Parental
.054*
.020
.060**
expectations
(.022)
(.017)
(.019)
Attendance &
.061
.177*
.126
preparation
(.090)
(.070)
(.075)
Grades
.298**
.213**
.250**
importance
(.105)
(.083)
(.092)
Save money
N
6,782
4,033
5,047
3,398
4,919
3,336
Pseudo R2
0.159
0.192
0.146
0.160
0.181
0.196
Source: National Educational Longitudinal Study 88/2000, NCES Note: Weighted to be generalizable to the population of U.S. high school students *p