EER system based on the Class-E amplifier is given. 1. INTRODUCTION .... t¡ which is fed to the input of the amplifier can be simply represented as the original ...
INTERMODULATION PRODUCTS IN THE EER TECHNIQUE APPLIED TO CLASS-E AMPLIFIERS Dusan Milosevic, Johan van der Tang and Arthur van Roermund Eindhoven University of Technology, E.H. 5.28, P.O.Box 513, 5600 MB, Eindhoven, The Netherlands ABSTRACT Envelope Elimination and Restoration is a relatively old but attractive transmitter technique for high efficiency linear amplification of variable envelope RF signals. EER employs switching mode power amplifiers, which are extremely nonlinear but efficient, and the concept of supply voltage modulation to achieve linear performance. The bandwidth limitations in the envelope modulation path will have a strong impact on performance of the whole EER system. This paper derives analytic relationships between the transfer function in the envelope path of the EER system and IMD products in the output signal. The derived expressions are of generic character and can be used for an arbitrary transfer function in the envelope path. An estimation of the theoretical limit for IMD levels in the EER system based on the Class-E amplifier is given.
1.
INTRODUCTION
In the world of power amplifiers for wireless communications, the search for a system that would perform highly efficient and linear power amplification over a wide dynamic range of the input signal, is a process that lasts for decades. In today’s world of explosively growing wireless communication systems, solutions for simultaneously linear and efficient power amplification are needed more than ever. A variety of portable, battery-operated radio transmitting devices, that are becoming an inevitable part of a daily life, is putting the power amplifier (PA) efficiency in focus. Powerful new standards, such as Universal Mobile Telecommunications System (UMTS), will offer the end user an extensive range of high quality services (video, high-speed internet etc.) with high data rates in both uplink and downlink. The baseband processing in handsets is enormously increased, and the overall power consumption rises. Therefore, it is of the ultimate importance to achieve the highest possible efficiency in the PA stage, typically the largest power-consuming block in a handset.
mitter technique, which achieves high efficiency power amplification of variable envelope signals. The EER uses highly efficient switching type PAs and the supply voltage modulation principle to achieve linear amplification over a relatively wide dynamic range, without sacrificing the efficiency. The principle of the EER technique is depicted in figure 1. The input signal with variable envelope is passed through the phase detector, and fed to the input of the switching type PA. In the upper branch, the envelope of the input signal is extracted and used as a modulating signal for the supply of the PA. From the theoretical point of view, this is a perfect system. However, it is followed by a number of difficulties in practice. As Raab pointed out in [1], the finite envelope bandwidth and the differential delay between the envelope and RF path in the EER system are the two main parameters that will result in the intermodulation distortion (IMD) of the output signal. The main goal in this paper is to extend the work presented in [1] and derive analytic relationships between the IMD levels and an arbitrary transfer characteristic with gradual roll-off in the envelope modulation path. The structure of the paper is the following. In section 2, the IMD products that occur as a result of envelope filtering in an ideal EER system are analytically derived. In section 3, the EER concept applied to the Class-E PA circuit is simulated and the results are analyzed and discussed. 2.
In this section we will analyze the IMD products that occur when applying the EER technique. The approach will be based on a twotone signal, which conveniently provides simplicity for the analysis. This simplicity, however, does not compromise validity of the obtained results. A two-tone test signal can be easiest generated as a product of a low-frequency modulating signal and a high-frequency carrier, i.e. vi t
V dc
���
Envelope detector Amplitude modulator RF input
PA RF output Phase detector (limiter)
Figure 1. Block diagram of the EER concept The Envelope Elimination and Restoration is a relatively old trans-
IMD PRODUCTS IN EER
�
�
cos ωm t cos ωct 1 cos ωc ωm t 2
� ��
���
1 cos ωc 2
� �
ωm t
(1)
The two signals are taken with unity amplitudes, with ωm and ωc being the angular frequencies of the modulating signal and of the carrier, respectively. This type of signal is commonly referred to as a Double Side Band - Supressed Carrier signal (DSB/SC). The input signal from eq. 1 can also be represented as an amplitudeand phase-modulated wave, i.e.
��� � � � � vi t
Ei t cos ωct
� ����� � � φi t
Ei t vx t
(2)
where Ei t is the envelope of the input signal, fulfilling the condition Ei t 0 and φi t is the phase modulation of the RF carrier. In
�
L RFC
further expressions it is convenient to adopt the angular time given by θ ωm t. For the two-tone signal, it is easy to see that
��� � � ��� � � Ei t
and
φi t
cos ωmt cos θ cos θ
0 π
� � ���� �
�
vx t where cθ
�
���
���
� ����� �� ����� �� �
cos ωct
sgn cos θ
�
φi t
0 0
(4) Figure 3. Low pass LR network
�
c θ cos ωct 1 0 1
��
cos θ cos θ cos θ
�
������ �� �
�
(5)
|x|
c(t)
v x (t)
(6)
ωm
and
ϕk
& '
�
�
1
� � � � !�!�!
�*) + �� � � & ' � � � � !�!�!
H kωm
ϕ kωm
��� (
arctan
2
k ωm ωt
1
k
kωm ωt
arctan
123
k
(15)
123
(16)
Therefore, due to action of the lowpass RL circuit, the restored envelope of the output signal will be
v o (t)
PA
��� �
ω (14) ωt The amplitude and phase response of the filter at harmonic frequencies of ωm will be denoted as hk and ϕk , respectively, where ϕ ω
E o (t)
H(jω)
sgn(x)
and
hk
0 0 0
Since Ei θ and c θ are periodic signals, they can be expanded E i(t)
RA
(3)
The block diagram of the EER concept for study of IMD products is given in figure 2. In case the of the two-tone signal, the phase variation φi t corresponds to reversals in the carrier polarity. Therefore, signal vx t which is fed to the input of the amplifier can be simply represented as the original RF carrier multiplied by the switching function c θ ,
��
V 2 ( j ω)
V 1( j ω)
Eo θ
��� � � ∑� � � a0
am hm cos mθ
m 24
ωc
� � ϕm
(17)
The reconstructed signal at the output of the power amplifier can now be represented as Figure 2. Block diagram of the EER test system
��� � � ∑� � � � ��� � ∑� � � � � � � ��� � � � � � � � � � � ��� � � � � ��� � � � � " � " ��� % � "
into a Fourier series as Ei θ
am cos mθ
a0
m 246
and
cθ
cn cos nθ
n 135
a0
am cn
1 π
1 π
2π
0
0
sgn cos θ
(8)
�
cos θ d θ
cos θ cos mθ d θ
2π
0
2π
2 π
4 π
(9)
� � � � �! !�! � � � � � � !�!�! m 2
4 1 2 π m2 1
cos nθ d θ
(7)
1 n
m
n 1 2
24
n
(10)
13
(11) For reasons that will be explained later, it is of interest to study the effect of the simple lowpass RL network on the envelope signal Ei θ and, consequently, on the output signal and its spectrum. Therefore, we will consider the case where the envelope signal Ei θ is passed through the circuit depicted in figure 3. The transfer function of this circuit is H jω
V2 V1
1
1
jω
LRFC RA
1
1 j ω ωt
�� � #$ H ω ejϕ
ω
1
1
ω ωt
� ���
Eo θ vx t
�
� �
Eo θ c θ cos ωc t
�
2
(13)
��� �
y θ cos ωc t
�
(18)
where y θ is the modulating function. In order to analyze the IMD products in the output signal, it is necessary to consider product Eo θ c θ , i.e. the spectral content of the modulating function. From (17) and (8), we see that
� � ���-, � � ∑� � �
yθ
a0
am hm cos mθ
� /� . � ∑� � � � ϕm
cn cos nθ
n 135
�
(19) Therefore, the spectral components of the modulating function are the result of mixing of each of the spectral component in Eo θ with each of the spectral component of c θ . The presence of the phase term ϕm in (19) and the gradual roll-off of the lowpass transfer function require special attention and cause the analysis to be more complicated than in [1], where a simple truncation of the spectral terms in the envelope signal was used. Here, we will apply a series of trigonometric transformations in order to obtain analytic expressions for the IMD products. Thus, equation (19) can be rewritten as
�
�
yθ
��� � ∑� � � �� ∑�� �� ��
a0 cn cos nθ
n 13
���
am hm cn cos mθ
m 24 n 13
(12)
where ωt RA LRFC represents the corner (3dB) frequency of the filter. The amplitude and phase characteristic are H ω
���
m 24
where coefficients am and cn are defined as 1 2π
�
�
vo t
� �
ϕm cos nθ
�
(20)
The product of the two cosine functions in the second sum in (20) can be expanded as cos mθ
� �
ϕm cos nθ
���
�
� � � � 0� � � � �� �
1 cos m 2 1 cos m 2
nθ
ϕm
nθ
ϕm
(21)
The first term on the right hand side in equation (21) can further be transformed as
� � � � ���
1 cos m 2
nθ
ϕm
�
� � � � ���
� � �� � � �� � � �� � � ��
1 cos ϕm cos m n θ 2 1 sin ϕm sin m n θ 2
Finally, we can transform the modulation function from (26) into the form yθ (29) ∑ bk cos kθ γk
��� � � � � � � � �=< � � &� ' k 135
(22)
where bk and γk are calculated as
1 cos m 2
nθ
ϕm
�
� � � � �� � � � �
1 cos m n θ 2 1 sgn m 2
ϕm
and
1 cos ϕm cos m n θ 2 1 sin ϕm sin m n θ 2
� �
Taking care of the polarity of term m into a more generic form
(23)
�� �� �� ��
n sin ϕm sin m
(24)
� �
��� � ∑� � � �� � � � � �2� ∑ 1 �� �� �� �� � � � � � � � � �/�3 � � � � � � � ��� � ∑� � � �54 6� � 8� 7 m 24 n 13
cos ϕm cos m n θ sin ϕm sin m sgn m n sin ϕm sin m n θ
pk sin kθ
(25)
(26)
k 135
From (25), the coefficients pk and qk are found to be pk
�
�� ∑�� �� �� � 9� �� ∑�� �� �� � : ; :�
m 24 n 13 m n k
m 24 n 13 m n k
and qk
1 am hm cn sin ϕm 2
�
1 am hm cn sgn m 2
� �
� � � ∑� � � �9 �� � � �� ∑� � � � �� : ; :� a0 ck
m 24 n 13 m n k
m 24 n 13 m n k
1 am hm cn cos ϕm 2
1 am hm cn cos ϕm 2
cos ωc
kωm t
γk
" � 1 30�
"
SB Ik dB
(32)
20log
& � �' 2 bk
"�
(33)
(27)
b1 bk
(34)
"
From equations (9),(10),(11),(15),(16),(27),(28) and (30), the values of the coefficients bk can be numerically calculated, if the ratio ωm ωt is known. A suitable program has been written in M ATH EMATICA to perform the calculation of these coefficients and the corresponding values of SB Ik as a function of ωm ωt . In (27) and (28), we can notice that the indices m and n can take an infinite number of values for a given k, such that m n k. Therefore, in these sums m and n should be swept to infinity. However, the values of am , hm and cn rapidly drop with the increase of m and n, so the calculations have been performed by sweeping the indices up to m 100 and n 99. This range of values is entirely sufficient for the good accuracy, and M ATHEMATICA performs this operation in a matter of seconds.
�
�
& �� �� '
20log
Clearly, the SB I ratio gives a less optimistic picture of the intermodulation distortion in the EER-based transmitter, for at least 3 dB lower than C I, but a more realistic one, since information is contained in the sideband product and not in the carrier (which is in this case supressed).
"
n sin ϕm
γk
" � 1 36�
nθ
qk cos kθ
kωm t
However, in our opinion, it would be more interesting to define an alternative measure, a sideband-to-intermodulation ratio, which is for the k-th order IM product defined as
Since m takes only even values, and n only the odd ones, the modulating function y θ can be written as yθ
bk cos ωc 2
C I dB
nθ
(31)
In further considerations, we will be interested only in the amplitude of the IMD products, and not in the phase. The amplitude of the desired sideband components is b1 2, while the amplitude of the k-th order IMD products is bk 2. In [1], the author used the carrier-to-intermodulation ratio C I to characterize the IMD behavior. This ratio, defined with respect to an unmodulated carrier (amplitude of unity), is given by
a0 cn cos nθ
1 cos ϕm cos m 2
pk qk
��� � ∑� � � 4 > � � � ? � > � � � ?7 " "
n 13
am hm cn
(30)
arctan
k 13
nθ
nθ
q2k
taking care to chose the right quadrant for the solution. From (18) and (29), we can finally write the output signal in the form vo t
As we will see, this transformation facilitates the calculation of the IMD products. It allows us to derive a more compact expression for the IMD products, since the sign of the difference m n is eliminated from the sine function. By combining equations (19)(24), we can write yθ
γk
n , we can transform (23)
1 cos ϕm cos m 2
p2k
bk
Similarly, for the second term in (21) we will have
"
� � @� �
"
�
The equations derived here are of generic character and can be used for an arbitrary envelope filter function. It is sufficient to substitute the appropriate values of hm and ϕm in (27) and (28) and repeat the necessary calculations. (28)
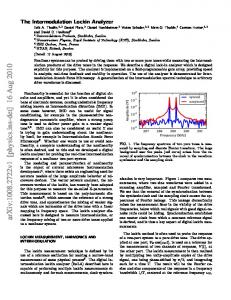
The results obtained for the one-pole lowpass function are shown in fig.4. The dominant IM products are, as expected, of the third and fifth order, and only they have been plotted, for clarity. At low values of the ratio ωm ωt , SB I3 and SB I5 have virtually the same values. A rapid drop in the SB I ratio can be noted as the frequency
"
""
"
of the modulating signal ωm approaches the corner frequency ωt of the lowpass network. Another point that is important to mention here is the Adjacent Channel Power Ratio (ACPR), which is a commonly used parameter to characterize the IMD of transmitters in modern communication systems. A very substantial and accurate conclusion on the ACPR that will result in an EER-based system cannot be made here, but SB I can be used as a useful indication of the expected ACPR performance. In [1], Raab mentions that the
"
the theoretical prediction for the ideal EER system in figure 4. This effect is due to suppression of the IMD products by the load network of the Class-E PA. In [4], an experimental approach was used to design Class-E with small DC-feeder inductance, in order to obtain a good ACPR. In this paper, we propose an analytic and more quantitative approach to this issue. L RFC E(t)
SB/I[dB] 80
L2
+
3 rd −order IMD 5 th −order IMD
60
C2
RA
Q
C1
Rload
vRFout (t)
40 20 0
0.5
1
1.5
ωm/ωt
A
Figure 5. The LR network in the Class-E PA
2
SB/I[dB]
Figure 4. The calculated SB/I response of the EER system
60
"
IMD for multitone signals is never larger than that of the two-tone signal. Therefore, intuitively we would say that SB I3 represents a worst-case prediction for ACPR1 for our EER system, based on perfect blocks (fig. 2) and one-pole low-pass function in the envelope path. In practice, however, the nonlinearity of the PA and other phenomena, such as differential delay between signals vx t and Eo θ , will also have a strong impact on the IMD and make ACPR worse. 3.
40 30 0.25 0.5 0.75 1 1.25 1.5 1.75
ωm/ωt
Figure 6. The simulated SB/I response of the EER system based on the Class-E PA
IMD IN THE CLASS-E-BASED EER
The Class-E power amplifier was introduced in 1975 by the two Sokals [2]. It has brought a unique valuable feature into the family of switching mode PAs, the so-called soft switching, which enabled spectacular efficiencies to be achieved, infeasible with other topologies. This type of circuit is particularly suitable for an RF implementation of the EER principle. In [3], a detailed in-depth study on the EER technique for the Class-E PA has been performed. It was shown that, even with the perfect supply modulation, the envelope distortion occurs and is caused internally, by the Class-E itself, mainly due to the effect of the output load network on the sideband components. Here we are focusing on the external mechanism of distortion, i.e. the influence of the RF choke in the Class-E circuit on the IMD products. A basic Class-E circuit is depicted in figure 5. The DCfeeding inductance LRFC is a constitutive part of the circuitry and RA denotes the resistance that the circuit presents to the supply source. For a constant envelope operation, LRFC is usually chosen large enough to be an open circuit for the RF signal and thus allows only the DC component to flow. Therefore, no special considerations on the choke inductance are necessary. When using the Class-E in an EER system, however, LRFC becomes an important design parameter: it is a part of the lowpass network. Therefore, for utilization of the Class-E PA in an EER transmitter system, a designer should be careful and choose the value of LRFC that will, in conjunction with RA of the circuit and a given bandwidth of the RF signal, provide a satisfying IMD response. The value of RA is basically dependent on the desired output power level for a given supply voltage, but also depends on whether the circuit is designed with RF choke or finite inductance DC-feeder. Also, the Class-E circuit elements change their nominal values when the circuit is to be designed with a small DC-feeder inductance. In figure 6, the simulated SB I response plot of the Class-E PA is shown. It is interesting that for a given ωm ωt , the SB I response is better than
"
"
"
3 rd −order IMD 5 th −order IMD
50
�
�
70
4.
CONCLUSIONS
New analytic relationships between the IM products in the EER technique and an arbitrary envelope filter transfer function have been derived. The IM products are calculated numerically and plots are given for the case of one-pole lowpass function. The presented equations are of generic character and can be used for any type of filter transfer function. An alternative measure, sideband-tointermodulation ratio, has been proposed that can be used for the initial prediction of the ACPR performance. Design guidelines for dimensioning LRFC in the Class-E PA are presented.
Acknowledgments The authors would like to thank the Dutch Technology Foundation STW for the financial support. 5. [1]
[2]
[3]
[4]
REFERENCES
F. H. Raab, “Intermodulation distortion in Kahn-technique transmitters”, IEEE Transactions on Microwave Theory and Techniques, vol. 44, no. 12, pp. 2273–2278, December 1996. N. O. Sokal and A. D. Sokal, “Class E-A new class of high efficiency tuned single-ended switching power amplifiers”, IEEE Journal of Solid-State Circuits, vol. 10, no. 3, pp. 168– 176, June 1975. M. Kazimierczuk, “Collector amplitude modulation of the class E tuned power amplifier ”, IEEE Transactions on Circuits and Systems, vol. 31, no. 6, pp. 543–549, June 1984. D. Milosevic, J. van der Tang and A. van Roermund, “On the feasibility of application of Class E RF power amplifiers in UMTS ”, Proceedings of the International Symposium on Circuits and Systems, vol. 1, pp. 149–152, 2003.