Aquatic Ecology 38: 191–207, 2004. © 2004 Kluwer Academic Publishers. Printed in the Netherlands.
191
Internal loading of nutrients and certain metals in the shallow eutrophic Lake Myvatn, Iceland Ingunn María Thorbergsdóttir1,2,* and Sigurdur Reynir Gíslason3 1
Department of Geology, University of Iceland, 101 Reykjavík, Iceland, and Myvatn Research Station, 660 Myvatn, Iceland; 2Current address: Landmælingar Íslands, Stillholti 16-18, 300 Akranes, Iceland; 3Science Institute, University of Iceland, 101 Reykjavík, Iceland; *Author for correspondence (e-mail:
[email protected])
Key words: Benthic chambers, Benthic primary production, Positive and negative feedbacks, Sediment–water interface, Solute fluxes
Abstract Sub-arctic Lake Myvatn is one of the most productive lakes in the Northern Hemisphere, despite an ice cover of 190 days per year. In situ, transparent and dark flux chambers were used for direct measurements of benthic fluxes of dissolved oxygen, nutrients, silica and certain metals, taking into account primary production and mineral precipitation. The range of benthic flux observed for dissolved oxygen 共DO兲, dissolved inorganic carbon 共DIC兲, ammonium, ortho-P, silica, calcium, and magnesium was –45.89 to 187.03, –99.32 to 50.96, –1.30 to 1.27, –0.51 to 0.39, –62.3 to 9.3, –33.82 to 16.83, and –23.93 to 7.52 mmol m ⫺ 2 d ⫺ 1, respectively 共negative value indicating flux towards the lake bottom兲. Low benthic NH⫹ 4 and ortho-P fluxes were likely related to benthic algal production, and aerobic bottom water. Ortho-P fluxes could also be controlled by the dissolution/precipitation of ferrihydrite, calcite, and perhaps hydroxyapatite. The negative silica fluxes were caused by diatom frustule synthesis. Benthic calcium and magnesium fluxes could be related to algal production and dissolution/ precipitation of calcium and/or Ca,Mg-carbonates. Fluxes of DO, DIC, pH and alkalinity were related to benthic biological processes. It is likely that some of the carbon precipitates as calcite at the high pH in the summer and dissolves at neutral pH in the winter. Mean of the ratio of gross benthic DIC consumption and gross benthic DO production was 0.94 ⫾ 0.18, consistent with algal production using NH⫹ 4 as N source. During the summer weeks the water column pH remains above 10. This high pH is caused by direct and indirect utilisation of CO2, HCO3⫺ , ° CO–2 3 , H4SiO4 and H3SiO4 by primary producers. This study shows that in shallow lakes at high latitudes, where summer days are long and the primary production is mostly by diatoms, the pH is forced to very high values. The high pH could lead to a positive feedback for the Si flux, but negative feedback for the NH⫹ 4 flux.
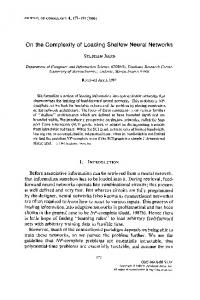
Introduction Lake Myvatn, a young and shallow lake at the flank of the active rift zone in north Iceland, is one of the most productive lakes in the Northern Hemisphere despite the fact that it lies just south of the Arctic Circle and has an ice cover for about 190 days per year 共Jónasson 1979兲. The area is in a rain shadow of the largest glacier outside the Arctic and Antarctic, the Vatnajökull Glacier, resulting in low precipitation and high solar radiation, and it is fed by nutrient-rich groundwater 共Figure 1兲 共Ólafsson 1979兲. As in many
shallow lakes, benthic diatoms and other benthic algae are important for primary production in Lake Myvatn 共Jónasson and Adalsteinsson 1979; Ólafsson 1979; Wetzel 2001兲. In terms of productivity, Lake Myvatn is eutrophic but the total dissolved nitrogen concentration in the lake is lower than the general 28–436 M range for eutrophic lakes 共Wetzel 2001兲. According to the mass balance of input and output of dissolved P and N and primary production measurements, only about 20% of P and 4% of N needed for production comes from groundwater inflow; the rest comes from the cycling of nutrients within the lake
192
Figure 1. Lake Myvatn and the stations used for direct measurements of benthic solute flux.
共Jónasson 1979; Jónasson and Adalsteinsson 1979; Ólafsson 1979兲 and from N-fixation in the case of nitrogen. The lake is fed on its eastern shore by high pH cold and warm springs 共Figure 1兲 with relatively high concentrations of phosphate, and silicate, and some nitrate, especially in the warm springs, resulting in inputs of P, N and Si amounting to 0.05 mol m–2 y–1, 0.14 mol m–2 y–1, and 12 mol m–2 y–1, respectively 共Ólafsson 1979, 1991a兲. Nitrogen is mostly in the form of nitrate from precipitation in the catchment area of the lake, which is to the south and east where extensive and highly permeable lava fields stretch towards the Vatnajökull Glacier into the almost desert interior 共Figure 1兲. There is no surface runoff because of the high primary permeability of the young lavas and the normal faults of the rift zone. The mean dissolved phosphate concentration of 1.62 ⫾ 0.43 M 共50 ⫾ 13 g l–1 of P兲 in groundwater entering Lake Myvatn 共Ólafsson 1979兲 is more than twice the world average lake concentration of 0.65 M 共20 g l–1 of P 兲 共Wetzel 2001兲. The high pH and phosphate concentrations of groundwater feeding the lake are due to the highly reactive basaltic bedrock, both glassy and crystalline, and the sparse vegetation in the catchment area 共Gíslason and Eugster 1987a, 1987b; Gíslason and Arnórsson 1993; Gíslason et al. 1996;
Frogner et al. 2001; Oelkers and Gíslason 2001; Stefánsson et al. 2001; Stefánsson and Gíslason 2001; Gíslason and Oelkers 2004兲. In up to 100 year of contact with the bedrock 共Sigbjarnarson et al. 1974; Árnason 1976; Ármannsson et al. 1998; Kjaran and Hólm 1999; Kristmannsdóttir et al. 1999兲 the groundwater takes up phosphate, silica and other chemical components. Thus, the groundwater, with its constant flow and temperature, acts as a stable source of dissolved constituents. The sediment–water interface plays a role in the recycling of nutrients. According to Ólafsson 共1979兲 total carbon, total phosphorus and total nitrogen sediment concentrations are highest in the topmost cm of the sediment, and then decrease with depth. Finally, near constant concentration of total carbon is reached below 60 cm, and of total-P and total-N below 30 cm. Ólafsson and Stefánsdóttir 共Ólafsson 1991b兲 showed that the concentrations of dissolved nutrients in the sediment pore water vary seasonally and spatially with depth. Rough calculations of molecular diffusion of some solutes from the sediment in the South Basin have been made using a sediment pore water profile 共Gíslason et al. 2004兲. Diffusional fluxes from the sediment beneath the bioturbated and irrigated zone 共uppermost 5 cm; oxygen-rich兲 of ortho-P, total-dissolved P, NH⫹ 4 , total dissolved Si, Ca, Mg-Al, and Fe were estimated to be 4.34 mmol m–2 y–1, 5.67 mmol m–2 y–1, 135 mmol m–2 y–1, and 44.7 mmol m–2 y–1, 24.0 mmol m–2 y–1, 20.2 mmol m–2 y–1, 0.07 mmol m–2 y–1, and 0.72 mmol m–2 y–1, respectively. Sediments in Lake Myvatn and other shallow eutrophic lakes play a major role in nutrient cycling; thus it is important to define the magnitude of solute fluxes and to determine the influences of organic and inorganic matter on these fluxes. The objective of this study was to measure and interpret the benthic fluxes of dissolved nutrients, silica and certain metals across the sediment-water interface in Lake Myvatn and to assess the effect of benthic algae and mineral precipitation on the flux of dissolved constituents. Towards this goal, in situ benthic flux chambers 共BFC兲 were used.
Materials and methods Study area and sampling sites Lake Myvatn is divided into the North Basin and the South Basin 共Figure 1兲. The mean depth of the lake
193 Table 1. GPS locations 共system WGS84兲 and characteristics of the three sampling sites used for direct measurement of solute fluxes across the sediment–water interface in Lake Myvatn. B. algae ⫽ Benthic algae; Phytop. ⫽ Phytoplankon; T. gracil. ⫽ Tanytarsus gracilentus; C. islandicus ⫽ Chironomus islandicus; Filam. g. algae ⫽ filamentous green algae. Station
Latitude Longitude Depth 共m兲 In winter Larvae B. algae Phytop.
HO
B2
95
65°34⬘49.74⬘⬘ 16°57⬘16.31⬘⬘ 1.7 Ice-free T. gracil. Diatoms ⫺ Barely seen
65°35⬘43.75⬘⬘ 16°57⬘15.71⬘⬘ 2.6 Ice-covered T. gracil. Diatoms Common
65°37⬘10.51⬘⬘ 17°00⬘49.28⬘⬘ 2.3 Ice-covered C. islandicus Filam. g. algae ⫹Diatoms Common
is about 2 m and its surface area is 37 km2. The lake was formed when a shallow depression was dammed by a lava flow ca. 2000 BP. This lava forms the floor of the South Basin. But the lake did not take on its present outline until A.D. 1729 when lava flowed into its northern part 共Thorarinsson 1979兲. Through the 2000 years of the lake’s evolution, sediment has accumulated on the former lava bottom in the South Basin and on terrestrial sediment in the North Basin at the maximum rate of 2.2 mm y ⫺ 1 giving rise to a mean sediment thickness of about 4 m 共Einarsson 1982; Einarsson and Haflidason 1988; Einarsson et al. 1993兲. The diatomaceous sediment is partly covered by macrophytes in the North Basin and by filamentous green algae 共Cladophorales兲 in the South Basin 共e.g., Jónasson 1979兲. General composition of the lake sediments 共% dry weight兲 is as follows: diatom frustules 55%, organic material 11%, sand and tephra 30% 共Líndal 1959兲. In the North Basin the sediment surface consists of almost pure diatoms and sand, whereas in the South Basin the substrate, especially in the western part, consists of filamentous green algae, with numerous microhabitats, diatoms and mud. In the eastern part the mud is covered with diatoms and a mat of chironomid larvae 共Jónasson 1979; Ingvason 2002; Ingvason et al., 2002; Ólafsson and Paterson 2004兲. Direct solute flux across the sediment surface water interface was measured at three sampling stations 共Figure 1兲. Each stationreflectsaspecificsedimentaryenvironment,benthic community and water depth 共Figure 1; Table 1兲. Benthic flux chambers A pair of benthic flux chambers from KC-Denmark was used for direct measurements of solute fluxes across the sediment–water interface 共Figure 2兲. The
Figure 2. Benthic flux chamber and applied equipment used for direct measurement of solute flux across the sediment-water interface in Lake Myvatn. Arrows at the eastern shore of the lake present the groundwater inflow.
chambers are described in detail in Thorbergsdóttir et al. 共2004兲. Briefly, they are constructed of Plexiglas 共one dark, the other transparent兲 and are rectangular in shape covering a sediment area of 900 cm2. The height of the chambers above the sediment surface varied from 20 to 40 cm depending on penetration depth. The chambers remained on the lake bottom during the daylight period and samples were taken from them three to five times a day depending on the length of the daylight period. The benthic flux rate normalized to the sediment surface area 共mmol m–2 h–1兲, was obtained by multiplying the slope of the regression line of the concentration time series 关共C共t兲 – Cc共t-⌬t兲兲/ ⌬t兲兴 with the measured incubated water volume 共V兲 divided by the sediment surface area in the flux chamber 共A兲. C共t兲 is
194 the solute concentration at time t 共Figures 3, 4 and 5兲, and Cc(t-⌬t) is the solute concentration in a previous sample corrected for any volume of water replaced during sampling. Positive flux reflected a release from the sediments to the water 共e.g., Aller 1994; Hulth 1995; Aller et al. 1996兲. Methods of paired light/dark flux chambers were used in this study to be able to collect data sets for daytime fluxes at the same time as night time fluxes. The total flux 共JT兲 of solute in mmol m–2 d–1 was calculated by the equation JT ⫽ JDL ⫹ JN共24 ⫺ L兲
共3兲
where 共JD兲 is the measured flux in the transparent chamber 共mmol m–2 h–1兲, 共JN兲 is the measured flux in the dark chamber 共mmol m–2 h–1兲, and L represents the hours of daylight 共see, e.g., Moss 2000兲. Sampling and analytical methods During the time of incubation sampling was done every 2 to 3 h from both of the chambers for analysis of dissolved oxygen 共DO; one 50-ml Winkler pyrex bottle兲, pH and alkalinity 共one air-tight 30-ml amber glass bottle兲, Ca, Fe, K, Mg, Na, S, Sitotal, Al, As, B, Ba, Cd, Co, Cr, Cu, Hg, Mn, Mo, Ni, Ptotal 共TDP兲, Pb, Sr, Ti, Zn 共one 100-ml polyethylene bottle兲, and dissolved nutrients: orthophosphate 共ortho-P; one 20ml polyethylene bottle兲; ammonium 共NH⫹ 4 ; one 20-ml polyethylene bottle兲; nitrate and nitrite 共NO–3⫹NO–2; one 20-ml polyethylene bottle兲; total dissolved nitrogen 共TDN兲; one 20-ml polyethylene bottle兲. All the bottles except the pH and dissolved oxygen were washed with acid and deionized water in the laboratory before sampling. Samples were taken through a 4-m long masterflex® sampling tube 共Figure 2兲, with an inner radius of 3 mm. The tube was connected to a battery-driven peristaltic pump and during each sampling a total of 1 to 1.3 litres were pumped out of the chamber 共the first 70 ml were discharged兲. The same amount of ambient water was allowed to enter the chamber in replacement through a on-way valve. The volume of incubated water in the chambers 共V兲 varied from about 20 to 35 litres. Thus at each sampling occasion the dilution factor in Eq. 2 was less than 7%. All sample bottles, total of 7 bottles, were rinsed 3 times with the sample before collection. All samples, except the one for DO, pH and alkalinity, were filtered through a 0.2 m cellulose acetate filter. The
ortho-P samples were acidified with 1.2 M HCl down to ca. pH 2, and NH⫹ 4 samples were acidified with 0.12 M HCl down to ca. 4 pH. The silica, TDP and dissolved major and trace element samples 共preserved in 100 ml polyethylene bottles兲 were acidified with 1 ml of concentrated nitric acid 共Suprapure® HNO3兲. For further description of the sampling procedure see Thorbergsdóttir et al. 共2004兲. Dissolved oxygen 共DO兲, pH, alkalinity and some of the silica samples were analysed in the laboratory a few hours after sampling. Concentration of DO was determined by standard Winkler titration 共Grasshoff 1983兲. Oxygen concentration tests showed that the difference between duplicate oxygen measurements was less than 2%. The pH was determined using glass electrodes relative to pH buffers 共Jeffrey 1989兲. The endpoint of the alkalinity titration was determined by differentiation of the amount of HCl added to the sample vs. pH, and total dissolved inorganic carbon 共DIC兲 was calculated from the pH, temperature, alkalinity, and dissolved constituents using the PHREEQC program 共Parkhurst and Appelo 2001兲. All nutrient samples, except silica and the acidified total dissolved phosphate samples, were kept frozen until analysed. Determination of nutrient concentration was performed in an autoanalyser 共colorimetry兲 共Skoog et al. 1990; Jeffrey 1989兲; each sample was analysed twice. Silica, total dissolved phosphate, and major and trace elements were analysed with ICPAES 共Inductively Coupled Plasma – Atomic Emission Spectroscopy兲, HR-ICP-MS 共High Resolution – Inductively Coupled Plasma – Mass Spectrometry兲 and atomic fluorescence at SGAB Analytica in Luleå in Sweden. Air and bottom water temperature 共°C兲 and light flux 共mol photons m–2 s–1兲 were measured on all sampling occasions just above the lake surface, at 0.5 m and 1 m depth, and at the bottom. Temperature and occasional oxygen profiles allowed evaluation of the mixing in the lake. Before retrieving the chambers 3 sediment cores, 5 cm in diameter and about 15 to 25 cm in length, were taken with a Kajak corer as described in Ingvason et al. 共2002兲 and Thorbergsdóttir et al. 共2004兲. Mineral saturation indices As dissolution and precipitation of minerals are known to affect the flux of some solutes 共for instance ortho-P兲 at the sediment-water interface in aquatic environments 共e.g., Scheffer 1998兲, it is important to
195 Table 2. Total flux 共JT; Equation 3兲 of DO, DIC, dissolved ammonium, ortho-P, silica, calcium and magnesium in Lake Myvatn from 2000– 2001. Fluxes are shown in mmol m–2 d–1. N.C. ⫽ not calculated Station
Date 共d-m兲
Water depth 共m兲
HO HO HO HO HO B2 B2 B2 B2 B2 95 95 95 95 95
15-Jun 24-Jul 20-Oct 17-Feb 27-May 16-Jun 26-Jul 21-Oct 15-Feb 24-May 20-Jun 1-Aug 22-Oct 14-Feb 29-May
1.7 1.7 1.7 1.7 1.7 2.6 2.6 2.6 2.6 2.5 2.3 2.3 2.3 2.3 2.3
DO 187.03 N.C. –45.89 N.C. 64.84 98.19 10.52 –4.43 0.13 10.30 54.28 102.66 –27.12 N.C. 68.37
DIC –36.23 N.C. 50.96 N.C. –67.63 –76.32 –89.61 –6.64 –99.32 5.08 –25.25 –28.11 –43.33 N.C. –63.82
evaluate the saturation state of the water close to the benthic sub-layer with respect to various minerals. The saturation state was evaluated with the aid of the PHREEQC speciation model 共Parkhurst and Appelo 2001兲. The calculations were carried out for all of the 117 samples collected in this benthic flux chamber study with respect to 296 minerals for each water sample.
Results and discussion Concentrations of DO and DIC, pH, and alkalinity varied with time and their trends differed between the transparent and dark benthic flux chambers. Changes in the nutrient concentrations with time were insignificant and did not follow the trends of DO and DIC 共Figures 3, 4 and 5兲. In most cases, the concentrations of Ca and Mg during the incubations decreased in the transparent chamber and increased in the dark chamber. The aluminium and iron concentrations were low and concentration changes with time difficult to detect 共Figures 3, 4 and 5兲. The calculated total fluxes of DO, DIC, NH⫹ 4 , ortho-P, Sitotal, Ca, and Mg according to Equation 3 are shown in Table 2. The range of benthic flux observed for dissolved oxygen 共DO兲, dissolved inorganic carbon 共DIC兲, ammonium, orthoP, silica, calcium, and magnesium was –45.89 to 187.03, –99.32 to 50.96, –1.30 to 1.27, –0.51 to 0.39, –62.3 to 9.3, –33.82 to 16.83, and –23.93 to 7.52 mmol m–2 d–1, respectively 共negative values indicating flux towards the lake bottom兲.
NH⫹ 4 –0.51 N.C. 0.28 N.C. –0.19 –0.34 –0.15 1.27 –1.30 0.56 –0.34 –0.04 0.27 N.C. 0.08
Ortho-P
Sitotal
Ca
Mg
–0.51 N.C. –0.14 N.C. –0.51 –0.16 0.34 0.24 –0.41 0.39 –0.01 –0.04 0.02 N.C. –0.02
–62.9 N.C. –8.4 N.C. –24.0 –20.9 –3.1 9.3 –23.8 –15.2 –15.2 –4.2 –33.9 N.C. –12.7
–6.06 N.C. 4.53 N.C. –7.02 –3.64 –8.84 16.83 –33.82 2.47 –14.66 –4.43 –12.67 N.C. –2.28
–4.15 N.C. 0.74 N.C. –6.22 –1.82 –7.51 7.52 –23.93 0.96 –10.77 –0.22 –13.11 –2.17
Dissolved oxygen, total dissolved inorganic carbon (DIC) and pH DO concentration increased in the transparent chamber and decreased in the dark chamber 共Figures 3, 4 and 5兲. During the summer there was a net benthic DO production in the lake but a net benthic DO consumption during the winter 共Figures 3, 4 and 5, Table 2兲. The DIC results were the reverse of those of DO. DIC concentration decreased in the transparent chamber but increased in the dark chamber 共Figures 3, 4 and 5兲. During the incubations pH rose in the transparent chamber but decreased in the dark chamber. The magnitude of the pH change with time in both chambers varied with the season. Alkalinity behaved opposite to pH and DO but in the same manner as the DIC; decreased in the transparent chamber but increased in the dark chamber 共Figures 3, 4 and 5兲. The consistency of the slopes and intercepts of the DO, DIC, pH and alkalinity reveals that 25 out of 30 chamber deployments and sampling were successful 共Figures 3, 4 and 5兲. Because of heavy wind and ice melting at station HO, and stratification of dissolved oxygen 共DO兲 in station 95, the February sampling was difficult at these two stations 共Figures 3 and 5兲. Further, the DO changes in the dark chamber in station HO on the 24th of July imply a deployment failure and are therefore not included in the annual calculated fluxes. Changes of DO, DIC, pH and alkalinity with time in the benthic flux chambers were due to benthic photosynthesis, respiration and decomposition of or-
196 ganic matter. The relationship between the changes in the concentrations of DO and DIC, was derived using the calculated gross DO production and gross DIC consumption rate data 共Table 3兲. The dark chamber flux results 共JN; Equation 3兲 over a 24-h period were subtracted from the total flux of the solute 共JT; Equation 3兲 according to Equation 4, Jgross ⫽ 共JT兲 ⫺ 共JN · 24兲
共4兲
It was assumed that diffusive flux of DIC from the sediments to the bulk water and precipitation and dissolution of Ca,Mg–carbonates did not significantly affect the mass balance. The mean ratio of gross DIC consumption and gross DO production was 0.94 ⫾ 0.18 共Table 3; see also Figure 6兲. The relative magnitude of DO and DIC changes suggests a photosynthetic quotient 共molar ratio of oxygen evolved per amount of carbon fixed兲 of ca. 1, which is consistent with benthic algal production using NH⫹ 4 as an N source where the CO2:O2 ratio is 106:107 共e.g., Williams and Robertson 1991; Stumm and Morgan 1996; Jahnke et al. 2000兲. If this ratio is used in all subsequent DO based estimates of benthic primary production 共BPP兲, rather than the ratio of CO2:O2 of 106:138 representative of NO–3 as an N source 共procedure described in Thorbergsdóttir et al. 2004兲, the gross annual BPP was 540 g C m–2 y–1 at station HO, 320 g C m–2 y–1 at station B2, and 440 g C m–2 y–1 at station 95. Using the net DO production in the transparent chamber as a measure of the net daily BPP we could use the 106:107 Redfield molar ratio of CO2:O2 to calculate the net annual BPP. The net annual BPPs at the three stations were: station, HO 160 g C m–2 y–1, station B2, 110 g C m–2 y–1, and station 95, 200 g C m–2 y–1. Thus at station HO the net annual BPP was only 30% of the gross production, at station B2 it was 35%, and at station 95 it was 45% of the gross annual BPP. Net as well as gross BPP decreased from mid-June to late October at the two stations where Tanytarsus gracilentus and diatoms 共mostly Fragilaria兲 dominated the sediment surface. The net annual BPP amounts to up to 50% lower than the net annual diatom production of 220 g C m–2 y–1 in the whole lake estimated from silica output through the outlet in 1973–1974 共Ólafsson 1979兲 and the inter-site variability in estimated BPP is also of the order of 50%. Thus, estimated net BPP agrees rather well with the
budget calculations of Ólafsson, given the uncertainties associated with this method. It seems that the shallowest station 共HO兲 had the highest gross BPP, but net BPP production was highest at station 95 in Neslandavík Bay 共Figure 1 and Tables 1 and 3兲. The deepest station, station B2, had the lowest gross and net BPP of the three stations. Research on the major components 共such as live and dead algae, algal fragments, detritus, and mineral fragments兲, apart from larvae, found at the sediment surface at station B2 showed that the diatoms were 60% of the volume during the spring and decreased gradually during the summer to 30% in October 共Ingvason 2002; Ingvason et al. 2002兲. This tendency of seasonal changes in BPP at station B2 was also found in the net daily BPP calculations derived from the linear regression of the transparent chamber DO concentration time series 共Table 3兲. Through photosynthesis algae assimilate CO2, and inorganic nutrients for growth and release O2, while decomposition of algal biomass releases nutrients and CO2. During algal NH⫹ 4 assimilation as an N source and decomposition, the following stoichiometry is valid for the bottom of Lake Myvatn 共Figure 6兲: 2⫺ 106CO2 ⫹ 16NH⫹ 4 ⫹ HPO4 ⫹ 108H2O F C106H263O110N16P ⫹ 107O2 ⫹ 14H⫹ 共5兲
共e.g., Stumm and Morgan 1996兲, resulting in release of O2 and protons. In other words, pH should decrease with increased primary production, contrary to what is shown in Figures 3, 4 and 5. Both in marine and freshwater environments algae are known to assimilate bicarbonate 共HCO–3兲 for their growth, either by direct uptake or by extracellular catalytic conversion of HCO–3 to CO2 in the presence of carbonic anhydrase 共CA兲, with CO2 entering the cell 共e.g., Badger et al. 1998; Mercado et al. 1998; Sültemeyer 1998; Huertas et al. 2000; Wetzel 2001兲. Among the algae, diatoms are known to assimilate bicarbonate under decreasing CO2 concentration 共Burkhardt et al. 2001兲, according to the the stoichiometric equation ⫹ 2⫺ 106HCO⫺ 3 ⫹ 16NH4 ⫹ HPO4 ⫹ 2H2O ⫹ ⫹ 92H F C106H263O110N16P ⫹ 107O2
共6兲
which is more in accordance with the DO, DIC and pH time series presented in Figures 3, 4 and 5. Equation 6 can be presented in terms of NO–3, resulting in
Date 共d-m兲
15-Jun 24-Jul 20-Oct 17-Feb 27-May 16-Jun 26-Jul 21-Oct 15-Feb 24-May 20-Jun 1-Aug 22-Oct 14-Feb 29-May
Station
HO HO HO HO HO B2 B2 B2 B2 B2 95 95 95 95 95
1.7 1.7 1.7 1.7 1.7 2.6 2.6 2.6 2.6 2.5 2.3 2.3 2.3 2.3 2.3
Water depth 共m兲
299 N.D. 34 N.D. 140 183 155 26 28 113 179 234 28 N.D. 180
–311 N.D. –35 –68 –173 –172 –171 –19 N.D. –100 –278 –226 –17 –138 –153
Gross DO Gross production DIC assimilation 共mmol m–2 d–1兲 –1.04 N.D. –1.03 N.D. –1.24 –0.94 –1.10 –0.75 N.D. –0.88 –1.55 –0.97 –0.60 N.D. –0.85
DIC/DO
3557 N.D. 404 N.D. 1663 2173 1845 306 328 1349 2128 2784 338 N.D. 2142
Gross BPPDO 共mg C m–2 d–1兲 Ortho-P
Si
–44.7 N.C. –5.1 N.C. –20.9 –27.3 –23.2 –3.8 –4.1 –17.0 –26.8 –35.0 –4.2 N.C. –26.9
–2.80 N.C. –0.32 N.C. –1.31 –1.71 –1.45 –0.24 –0.26 –1.06 –1.69 –2.21 –0.27 N.C. –1.70
–237 N.C. –27 N.C. –111 –145 –123 –20 –22 –90 –142 –186 –23 N.C. –143
Gross assimilation 共mmol m–2 d–1兲
NH⫹ 4
190 63 5 N.D. 76 100 41 15 18 26 56 131 8 N.D. 85
Net DO production 共mmol m–2 d–1兲 2258 754 56 N.D. 906 1194 493 175 219 308 670 1555 96 N.D. 1014
Net BPPDO 共mg C m–2 d–1兲 Ortho-P
Si
–28.4 –9.5 –0.7 N.C. –11.4 –15.0 –6.2 –2.2 –2.8 –3.9 –8.4 –19.6 –1.2 N.C. –12.8
–1.78 –0.59 –0.04 N.C. –0.71 –0.94 –0.39 –0.14 –0.17 –0.24 –0.53 –1.22 –0.08 N.C. –0.80
–151 –50 –4 N.C. –61 –80 –33 –12 –15 –21 –45 –104 –6 N.C. –68
Net assimilation 共mmol m–2 d–1兲
NH⫹ 4
Table 3. Gross and net DO production, gross DIC consumption due to benthic primary production in Lake Myvatn, and the calculated gross and net nutrient assimilation needed for the benthic primary production 共implied by the gross and net DO production兲 assuming Redfield molar ratio of O2:C:N:P of 107:106:16:1 and Si:C ratio of 85:106 共Sick-Goad et al., 1984兲. N.D. ⫽ not detected; N.C. ⫽ not calculated.
197
198
Figure 3. Light 共open symbols兲 and dark 共closed symbols兲 benthic flux chamber results of DO, DIC, pH, alkalinity, orthophosphate, total phosphate, nitrate⫹nitrite, ammonium, total nitrogen, total silica, calcium, magnesium, aluminum and total iron at station HO for the indicated dates.
the consumption of 122 protons. At pH values exceeding 9, even more protons are consumed, since the concentration of the carbonate species is significant at pH values higher than 9. The pH values in Lake Myvatn exceed 10 for weeks in the summertime 共Ólafsson 1979; Eiríksdóttir et al. 2004; this study兲. Furthermore, at this high pH the fixation of silica in the diatom frustules will force the pH even higher, as shown by Equation 7
1984兲. Thus at a pH of 9.83 at 25 °C, primary production of one mole of diatom results in the minimum consumption of 92 plus half of 85 protons or a total of 125 protons 共Equations 6 and 7兲, assuming that diatoms consume primarily NH⫹ 4 and the uncharged monomeric silica species, forcing reaction 7 to the left.
⫹ 85H4SiO°4 ⫽ 85H3SiO⫺ 4 ⫹ 85H
The high BPP in Lake Myvatn during this study must be sustained by a high supply of nutrients. However, low nutrient assimilation was observed in the two chamber concentration time series 共Figures 3, 4 and 5; Tables 2 and 3兲. The variations in DO and DIC concentrations during the incubation periods were of the order 100 to 250 mol kg–1 in June and July 2000, and May 2001 共Figures 3, 4 and 5兲. The DIC
共7兲
When the pH is equal to the pK of reaction 共7兲, 9.83 at 25 °C 共Stumm and Morgan 1996兲, there is an equal activity of the H4SiO°4 and H3SiO–4 species. The stoichiometry of Equation 7 is written according to the diatom C:Si ratio of 106:85 共Sicko-Goad et al.
Dissolved nutrients and metals
199
Figure 4. Light 共open symbols兲 and dark 共closed symbols兲 benthic flux chamber results of DO, DIC, pH, alkalinity, orthophosphate, total phosphate, nitrate⫹nitrite, ammonium, total nitrogen, total silica, calcium, magnesium, aluminum and total iron at station B2 for the indicated dates.
variations during the incubation periods in October and February 2001 were uncertain. According to the Redfield ratios, a change in DIC of the order 100 to 250 mol kg–1 should result in a variation of 0.9 to 2.3 mol kg–1 for P, and 15 to 38 mol kg–1 for N, provided that, the primary source and sink of N and P was bulk lake water and benthic algae, as the data for DIC and DO suggests for June, July and May. As shown in Figures 3, 4 and 5, this is not the case. The time variations are much less than predicted from the DIC and Redfield ratios, and they are uncertain. This could be due to: 1兲 sampling problems; 2兲 analytical problems; 3兲 additional source/sink terms in the mass balance for the benthic flux chambers. All the nutrient samples were filtered through 0.2-m cellulose acetate filters into acid-washed polyethylene bottles. Soon after filtration the NH⫹ 4 sample was acidified to pH 4, ortho-P sample acidi-
fied to pH 2, and Ptotal and Sitotal acidified to the pH of 1. All nutrient samples except the Ptotal and Sitotal samples were freezed immediately after sampling and kept frozen until analysed. By acidifying the samples, precipitation of Fe phases upon storage and degassing of ammonium in the sample bottles were prevented. However, it is possible that both HPO24 from bulk lake water and sediment water were sequestered by Fe minerals and that NH⫹ 4 was degassed during the high pH period in the plexiglas chambers, prior to sampling 共Figure 2兲. The nutrient, silica, and metal concentration range 共Figures 3, 4 and 5兲 and detection limits are shown in Table 4. In some cases for NO–3 and in rare cases for NH⫹ 4 , the concentrations are close to the detection limits 共Table 4兲. The bulk of the data in Figures 3, 4 and 5 is well above the detection limits 共Table 4兲. The analytical results are internally consistent; the total
200
Figure 5. Light 共open symbols兲 and dark 共closed symbols兲 benthic flux chamber results of DO, DIC, pH, alkalinity, orthophosphate, total phosphate, nitrate⫹nitrite, ammonium, total nitrogen, total silica, calcium, magnesium, aluminum and total iron at station 95 for the indicated dates.
Figure 6. Example of DO and DIC results from an in situ, transparent 共open circles兲 and dark 共closed circles兲 paired benthic flux chamber incubation at station B2 共16 June 2000兲. Near 1:1 correspondence between the calculated gross DO production and DIC consumption, suggesting benthic primary production according to Equation 5.
concentrations of P and N being higher than those of individual species, and the bulk of the dissolved N is in organic form in the summer. In summary, it is un-
likely that the limited variation in N, P, and Si in Figures 3, 4, and 5, and small measured fluxes compared to the predicted ones 共Tables 2 and 3兲 stem from
201 Table 4. Dissolved nutrient, silica, and metal concentration range and detection limits. Values are in M.
High Low Det. lim.
Ortho-P
P total
NO–3
NH⫹ 4
N
3.7 0.11 0.06
4.18 0.54 0.2
1.7 ⬍ 0.1 0.1
40 0.2 0.1
15 1.7 0.2
total*
Si
total
406 74 1
Al
Fe
3.26 0.096 0.003
3.38 0.04 0.007
total
Ca
Mg
262 138 2.5
217 124 3.75
*Not measured all the time.
Figure 7. Relationship between total dissolved phosphorus 共TDP兲 and total dissolved nitrogen 共TDN兲 concentration at station HO, B2, and 95 共Figure 1兲 and in the outflow water at Geirastadaskurdur and Laxá 共Figure 1 and Eiríksdóttir et al. 2004兲. The line presents the N:P Redfield molar ratio of 16:1 and the arrows show the changes of the N:P ratio in the inflow groundwater as it passes through the lake towards the outflow.
sampling and analytical artefacts. They must be due to additional nutrient source and sinks within the chambers as described in detail below. Despite low concentration change and fluxes some pattern can be seen in the nutrient flux results 共Table 2兲. NH⫹ 4 and ortho-P generally showed a slight negative flux, though in October the NH⫹ 4 had a positive flux at all three stations and ortho-P at two out of the three. Negative flux means a loss from the water towards the bottom sub-layer. In late May there was also a slight flux of NH⫹ 4 from the sediment at two stations. In most cases a positive flux of ortho-P was related to station B2, which was the deepest. The N:P ratio in the groundwater inflow to Lake Myvatn 共Figure 1兲 is lower than the N:P Redfield ratio of 16:1 共Equations 5 and 6兲 共Ólafsson 1979, 1991a; Arnórsson et al. 1999兲. Thus, the limiting nutrient in Lake Myvatn for the benthic primary
producers has been suggested to be nitrogen but phosphorus is thought to be the limiting nutrient for the nitrogen fixing cyanobacteria Anabaena flosaquae 共Lyngb.兲 Bréb. 共e.g., Jónasson and Adalsteinsson 1979; Ólafsson 1979兲. During this study, the lake water seemed to be deficient in N, relative to P 共Figure 7兲. There was no Anabaena bloom during this study. In the outflow the N:P molar ratio was near the Redfield ratio of 16:1 共Figures 1 and 5; Eiríksdóttir et al. 2004兲. There was a spatial evolution of the lake water from the springfed areas 共station HO兲 as it flowed thorough the lake basin towards the outflow Geirastadaskurdur and Laxá 共Figure 1; shown by arrows in Figure 7兲. The lake water gained dissolved N but lost dissolved P from the inflow towards the outflow. Nitrate was the highest of the dissolved inorganic N 共DIN兲 in the lake in the spring-fed area 共station HO兲 and was reduced
202 markedly by phytoplankton, benthic primary producers and bacteria, as it passed through the lake basin, and was commonly below the detection limit at station 95. In the outlet, Geirastadaskurdur, the nitrate concentration was below the detection limit in May, and again from the beginning of August throughout October in 2000 共Eiríksdóttir et al. 2004兲. The ammonium concentration did not show much spatial variation but seasonal variations were conspicuous. The summer values were only about 2% of the concentration observed during ice cover 共Figures 3, 4, and 5 and Eiríksdóttir et al. 2004兲. Thus, to support the high primary production rates of algae in Lake Myvatn, inputs of N from internal recycling and nitrogen fixation are imperative. To sustain the extensive BPP in the lake the NH⫹ 4 supply from the sediment pore water must be of importance as the benthic primary producers were using ⫹ NH⫹ 4 as an N source 共C/O ratio in Table 3兲. The NH4 concentration in the sediment pore water is high, over 1000 M 共14 mg l–1兲, and the diffusive flux is significant 共Gíslason et al. 2004兲. The NH⫹ 4 assimilation by benthic primary producers could then explain the insignificant flux of ammonium from the sediment into the bottom water in the transparent chamber. In the dark chamber, the NH⫹ 4 flux might have been reduced because of the effects of the previous illumination period before the dark chamber deployment. This illumination period may lead to a continued NH⫹ 4 demand by the sediment in the dark that may last several hours 共Thornton et al. 1999兲, resulting in a flux of NH⫹ 4 from the overlying water into the sediment surface. There is also the possibility of NH⫹ 4 consumption by algae in the dark 共Priscu 1984兲, thus preventing an NH⫹ 4 flux from the sediment in the dark. The illumination effects on the sediment NH⫹ 4 flux in Lake Myvatn are likely to vary with the seasons, as there is almost 24 h daylight in late June but only about 3 h daylight in late December during the ice-cover period. As the summer nights are short in Iceland there is a possible reduction of night time NH⫹ 4 flux from the sediment into the water. As the pH in some areas of Lake Myvatn exceeds 10 during midsummer 共Ólafsson 1979; this study兲, the possibility of volatilisation of ammonium 共NH⫹ 4 兲 to ammonia gas 共NH3兲 in the lake water must be considered. Note that the average pH of the interstitial water in the sediment is around 7.25 at 22 ˚C 共Gíslason et al. 2004兲. At high pH values, NH3 gas can be formed by the deprotonation of NH⫹ 4 . When the pH in a water body reaches the pK of the dissociation re-
action, 9.2 at 25 °C, there is an equal amount of NH⫹ 4 and NH3共aq兲 dissolved in the water 共Stumm and Morgan 1996兲. During high pH conditions in the lake during midsummer, volatilisation of NH3共aq兲 might be competing with the benthic algae assimilation of NH⫹ 4 , and might even lead to a reduced BPP. As discussed earlier 共Equations 5, 6 and 7兲, the pH increases due to primary production in the lake, resulting in ‘a negative feedback’ of NH⫹ 4 availability when volatilisation of ammonium is excessive. Despite the high phosphate concentrations of the sediment pore water, 50 to 90 M 共1.5–2.8 mg l–1 of P兲 共Ólafsson 1991b; Gíslason et al. 2004兲 the benthic orthoP flux was not significant during aerobic conditions at the sediment-water interface and total dissolved phosphate 共TDP兲 decreased from the inflow in the lake to the outflow 共Figure 7兲. The benthic flux of ortho-P and TDP was negative in most cases, from the lake water towards the sediment surface 共Table 2兲. Phosphate is, commonly, highly adsorbed on iron hydroxide when the benthic surface layer is aerobic, and at a high pH phosphate can precipitate as hydroxyapatite 共Ca5共PO4兲3OH兲. Also, aluminium, calcite 共CaCO3兲, and some clay minerals can play a role in immobilizing phosphorus in lakes 共e.g., Scheffer 1998; Wetzel 2001兲. In Lake Myvatn ferryhydrite 共Fe共OH兲3兲, calcite and perhaps hydroxyapatite, of various crystalinity and composition could constrain the phosphate flux from the sediments since the benthic waters were often highly supersaturated with respect to these phases 共Figure 8兲 and the total dissolved concentration of Ca, Mg, Fe and P is low 共Figures 3, 4 and 5兲 compared to their high concentration at the lower pH 共7.26兲 of the interstitial water at 25 cm depth in the sediment 共526, 440, 10.6, and 83.0 M, respectively; Gíslason et al. 2004兲. Due to low aluminium concentration in the pore waters, 0.020 M 共Gíslason et al. 2004兲, and in the benthic lake water 共Figures 3, 4 and 5兲, it was unlikely that precipitation of clay minerals was significant. Diffusion of phosphate might be reduced because of phosphate immobilisation by iron precipitating 共Figure 8c兲 at a pH lower than ca. 9.5. At higher pH values, commonly occurring during the summer 共Ólafsson 1979; this study; Eiríksdóttir 2004兲, precipitation of calcite and perhaps hydroxyapatite in the lake can lead to a decrease in P release from the sediment and the benthic communities 共Figure 8兲. Together with the possible precipitation of these three minerals, assimilation of ortho-P from the sediment pore water by benthic algae was likely the cause of low phosphate
203
Figure 8. The pH dependence of the saturation state of hydroxyapatite 共a兲, calcite 共b兲, ferryhydrite 共c兲 and relationship of DO concentration and total iron concentration at stations HO 共dark symbols兲, B2 共open symbols兲 and 95 共triangles兲 at Lake Myvatn 共d兲. Grey line ⫽ Equilibrium 共Log共Q/K兲 ⫽ 0兲.
fluxes between the lake water and the lake bottom. Furthermore, midge larvae, especially at stations HO and B2, are likely to reduce anaerobic P release because of enhanced aeration of the top sediment by bioturbation 共mixing兲 and constant irrigation 共water pumping兲. In the winter, during ice cover, the DO concentration decreased at the sediment–water interface 共Figures 3, 4 and 5; Thorbergsdóttir et al. 2004兲 but the concentration of dissolved H⫹, Fe, Ptotal, ortho-P, DIC, Ca and Mg were at maximum 共Figures 3, 4 and 5兲. This was probably due to minimum primary production, reduced capacity of iron to bind P due to the dissolution of ferrihydrite during low DO concentration, dissolution of calcium and/or Ca, Mgcarbonates and perhaps hydroxyapatite at neutral pH 共Figures 3, 4, 5 and 8兲. Ca and Mg are usually required as micronutrients in growth of aquatic flora and fauna 共Wetzel 2001兲. Thus, the changes of Ca and Mg with time in the benthic flux chamber incubations 共Figures 3, 4 and 5兲 could be related to benthic algal primary production as well as dissolution/precipitation of calcium and/or Ca, Mg-carbonates 共Figure 8兲.
Total dissolved silica Freshwater diatoms use silica for their frustule synthesis in the C:Si molar ratio of 106:85 共Sicko-Goad et al. 1984兲. Commonly, total dissolved silica concentration in the water column reaches about 400 M 共11.2 mg l–1 of Si兲 during the winter but is around 70 to 100 M 共1.97 to 2.81 mg l–1 of Si兲 in June and July 共Ólafsson 1979; Eiríksdóttir et al. 2004兲. The silica concentration near the sediment bottom in this study was generally high, from about 80 M 共2.25 mg l–1 of Si兲 to about 400 M 共11.2 mg l–1 of Si兲, lowest during the summer but highest in the winter 共Figures 3, 4 and 5兲. The silica concentration of the interstitial sediment water was close to 700 M 共Gíslason et al. 2004兲. The total dissolved silica concentration time-series in most cases had a negative slope and similarly the total dissolved silica fluxes had a negative value ranging from –62.9 to 9.3 mmol m–2 d–1 共Table 2兲. The measured total dissolved silica fluxes from the water to the bottom sediment 共Table 2兲 were considerably lower than predicted 共Table 3兲 from the corresponding measured oxygen and carbon fluxes, and the carbon to silica ratio 共106:85兲 of Sicko-Goad et al.
204
Figure 9. Solubility of amorphous silica, moganite, chalcedony, and quartz, expressed in units of mol l–1 at 25°C and 1 bar versus pH. The dots express total dissolved silica samples from Lake Myvatn, diamonds with crosses are samples from the dark chamber, open circles from the transparent chamber, and the squares represent the reference samples collected prior to deployment of the chambers.
共1984兲. This could be caused by the presence of phytobenthos other than diatoms, diffusion of silica from the interstitial water within the sediments up to the sediment-water interface, simple dissolution of old diatom frustules at the sediment surface, and/or relatively low C:Si ratio of the diatoms in the lake. If phytobenthos other than diatoms dominate the benthic algal flora at the sampling sites low silica uptake would be expected. Since at stations HO and B2 diatoms dominate the benthic flora 共Ingvason et al. 2002; Thorbergsdóttir et al. 2004兲 a higher silica flux towards the sediment would be expected 共Table 2兲 if the silica in the water column were the major silica source for the diatom frustule synthesis. At station 95, on the other hand, the filamentous green algae, as well as benthic diatoms, played an important role for the benthic community and the BPP 共Thorbergsdóttir et al. 2004兲. At this stage the relative importance of the filamentous green algae and diatoms in the BPP is not clear because we calculated the BPP irrespective of the algal species. The 44.7 mmol m–2 y–1 共1.25 g m–2 y–1 of Si兲 molecular diffusion of the dissolved monomeric uncharged silica from the interstitial sediment water reported by Gíslason et al. 共2004兲 was not significant as a major silica source. Another silica source might be the dissolution of diatom frustules. The dissolution
rate of amorphous silica increases with increasing pH under alkaline conditions 共Van Capellen and Qui 1997兲. The increase is dependent on the concentration of alkali metals in the reacting solution. The higher the concentration the greater is the dissolution increase with increasing pH 共Dove and Elston 1992; Dove and Riimstidt 1994兲. The pH varied from 7 to over 10 causing a ten-fold variation in the dissolution rate of amorphous silica in Lake Myvatn, at the alkali metal concentration of the waters. The total dissolved silica concentration in Lake Myvatn is high enough to affect the dissolution rate of amorphous silica 共diatom frustules兲, if the amorphous silica dissolution rate is affected by the saturation state in a similar way as that of quartz at close to saturation 共Berger et al. 1994兲 共Figure 9兲. The silica undersaturation with respect to amorphous silica in the lake 共Figure 9兲 translates to 4 to –9 kJ mol–1, corresponding to about 50% variation in the dissolution rate of amorphous silica. At low undersaturation, the dissolution rate follows a linear rate law but it switches to an exponential one at higher undersaturation 共Van Cappellen and Qui 1997a, b; Dixit and Van Cappellen 1999兲. The silica undersaturation in Lake Myvatn is highest at the highest pH and lowest silica concentration 共Figure 9兲 when primary production of the diatoms is highest, resulting in ‘a positive feedback’. The changes in the
205 undersaturation and pH result in an enhancement of more than an order of magnitude for the dissolution rate of the diatom frustules, but the frustules are the major part of the sediment. At times during the summer the total dissolved silica concentration decreased slightly in both chambers and decreased even more in the dark chamber than in the transparent one. This might imply that diatoms are able to store enough energy for the night time, thus enabling them to take up silica for their frustule synthesis. Variation in pH and negative- and positive feedbacks In shallow freshwater lakes like Lake Myvatn where the primary production is mostly due to diatoms, the pH reaches higher values than if the production is mainly by algae that do not fix silica 共Equations 6 and 7兲, especially during sunny and calm days in midsummer when the days are longest. Wind will enhance CO2 exchange at the air-water interface, resulting in a new proton source and decreasing the pH increase caused by the primary production. Furthermore, wind-induced surface agitation will scatter the solar radiation. Thus shallow lakes at high latitudes are more prone to this effect than lakes at low latitudes where the summer days are shorter. This study suggests that internal loading drives the major part of the present benthic primary production by supplying NH⫹ 4 . At high pH conditions in the lake, ‘negative feedback’ of NH⫹ 4 availability may occur when volatilisation of ammonium is excessive, limiting BPP. Thus, pH conditions from winter until midsummer and the autumn favour BPP, whereas the high pH midsummer conditions might result in a lower availability of NH⫹ 4 . The high pH conditions in this shallow eutrophic lake provide the potential for diatom frustule dissolution, adding to the silica budget of the lake during the midsummer and giving rise to recycling of silica at the sediment surface, thus resulting in a ‘positive feedback’ of silica availability. For ortho-P this study suggests that inorganic processes immobilise ortho-P at pH 7 and higher. Furthermore at a high pH, in shallow eutrophic lakes such as Lake Myvatn, when ferryhydrite becomes undersaturated the ortho-P flux could be suppressed by precipitation and or adsorption on calcite and perhaps hydroxyapatite.
Concluding remarks The results in Figures 3–6 and the DIC/DO ratio in Table 3 suggest that most of both DIC and DO fluxes to and from the lake water reflect the benthic primary production and that NH⫹ 4 is more important source of N than NO–3. The results from the benthic chambers show that source and sinks of Si, P and N are not only controlled by fluxes to and from the bulk lake water and the benthic primary producers. If all the P and N needed for the benthic primary production originate from decomposition of organic matter in the sediments, it should result in release of the DIC in the Redfield ratios from the sediments. In other words it means recycling of much of the organic matter produced on the lake bottom. This is not the case as the lake water is the major DIC source in the summertime 共Figures 3, 4 and 5兲. However, a significant part of the N needed for the primary production is derived from NH⫹ 4 in interstitial sediment water, originating from decomposition of organic matter. This is supported by: 1兲 insignificant measured fluxes of N from the lake water to the benthic communities 共Figures 3, 4, 5 and Table 2兲; 2兲 the DIC/DO ratio in Table 3; and 3兲 the N/P ratio of the lake waters and the spatial – variation of dissolved N, P, NH⫹ 4 , and NO3 across the lake 共Figure 7兲. The dissolved N increases in concentration from the inflow to the lake to the outflow, while P concentration decreases despite that N is rate limitingaccordingtotheRedfieldratios.4兲Highconcentration of dissolved NH⫹ 4 in the interstitial sediment water, 1000 M 共Gíslason et al. 2004兲. 5兲 Significant diffusive flux of NH⫹ 4 from within the sediments towards the lake bottom 共Gíslason et al. 2004兲. The major sources of organic matter on the lake bottom are: 1兲 benthic primary producers; 2兲 plankton; and 3兲 Anabaena flos-aquae. According to Gíslason et al. 共2004兲 the alkalinity flux from the interstitial sediment water towards the lake bottom is of the same order as the NH⫹ 4 flux. The greater part of the alkalinity flux is the flux of bicarbonate stemming from decomposition of organic matter. A significant part of the diffusing bicarbonate might precipitate as Ca and Mg carbonates on the lake bottom in the summertime, at the high pH, and then dissolve during the low pH period in the winter 共Figures 3–5, and 8兲. The bottom water is supersaturated with respect to calcite in the summertime, but undersaturated in the winter at the lowest pH 共Figure 8兲 and the Ca and Mg concentrations are highest in the winter when the pH is lowest 共Figures 3, 4 and 5兲.
206 Acknowledgements We thank Á. Einarsson, H.R. Ingvason, E.S. Eiríksdóttir, P. Frogner, Th.L. Thórarinsson and A. Hjartarson for their invaluable assistance with deployment and recovery of benthic flux chambers, sampling and chemical analysis in the lab, and R.C. Aller for introducing us to the benthic chamber technique at the beginning of this study. We thank T.G. Lacy, S. Arnórsson, J. Ólafsson and two anonymous reviewers for their constructive criticism on an earlier version of this manuscript. This project was supported by The Icelandic Research Council 共Grants 0005200 and 996230099兲, as well as by the Myvatn Research Station, the National Energy Authority, the Science Institute, University of Iceland, and the University of Akureyri, Iceland. References Aller R.C. 1994. The sedimentary Mn cycle in Long Island sound: Its role as intermediate oxidant and the influence of bioturbation, O2, and Corg flux on diagenetic reaction balances. J. Mar. Res. 52: 259–295. Aller R.C., Blair N.E., Xia Q. and Rude P.D. 1996. Remineralization, recycling, and stage of carbon in Amazon shield sediments. Cont. Shelf Res 16: 753–789. Arnórsson S., Elíasson J. and Gudmundsson BTh. 1999. 40 MW gufurafstöd í Bjarnarflagi: mat á áhrifum á grunnvatn og náttúrulegan jardhita. Science Institute. Report RH-26-99, 共in Icelandic兲 36 pp. Ármannsson H., Kristmannsdóttir H. and Ólafsson M. 1998. Krafla – Námafjall. Áhrif eldvirkni á grunnvatn. National Energy Authority 共Orkustofnun兲. OS-98066, 共in Icelandic兲 30 pp. Árnason B. 1976. Groundwater systems in Iceland traced by deuterium. Soc. Sci. Isl. 42: 9–236. Badger M.R., Andrews T.J., Whitney S.M., Ludwig M., Yellowlees D.C., Leggat W. and Price G.D. 1998. The diversity and coevolution of Rubisco, plastids, pyrenoids, and chloroplast-based CO2-concentrating mechanisms in algae. Can. J. Bot. 76: 1052– 1071. Berger G., Cadoré E., Schott J. and Dove P. 1994. Dissolution rate of quartz in Pb and Na electrolyte solution. Effect of the nature of surface complexes and reaction affinity. Geochim. Cosmochim. Acta 58: 541–552. Burkhardt S., Amoroso G., Riebesell U. and Sültemeyer D. 2001. CO2 and HCO–3 uptake in marine diatoms acclimated to different CO2 concentrations. Limnol. Oceanogr. 46: 1378–1391. Dixit S. and Van Cappellen P. 1999. Reactivity of biogenic silica from surface ocean to the sediments. In: Ármannsson H 共ed.兲, Geochemistry of the Earth’s Surface. Proceedings of the 5th International Symposium of Geochemistry of the Earth’s Surface, 16-20 August, 1999. A A Balkema, Reykjavík, Iceland, pp. 311– 314. Dove P.M. and Elston S.F. 1992. Dissolution kinetics of quartz in sodium chloride solutions: Analysis of existing data and a rate model for 25 °C. Geochim. Cosmochim. Acta 56: 4147–4156.
Dove P.M. and Rimstiidt J.D. 1994. Silica-water interactions. In: Heaney P.J., Prewitt C.T. and Gibbs G.V. 共eds兲, Silica. Physical Behaviour, Geochemistry and Materials Applications. Reviews in Mineralogy, Volume 29. Mineralogical Society of America, Washington, DC, pp. 259–309. Einarsson Á. 1982. The palaeolimnology of Lake Myvatn, northern Iceland: Plant and animal microfossils in the sediment. Freshw. Biol. 12: 63-82. Einarsson Á. and Haflidason H. 1988. Predictive palaeolimnology: Effects of sediment dredging in Lake Myvatn, Iceland. Verh. Int. Verein. Limnol. 23: 860–869. Einarsson Á., Óskarsson H. and Haflidason H. 1993. Stratigraphy of fossil pigments and Cladophora and its relationship with tephra deposition in Lake Myvatn, Iceland. J. Paleolimnol. 8: 15– 26. Eiríksdóttir E.S., Gíslason S.R., Elefsen S.Ó., Hardardóttir J., Hreinsson E.Ö. and Torssander P. 2004. Efnasamsetning, rennsli og aurburdur í útfalli Myvatns. Myvatn Research Station, report 共in press兲. Fournier R.O. 1977. Chemical geothermometers and mixing models for geothermal systems. Geothermics 5: 41–51. Frogner P., Gíslason S.R. and Óskarsson N. 2001. Fertilizing potential of volcanic ash in ocean surface water. Geology 29: 487– 490. Gíslason S.R. and Arnórsson S. 1993. Dissolution of primary basaltic minerals in natural waters: Saturation state and kinetics. Chem. Geol. 105: 117–135. Gíslason S.R. and Eugster H.P. 1987a. Meteoric water–basalt interactions: I. A laboratory study. Geochim. Cosmochim. Acta 51: 2827–2840. Gíslason S.R. and Eugster H.P. 1987b. Meteoric water–basalt interactions: II. A field study in NE Iceland. Geochim. Cosmochim. Acta. 51: 2841–2855. Gíslason S.R., Arnórsson S. and Ármannsson H. 1996. Chemical weathering of basalt in SW Iceland: Effects of runoff, age of rocks and vegetative/glacial cover. Am. J. Sci. 296: 837–907. Gíslason S.R., Heaney P.J., Olkers E.H. and Schott J. 1997. Kinetic and thermodynamic properties of moganite, a novel silica polymorph. Geochim. Cosmochim. Acta 61: 1193–1204. Gíslason S.R., Eiríksdóttir E.S. and Ólafsson J.S. 2004. Chemical composition of the interstitial water and diffusive fluxes within the diatomaceous sediment in Lake Myvatn, Iceland. Aquat. Ecol. 38: 163–175 共this issue兲. Gíslason S.R. and Oelkers H.E.2004. The mechanism, rates, and consequences of basaltic glass dissolution: II. An experimental study of the dissolution rates of basaltic glass as a function of pH and temperature. Geochim. Cosmochim. Acta 共in press兲. Grasshoff K. 1983. Determination of oxygen. In: Grasshoff K., Ehrhardt M. and Kremling K. 共eds兲, Methods of Seawater Analysis, 2nd ed. Verlag Chemie, Weinheim, Germany, pp. 61– 72. Gunnarsson I. and Arnórsson S. 2000. Amorphous silica solubility and the thermodynamic properties of H4SiO°4 in the range of 0° to 350 °C at Psat. Geochim. Cosmochim. Acta 64: 2295–2307. Huertas I.E., Espie G.S., Colman B. and Lubian L.M. 2000. Lightdependent bicarbonate uptake and CO2 efflux in marine microalga Nannochloropsis gaditana. Planta 211: 43–49. Hulth S. 1995. Mineralization of biogenic debris in continental shelf and slope sediments. PhD dissertation. Department of Analytical and Marine Chemistry, Göteborg University, Göteborg, Sweden, 98 pp. ⫹ appendices.
207 Ingvason H.R. 2002. Fæduvistfrædi slædumýs 共Tanytarsus gracilentus兲 í Myvatni. MSc thesis. Department of Biology, University of Iceland, Reykjavík, Iceland, 共in Icelandic兲 68 pp. Ingvason H.R., Ólafsson J.S. and Gardarsson A. 2002. Temporal patterns in resource utilisation of Tanytarsus gracilentus larvae. Verh. Int. Verein. Limnol. 28: 1041–1045. Jahnke R.A., Nelson J.R., Marinelli R.L. and Eckman J.E. 2000. Benthic flux of biogenic elements on the southeastern US continental shelf: Influence of pore water advective transport and benthic microalgae. Cont. Shelf. Res. 20: 109–127. Jeffery G.H., Bassett J., Mendham J. and Denney R.C. 1989. Vogel’s Textbook of Quantitative Chemical Analysis. 5th ed. Longman Scientific and Technical, Wiley, Harlow, Essex, 877 pp. Jónasson P.M. 1979. The Lake Myvatn ecosystem, Iceland. Oikos 32: 289–305. Jónasson P.M. and Adalsteinsson H. 1979. Phytoplankton production in shallow eutrophic Lake Myvatn. Oikos 32: 113–138. Kjaran S.P. and Hólm S.L. 1999. Myvatn: Grunnvatnslíkan af vatnasvidi Myvatns 共in Icelandic兲. Mimeographed report, Verkfrædistofan Vatnaskil, 82 pp. Kristmannsdóttir H., Hauksdóttir S., Axelsson G., Ólafsson M. and Ármannsson H. 1999. Ferilprófun á Myvatnssvædi 共in Icelandic兲. Mimeographed report, National Energy Authority 共Orkustofnun兲. OS-99028, 48 pp. Líndal B. 1959. Kísilgúrvinnsla úr ledju Myvatns. Tímarit Verkfrædingafélags Íslands 共Reykjavík兲 44: 19–29. Mercado J.M., Gordillo F.J.L., Figueroa F.L. and Neill F.X. 1998. External carbonic anhydrase and affinity for inorganic carbon in intertidal macroalgae. J Exp. Mar. Biol. Ecol. 221: 209–220. Moss B. 2000. Ecology of Fresh Water: Man and Medium, Past to Future. 3rd ed. Blackwell Science, Oxford, 560 pp. Oelkers H.E. and Gíslason S.R. 2001. The mechanism, rates and consequences of basaltic glass dissolution: I. An experimental study of the dissolution rates of basaltic glass as a function of aqueous Al, Si, and oxalic acid concentration at 25 °C and pH 3 and 11. Geochim. Cosmochim. Acta 65: 3671–3681. Ólafsson J. 1979. The chemistry of Lake Myvatn and River Laxá. Oikos 32: 82–112. Ólafsson J. 1991a. Undirstödur lífríkis í Myvatni. In: Gardarsson A. and Einarsson Á. 共eds兲, The Natural History of Lake Myvatn. Icelandic Natural History Society, Reykjavík 共Náttúra Myvatns兲, pp. 140–165. Ólafsson J. 1991b. Fosfat og ammoníak uppleyst í setvatni í Myvatni. 共in Icelandic兲 Manuscript, June 1991. Ólafsson J.S. and Paterson D.M. 2004. Alteration of biogenic structure and physical properties by tube building chironomid larvae in cohesive sediments. Aquat. Ecol. 38: 219–229 共this issue兲. Parkhurst D.L. and Appelo C.A.J. 2001. PHREEQC 共Version 2兲- A Computer Program for Speciation, Batch-Reaction, One-Dimensional Transport, and Inverse Geochemical Calculations. Priscu J.C. 1984. A comparison of nitrogen and carbon metabolism in the shallow and deep-water phytoplankton population of a subalpine lake: Response of photosynthetic photon flux density. J. Plankton Res. 6: 733–749. Scheffer M. 1998. Ecology of Shallow Lakes. Chapman and Hall, London, UK, 384 pp. Shock E.L., Helgeson H.C. and Sverjensky D.A. 1989. Calculations of the thermodynamic and transport properties of aqueous
species at high pressures and temperatures: Standard partial molal properties of inorganic neutral species. Geochim. Cosmochim. Acta 53: 2157–2183. Sicko-Goad L., Scheleske C.L. and Stoermer E.F. 1984. Estimation of intracellular carbon and silica content of diatoms from natural assemblages using morphometric techniques. Limnol. Oceanogr. 29: 1170–1178. Sigbjarnarson G., Tómasson H., Elíasson J. and Arnórsson S. 1974. Álitsgerd um mengunarhaettu vegna affallsvatns frá gufuvirkjun vid Kröflu eda Hverarönd. OS JHD 7427, Mimeographed report, National Energy Authority 共Orkustofnun兲, Reykjavík, 16 pp. Skoog D.A., West D.M. and Holler F.J. 1990. Analytical Chemistry, an Introduction. 5th ed. Saunders Golden Sunburst Series, Saunders College Publishing, Philadelphia, USA. 642 pp. Stefánsson A. and Gíslason S.R. 2001. Chemical weathering of basalts, southwest Iceland: Effect of rock crystallinity and secondary minerals on chemical fluxes to the ocean. Am. J. Sci. 301: 513–556. Stefánsson A. and Gíslason S.R. 2001. Chemical weathering of basalts, southwest Iceland: Effect of rock crystallinity and secondary minerals on chemical fluxes to the ocean. Am. J. Sci. 301: 513–556. Stefánsson A., Gíslason S.R. and Arnórsson S. 2001. Dissolution of primary minerals of basalt in natural waters: II. Mineral saturation state. Chem. Geol. 172: 251–276. Stumm W. and Morgan J.J. 1996. Aquatic Chemistry: Chemical Equilibria and Rates in Natural Waters. John Wiley & Sons, New York, 1022 pp. Sültemeyer D. 1998. Carbonic anhydrase in eukaryotic algae: Characterization, regulation, and possible function during photosynthesis. Can. J. Bot. 76: 962–972. Thorarinsson S. 1979. The postglacial history of the Myvatn area. Oikos 32: 17–28. Thorbergsdóttir I.M., Gíslason S.R., Ingvason H.R. and Einarsson Á. 2004. Benthic oxygen flux in the highly productive subarctic Lake Myvatn, Iceland: In situ benthic flux chamber study. Aquat. Ecol. 38: 177–189 共this issue兲. Thornton D.C.O., Underwood G.J.C. and Nedwell D.B. 1999. Effect of illumination and emersion period on the exchange of ammonium across the estuarine sediment-water interface. Mar. Ecol. Prog. Ser. 184: 11–20. Van Cappellen P. and Qui L. 1997a. Biogenic silica dissolution in sediments of the Southern Ocean: I. Solubility. Deep-Sea Res. II 44: 1109–1128. Van Cappellen P. and Qui L. 1997b. Biogenic silica dissolution in sediments of the Southern Ocean: II. Kinetics. Deep-Sea Res II 44: 1129–1149. Walter J.W. and Helgeson H.C. 1977. Calculation of the thermodynamic properties of aqueous silica and the solubility of quartz and its polymorphs at high pressures and temperatures. Am. J. Sci. 277: 1315–1351. Wetzel R.G. 2001. Limnology: Lake and River Ecosystems. 3rd ed. Academic Press, New York, 1006 pp. Williams P.J. and Robertson J.E. 1991. Overall planktonic oxygen and carbon dioxide metabolism: The problem of reconciling observations and calculations of photosynthetic quotients. J. Plankton Res. 13: 153–169.