Internal Structure and Early Thermal Evolution of Mars from Mars Global Surveyor Topography and Gravity Maria T. Zuber, et al. Science 287, 1788 (2000); DOI: 10.1126/science.287.5459.1788
This copy is for your personal, non-commercial use only.
If you wish to distribute this article to others, you can order high-quality copies for your colleagues, clients, or customers by clicking here.
The following resources related to this article are available online at www.sciencemag.org (this infomation is current as of January 31, 2011 ): Updated information and services, including high-resolution figures, can be found in the online version of this article at: http://www.sciencemag.org/content/287/5459/1788.full.html A list of selected additional articles on the Science Web sites related to this article can be found at: http://www.sciencemag.org/content/287/5459/1788.full.html#related This article cites 34 articles, 9 of which can be accessed free: http://www.sciencemag.org/content/287/5459/1788.full.html#ref-list-1 This article has been cited by 248 article(s) on the ISI Web of Science This article has been cited by 11 articles hosted by HighWire Press; see: http://www.sciencemag.org/content/287/5459/1788.full.html#related-urls This article appears in the following subject collections: Planetary Science http://www.sciencemag.org/cgi/collection/planet_sci
Science (print ISSN 0036-8075; online ISSN 1095-9203) is published weekly, except the last week in December, by the American Association for the Advancement of Science, 1200 New York Avenue NW, Washington, DC 20005. Copyright 2000 by the American Association for the Advancement of Science; all rights reserved. The title Science is a registered trademark of AAAS.
Downloaded from www.sciencemag.org on January 31, 2011
Permission to republish or repurpose articles or portions of articles can be obtained by following the guidelines here.
REPORTS 22. Summary data for all isochron ages are available at Science Online (www.sciencemag.org/feature/data/ 1044416.shl). 23. P. Eberhardt, Proc. Lunar Planet. Sci. Conf. 3, 1821 (1972). 24. T. R. McGetchin, M. Settle, J. W. Head, Earth Planet. Sci. Lett. 20, 226 (1973). 25. G. H. Heiken, T. Vaniman, B. French, Eds., Lunar Sourcebook (Cambridge Univ. Press, New York, 1991). 26. E. C. T. Chao, USGS J. Res. 1, 1 (1973). 27. R. V. Morris, R. Score, C. Dardano, G. Heiken, Tech. Rep. JSC 19069 (Lyndon B. Johnson Space Center, 1983). 28. F. Ho¨rz, R. Grieve, G. H. Heiken, P. Spudis, A. Binder, in Lunar Sourcebook, G. H. Heiken, T. Vaniman,
Internal Structure and Early Thermal Evolution of Mars from Mars Global Surveyor Topography and Gravity Maria T. Zuber,1,4* Sean C. Solomon,2 Roger J. Phillips,3 David E. Smith,4 G. Leonard Tyler,5 Oded Aharonson,1 Georges Balmino,6 W. Bruce Banerdt,7 James W. Head,8 Catherine L. Johnson,2 Frank G. Lemoine,4 Patrick J. McGovern,2† Gregory A. Neumann,1,4 David D. Rowlands,4 Shijie Zhong1 Topography and gravity measured by the Mars Global Surveyor have enabled determination of the global crust and upper mantle structure of Mars. The planet displays two distinct crustal zones that do not correlate globally with the geologic dichotomy: a region of crust that thins progressively from south to north and encompasses much of the southern highlands and Tharsis province and a region of approximately uniform crustal thickness that includes the northern lowlands and Arabia Terra. The strength of the lithosphere beneath the ancient southern highlands suggests that the northern hemisphere was a locus of high heat flow early in martian history. The thickness of the elastic lithosphere increases with time of loading in the northern plains and Tharsis. The northern lowlands contain structures interpreted as large buried channels that are consistent with northward transport of water and sediment to the lowlands before the end of northern hemisphere resurfacing. The interior structure of Mars contains information on bulk composition, differentiation and melting history, and mantle dynamics, all of which bear on the planet’s thermal 1 Department of Earth, Atmospheric, and Planetary Sciences, Massachusetts Institute of Technology, Cambridge, MA 02139, USA. 2Department of Terrestrial Magnetism, Carnegie Institution of Washington, Washington, DC 20015, USA. 3Department of Earth and Planetary Sciences, Washington University, St. Louis, MO 63130, USA. 4Earth Sciences Directorate, NASA/Goddard Space Flight Center, Greenbelt, MD 20771, USA. 5Center for Radio Astronomy, Stanford University, Stanford, CA 94035–9515, USA. 6Groupe de Recherches de Geodesie Spatiale, Toulouse, France. 7 Jet Propulsion Laboratory, Pasadena, CA 91109, USA. 8 Department of Geological Sciences, Brown University, Providence, RI 02912, USA.
*To whom correspondence should be addressed. Email:
[email protected] †Present address: Lunar and Planetary Institute, Houston, TX 77058. USA.
1788
evolution. Global models of martian topography from the Mars Orbiter Laser Altimeter (MOLA) (1) and gravity from Doppler tracking (2) obtained during the mapping mission of the Mars Global Surveyor (MGS) spacecraft (3) have now achieved the coverage and quality required for the first reliable determination of Mars’s crustal and upper mantle structure. We analyzed updated models of topography (4) (Fig. 1A) and free-air gravity (5) (Fig. 1B) expanded to spherical harmonic degree and order 60, corresponding to a spatial resolution of !178 km. Global correlations of the fields are shown in Web figure 1 (6). To investigate the martian internal mass distribution, we calculated Bouguer gravity anomalies, for which the gravitational attraction of surface topography is subtracted from the free-air gravity field to reveal the subsur-
29. 30. 31. 32.
B. French, Eds. (Cambridge Univ. Press, New York, 1991), pp. 285–356. J. P. Grotzinger, S. A. Bowring, B. Z. Saylor, A. J. Kaufman, Science 270, 598 (1995). J. P. Grotzinger, Am. Assoc. Petrol. Geol. 18, 1954 (1997). P. R. Renne et al., Chem. Geol. (Isot. Geosci. Sect.) 145, 117 (1998). Supported by the Ann and Gordon Getty Foundation. We thank W. Alvarez, A. Deino, J. Donovan, D. Karner, K. Ludwig, and T. Teague for discussions and various other invaluable contributions to this research, K. Nishiizumi for curating the samples, and NASA for providing them. 11 August 1999; accepted 18 January 2000
face mass distribution. Bouguer gravity anomalies have been calculated for Mars, but the uncertainties limited geophysical interpretation (7). The simplest interpretation of the Bouguer gravity is that subsurface mass variations are a consequence of variations in the thickness of a crust of uniform density. This interpretation provides a first-order indication of Mars’s internal structure but does not account for density variations within the crust or upper mantle. A model based on this premise provides an approximate lower limit on mean crustal thickness and volume (8). In this model, a crust of density 2900 kg m"3 has an average thickness of 50 km and represents 4.4% of Mars’s volume (Fig. 1C). The minimum thickness is 3 km beneath the Isidis basin, and the maximum thickness of 92 km occurs in the Syria Planum region of Thaumasia. The major features in the free-air gravity field (Fig. 1B) include a broad but geometrically complex anomaly associated with the Tharsis province, positive gravity anomalies over large volcanoes, localized mass concentrations centered on large impact basins, and mass deficits (negative anomalies) associated with the Valles Marineris canyon system. Aside from these structures, the gravitational field is relatively smooth (9). As a consequence, the crustal thickness map, to first order, correlates with the principal features of surface topography (Fig. 1A). The primary topographic feature on Mars is the global south-to-north slope (10, 11). Cross sections of crustal structure (Fig. 2) indicate a progressive thinning of the crust from high southern latitudes toward the north. The northward slope and corresponding decrease in crustal thickness continue through the Tharsis province (Fig. 2B), but the crustal structure changes to a zone of approximately uniform thickness (!35 to 40 km, except for buried basins) under the northern lowlands and the Arabia Terra region of the southern highlands (Fig. 2A). On the basis of their similarity in crustal structure, we infer that Arabia Terra is related to the northern lowlands and may represent exposed basement of the resurfaced northern plains. The transition between the major crustal
10 MARCH 2000 VOL 287 SCIENCE www.sciencemag.org
Downloaded from www.sciencemag.org on January 31, 2011
components of Ar were clearly associated with anomalous Ca/K (determined from 37Ar/39Ar), which we construe to reflect Ca-rich clasts that were incompletely degassed during impact melting; we excluded such analyses from isochron regressions. In some other cases, more than two components of Ar are indicated by nonlinear scatter on isochron diagrams. In such cases the age error is multiplied by the square root of the mean squared weighted deviates, such that isochron ages with excess scatter are deweighted and have little impact on our conclusions. Terrestrial atmospheric contamination is efficiently removed in sample cleaning and preanalysis bakeout, as indicated by consistently low 40Ar/36Ar in even the lowest temperature extraction steps and by the linearity of the isochron data.
REPORTS thickness of fill (that would otherwise produce a mass anomaly); the impact or impacts must have been highly oblique to yield a complex depression; and the event or events must have occurred so early in martian his-
tory (i.e., earlier than the time of formation of the Utopia basin) that any crustal thickness signature has been modified by subsequent processes. We view this combination of requirements as unlikely.
A
km
60°
12 8
30° 4
0°
0
-30°
-4
-60°
Downloaded from www.sciencemag.org on January 31, 2011
provinces at Mars’s hemispheric dichotomy boundary separates the older, heavily cratered southern hemisphere highlands from the relatively smooth, resurfaced, and younger northern hemisphere lowlands (12). The boundary zone (Fig. 1A) has a width of !700 km and is characterized by complex geology (12). In many areas, the dichotomy boundary also exhibits a regional elevation change, sometimes described as a scarp, with relief of up to 4 km over distances of 300 to 1300 km (13). In the longitude range 110° to 190°E, the transition from the northward-thinning to uniform-thickness regions of crustal structure coincides with the dichotomy boundary (Figs. 1C, 2, and 3). Most of the dichotomy boundary, however, does not correspond to the crustal thickness transition, and it is apparent that the geologic expression of the dichotomy boundary is not a fundamental feature of Mars’s internal structure. One hypothesis for the formation of the northern lowlands invoked a large impact or impacts in the northern hemisphere (14, 15). By this hypothesis, the scarp-defining part of the boundary between the hemispheres is interpreted as remnant basin rim material (15). Impact origin hypotheses for the northern lowlands predict a global association of crustal thickness and the dichotomy boundary, as is seen in lunar basins (16); topography revealing the shape or shapes of the basins; and the presence of gravity signatures representing basins of appropriate size and distribution to explain the northern lowlands. Three specific features of the results from gravity and topography are inconsistent with an impact hypothesis. First, the global distribution of inferred crustal thickness does not correlate with the dichotomy boundary (Figs. 1C and 3). This result indicates that any crustal thickness signature of an impact origin for the northern lowlands, if it once existed, has since been erased by subsequent processes. Second, the topography (11) and crustal thickness (Fig. 3) make clear the complex outline of the northern basin (11), and impact events have not been otherwise observed to produce such structures. Third, there is no gravity signature or signatures of the appropriate size and distribution to account for the northern lowlands by the formation and subsequent modification of large impact structures (9). An unfilled early basin would likely be compensated, whereas a filled basin, more consistent with the resurfacing age of the northern lowlands, would be expected to have a positive mass anomaly. Although the Utopia basin fits this description and other smaller positive gravity anomalies can be found in the northern plains (9), this pattern is not seen for the northern lowlands as a whole. An impact origin of the northern lowlands would require that the impact depression is fully compensated and lacks a substantial
-8 180°
240°
300°
0°
60°
120°
180°
B
mGal 1000
60° 30°
500
0° -30°
0
-60° 180°
240°
300°
0°
60°
120°
-500
180°
C
km
60°
80
30° 0° 40 -30° -60° 180°
240°
300°
0°
60°
120°
180°
0
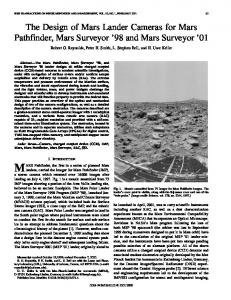
Fig. 1. Global maps of (A) topography, (B) free-air gravity, and (C) crustal thickness (8) of Mars (Mercator projection). On all panels, the Tharsis province is centered near the equator in the longitude range 220° to 300°E and contains the east-west–trending Valles Marineris canyon system and the major volcanic shields Olympus Mons (18°N, 225°E), Alba Patera (42°N, 252°E), Ascraeus Mons (12°N, 248°E), Pavonis Mons (0°, 247°E), and Arsia Mons (9°S, 239°E). The Arabia Terra region is centered at 10°N, 10°E, the Elysium rise is at 30°N, 150°E, the Tempe Terra region lies at 40°N, 290°E, the Syria Planum region is centered at 25°S, 270°E, and the Terra Cimmeria region is centered at 60°S, 180°E. Major impact basins include Hellas (45°S, 70°E), Argyre (50°S, 320°E), Isidis (12°N, 88°E), and Utopia (45°N, 110°E). The hemispheric dichotomy boundary is shown as a red line in (C), solid where distinctively expressed and dashed where estimated. This analysis uses an areocentric coordinate convention with east longitude positive. One degree of latitude on Mars equals !59 km.
www.sciencemag.org SCIENCE VOL 287 10 MARCH 2000
1789
The Tharsis province is characterized by regional variability of crustal thickness superposed on the south-to-north crustal thickness trend. The Solis Planum (southern Tharsis) and Tempe Terra (northeast Tharsis) regions represent zones of thicker crust than their surroundings, although the former area is underlain by a crustal root whereas the latter is a topographic dome without a root. The spatial variability of crustal thickness in Tharsis supports the notion of volcanism as a contributor to the elevation of the province (17). The Valles Marineris canyon system (Fig. 1C and Web figure 2A) (6) displays crustal thinning beneath the trough axis, which may be a consequence of lithospheric stretching caused by extensional stresses associated with the Tharsis rise (18). Derived crustal thicknesses reveal differences in style associated with volcanic constructs. The ancient Alba Patera structure that dominates northern Tharsis (Fig. 2B) is a zone of thicker crust and displays a broad morphologic similarity to the Elysium rise (Web figure 2B) (6). In contrast, younger shields such as Olympus (Fig. 1C) and Elysium (Web figure 2B) (6) Montes, as well as the Tharsis Montes, display apparent crustal thinning (8). The differences in crustal structure among these volcanic centers may reflect some combination of variations in magma composition, eruptive properties, and lithospheric structure through time. On Mars, as for the moon (16), all major impact basins including Hellas, Argyre, Utopia, and Isidis exhibit varying degrees of crustal thinning. Thinned crust beneath martian basins may be the consequence of excavation and mantle rebound associated with the impact process (16). The large Hellas and Utopia structures are surrounded by annuli of thickened crust (Web figure 2, C and D) (6), as are major basins on the moon (16) and the Chicxulub structure on Earth (19). Average crustal thicknesses of 100 to 250 km, larger than that in Fig. 1C, have been suggested on the basis of the geochemistry of martian meteorites (20). These suggestions raise the question as to whether or not a much thicker crust is as plausible as our 50-km mean model. To investigate this possibility, we estimated the sustainability over time of the long-wavelength component of the crust. A viscoelastic relaxation model (21) indicates that a pole-to-pole (spherical harmonic degree 1) crustal thickness anomaly in a crust with mean thickness of 50 km could be maintained for #108 years, the approximate time scale of high early heat flow indicated by thermal models, provided that the time-averaged viscosity of the lower crust is #1020 Pa!s. Larger crustal thicknesses require a still higher viscosity in the lower crust. The 100km lower limit of crustal thickness suggested by martian meteorite chemistry would require
1790
a value of viscosity for the lower crust, 1022 Pa!s, that exceeds the present-day value for Earth’s upper mantle. We consider such a scenario unlikely, particularly because our estimation represents a time average that must factor in the thermal state of an early, warmer martian interior. On the basis of thermal history models (22, 23), it is conceivable that early in martian history the lower crust could have been characterized by a viscosity as low as 1015 Pa!s. Because the minimum crustal thickness is only !3 km in the current model, a thinner crust would require a higher crustal density in the northern hemisphere than assumed here. The crustal relaxation model indicates that relatively rapid cooling of a thin crust is required to maintain the degree-1 component of crustal structure and favors a mean crustal thickness of !50 km. Joint analysis of gravity and topography permits the determination of the effective elastic thickness (Te) of the lithosphere (i.e., the outer shell of long-term strength) on a regional basis for most of the planet. To first order, Te can be regarded as the depth to an isotherm (!650°C) beneath which the martian interior is too weak to support stresses over geologically long (!108 year) intervals. We applied spatio-spectral localization and multitaper coherence methods and compared observed values with those predicted by models for loading of an elastic lithosphere (24). Results indicate variability in lithosphere structure among major physiographic provinces (Fig. 4). For example, the southern highlands, including the Hellas impact basin, indicate a best fit Te ranging from 0 to 20 km, whereas the Alba Patera volcano displays Te $ 50 km. Olympus Mons and the other Tharsis volcanoes are characterized by Te #100 km. Within the southern highlands, the Terra Cimmeria region of prominent linear magnetic anomalies revealed by the MGS magnetometer experiment (25, 26) shows Te $ 20 km. This value is comparable to the 30-km depth extent of coherent magnetiza-
tion [i.e., the depth of the Curie temperature at the time of magnetization (27)] estimated from observed magnetic anomaly magnitudes (25, 26) for specific magnetizations comparable to that of Earth’s upper oceanic crust (27), the primary contributor to marine magnetic anomalies. In the determination of lithosphere thickness, the flat northern plains of Mars (28) represent a special case because deposition and erosion have smoothed topography to such an extent that inversions based on isostatic response methods yield incorrect results (29) unless bottom loading and erosion are also considered. To obtain a reliable estimate of Te for the northern lowlands, we used a forward model for the lithospheric response to filling of the Utopia basin (30). For basin-fill density comparable to the crustal density assumed in the model of Fig. 1C (volcanic fill), or for fill densities appropriate to sedimentary loading of a locally denser crust (30), the model yields a lithospheric thickness of !100 km in the vicinity of Utopia. If lithospheric thickness is interpreted as a proxy for time since crustal formation, then the progressively greater lithosphere thicknesses from the southern highlands to the northern plains to Tharsis would be in conflict with the younger surface ages in the north indicated by crater densities and stratigraphic relations (31). The lithospheric thickness results, however, are explained if, as on Earth (32), elastic thickness reflects the thermal state of the martian lithosphere at the time of loading. The southern highlands are oldest, indicative of crustal stabilization and loading earliest in martian history, followed by the northern lowlands, with an elastic thickness that reflects the thermal state during the period of northern hemisphere resurfacing. For instance, for a conductively cooled lithosphere originally emplaced at temperatures close to that of the convecting mantle, the Te value derived for Utopia suggests that filling of the topographic depression occurred
Fig. 2. Circum-Mars profiles of crustal thickness along longitude lines of (A) 0° to 180°E and (B) 70° to 250°E. Light gray represents crust, and dark gray represents mantle. In the figures, the south pole is at both ends of the plot, the north pole is at the center, and the lower longitude profiles (0°E and 70°E) are on the left sides of the plots. Apparent crustal thickening beneath the north and south polar regions is an artifact of the assumption that layered terrains and ice caps are composed of material with the same density as the crust rather than less dense ice plus dust. The arrows in (A) show the location of the hemispheric dichotomy boundary. The vertical exaggeration is 30 :1.
10 MARCH 2000 VOL 287 SCIENCE www.sciencemag.org
Downloaded from www.sciencemag.org on January 31, 2011
REPORTS
!500 million years subsequent to crustal formation. The Tharsis province displays the thickest lithosphere, implying the most recent loading, consistent with young surface ages (31). The collective results provide constraints on the thermal state of Mars at various stages in its evolution. Estimates of heat flow q at the time of loading derived from estimates of elastic lithosphere thickness and considerations of temperature-dependent flow laws for crust and mantle material under a range of representative strain rates (Fig. 4 and Web table 1) (6, 33) may be compared with the predictions of thermal history models. Isoviscous models (22) characterized by a lid with a constant basal temperature produce the slowest cooling during early martian evolution. In contrast, models with strongly temperature-dependent viscosity described by scaling laws suggesting that Mars convected in a stagnant lid regime (23) show the most rapid falloff in early heat flow. The fundamental differences in lithospheric structure between the southern highlands, northern lowlands, and Tharsis rise provide quantitative constraints on the cooling of Mars over time. The lithospheric thicknesses determined for large areas of the southern lithosphere indicate a heat flow on early Mars that is considerably less than the global averages suggested by most thermal evolution models. If this discrepancy is correct, then a disproportionally large fraction of the heat loss must have been localized in another part of Mars, in a region or regions where lithosphere thicknesses at the earliest times cannot be determined because values in such regions reflect the thermal state at times of subsequent geological activity. High heat flow, distributed approximately uniformly over a broad region, would have cooled the
models, are consistent with early martian plate tectonics, although the hypothesis is far from conclusively demonstrated. The northern hemisphere lowlands of Mars, the flattest known large-scale surface in the solar system (28), were shaped by the resurfacing of heavily cratered terrain. The gravity field shows mascon anomalies that represent evidence for impact basins buried beneath the fill, of which Utopia is the largest (9). Geological reasoning [e.g., (12, 31)] has favored volcanism as the principal mechanism of resurfacing of the northern plains. Our model for the gravity anomaly over the Utopia basin is permissive of either volcanic or sedimentary fill (30). In other parts of the northern lowlands, however, there is clear evidence that sediments contributed substantially to the resurfacing. Outflow channel termini in the Chryse region have been shown to occupy a nearly constant geopotential elevation (37) that corresponds to a geological boundary [Contact 2 in (38)] proposed on the basis of Viking Orbiter image interpretation to represent the former shoreline of a large standing body of water. A prominent negative gravity lineation over Valles Marineris reflects a mass deficit of the trough depression (Web figure 2A) (6). This lineation follows the outflow channels first east and then north into Chryse beyond Contact 2 and into the northern lowlands, bifurcating toward the northwest and, more prominently, the northeast, and in each case following the highland-lowland boundary. The northwest branch of the gravity anomaly intensifies and broadens at the mouth of Kasei Vallis (25°N, 310°E). It then extends northward of 75°N and includes a major branch to the east (39). Within the northern plains, these negative gravity anomalies lack topographic expression (Fig. 5B), indicating that the source of the mass deficit is in the subsurface.
200 100 Te, km
Fig. 3. Polar stereographic projection of martian crustal thickness. The figure encompasses latitudes from 20°S to 90°N. The contours are at intervals of 5 km.
mantle and led to lower melt production and to a lower crustal production rate (i.e., thinner crust) later in martian history (34). On the basis of crustal structure and relative surface age (31), the most plausible locus of high heat flow on early Mars is the northern lowlands. It has been previously suggested by Sleep (35) that the earliest phase of martian history was one of crustal formation by a martian analog of plate tectonics and the formation of the northern hemisphere crust during the final stages of that era. The identification of linear magnetic anomalies over a part of the southern hemisphere, suggesting alternating polarity (or at least discontinuous magnetization amplitude), has been taken as support for a crustal spreading origin for the southern highland crust during a time when a strong global magnetic field underwent dipole polarity reversals (26). The cessation of an early plate tectonic heat flow regime may have resulted in an episode of mantle heating that suppressed core heat loss and led to the demise of the core dynamo (36). Although the crustal structure within the zone of prominent magnetic lineations is not distinctive from other parts of the southern highlands, it is the northern lowlands region proposed as the locus of most recent plate tectonic activity (35) that displays a distinctive crustal structure. The 40-km crustal thickness contour corresponds closely to Sleep’s proposed limits of late-stage mobile plates (35). On Earth, passive upwelling of warm mantle material produces a crust consistency about 6 km thick. A 40-km-thick northern lowlands crust could be the product of crustal spreading if the mantle potential temperature were somewhat greater than that typical of modern mid-ocean ridges (34). This argument, and the comparison of heat flow estimates (Fig. 4) with thermal history
75 50 20 10 10
Downloaded from www.sciencemag.org on January 31, 2011
REPORTS
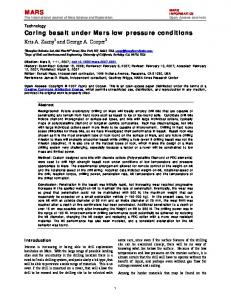
Olympus Mons Pavonis Mons Tharsis Rise Noctis Labyrinthus Utopia Elysium VM/Melas Chasma Alba Patera Solis Planum MAG Terra Cimmeria Hellas Arabia Terra Noachis Terra
20
30 40 q, mW m -2
50
60
Fig. 4. Effective elastic thickness Te and corresponding heat flow q obtained from lithospheric thickness inversions (24, 30). Shown for comparison (dashed line) is the depth to the Curie temperature indicated from analysis of MGS magnetic data in Terra Cimmeria (26, 27).
www.sciencemag.org SCIENCE VOL 287 10 MARCH 2000
1791
Fig. 5. High-resolution gravity (43) draped over a shaded relief map of part of the northern hemisphere showing evidence for buried channels: (A) observed free-air gravity and (B) predicted gravity due to attraction of surface topography. The fact that (A) and (B) differ indicates that the
Unless the martian crust has thickened in quasi-linear zones that emanate from outflow channels, these mass deficiencies must correspond to regions within the crust that are of lower density than their surroundings. Although the linear gravity anomalies do follow, in part, the hemispheric dichotomy boundary, they do not follow transitions in crustal structure (Fig. 1C) and thus are unlikely to be tectonic in origin. We interpret these features as the extension of outflow channels that are now buried beneath the northern plains. The hypothesis that the negative gravity lineations are due to buried channels is testable in terms of such parameters as the volume of material removed, channel bottom gradient, depositional basins for outflow, and the trade-off between infill density and channel depth. By terrestrial analogy (40), the geometric characteristics and flow properties of these structures are consistent with either subaerial or subaqueous flow. The lineations are about 200 km in width and thousands of kilometers in length. If these features mark buried channels, then their scale indicates that they would have transported large quantities of water to mid to high northern latitudes in Mars’s ancient past. Such channels also would have carried a large sediment load that plausibly contributed to the resurfacing of the northern lowlands. The gravity signature implies an average subsurface relief of 1.5 to 4.5 km if the channels are sediment-filled or about 1 to 3 km if the structures contain an ice-sediment mix (39). If large lakes or an ocean ever developed in the northern hemisphere of Mars (37, 38), then the geometric character-
1792
gravity lows in the northern lowlands shown in (A) are due to subsurface mass deficits. The plot is a Hammer projection from 30°S to 90°N latitude, 270° to 360°E longitude. North is at the top of each panel. Valles Marineris is the prominent feature at the lower left.
istics of the buried channels imply that bodies of water could have accumulated rapidly. In addition, these features indicate that substantial amounts of water and sediment were transported to the northern lowlands before the cessation of resurfacing. References and Notes
1. M. T. Zuber et al., J. Geophys. Res. 97, 7781 (1992). 2. G. L. Tyler et al., J. Geophys. Res. 97, 7759 (1992). 3. A. L. Albee, F. D. Palluconi, R. E. Arvidson, Science 279, 1671 (1998). 4. The topographic field was derived from the MOLA (1) and represents an improvement of (11). The spherical harmonic model is to degree and order 720 with a spatial resolution of 15 km and a radial accuracy of 1 to 5 m. The spherical harmonic model was fit to more than 2 % 108 elevation measurements and 2 % 106 altimetric crossovers. 5. The gravity field was derived from X-band Doppler tracking of the MGS spacecraft and 7000 altimetric crossovers and is updated from previous Doppleronly solutions (9, 41). The solution used herein (42) is to degree and order 80 but is interpreted to degree and order 60, which represents an estimate of the coefficient limit of a field that can be produced without a power law constraint (43) on the gravitational field inversion as is commonly imposed for solution stability. This constraint stabilizes the least squares inversion for the gravity field for planets with nonuniform data distribution but also suppresses short-wavelength power. The Doppler data have a typical accuracy of 0.03 to 0.05 mm s–1 averaged over 10 s. The interpreted field has an accuracy of about &10 mGal at the poles, &20 mGal at the equator, and &100 mGal over the Tharsis Montes and Olympus Mons. Note that 1 Gal $ 10–2 m s–2. 6. Supplementary data are available at www.sciencemag. org/feature/data/1048803.shl. 7. R. J. Phillips, R. S. Saunders, J. E. Conel, J. Geophys. Res. 78, 4815 (1973); B. G. Bills and A. J. Ferrari, J. Geophys. Res. 83, 3497 (1978); W. S. Kiefer, B. G. Bills, R. S. Nerem, J. Geophys. Res. 101, 9239 (1996); H. V. Frey, B. G. Bills, R. S. Nerem, J. H. Roark, Geophys. Res. Lett. 23, 721 (1996). The most widely used Mars topographic model before MOLA was the USGS digital terrain model (44), which had average
errors on a global basis of about &1 km (11) but local excursions of up to 5 km. The corresponding errors in Bouguer gravity were about &120 mGal on average and as much as &600 mGal locally. The contribution to Bouguer errors from MOLA topography is '1 mGal and that from gravity field errors ranges from 10 to 100 mGal, depending on the location and signal amplitude. In contrast to pre-MGS studies, Bouguer gravity errors for Mars are now dominated by gravity field error rather than by errors in surface topography. For a given crustal thickness model, errors in the gravity field result in formal errors in crustal thickness of about 90 to 900 m. 8. Using a method that incorporates terrain corrections for surface loads (45), we converted Bouguer gravity, evaluated on the areoid, to crustal thickness (Fig. 1C) by assuming that anomalies can be represented by relief along a single subsurface interface between material of contrasting density. The crustal thickness model was expanded to degree and order 50 to assure stability in the downward continuation of Bouguer gravity to the subsurface interface. We assumed a radially uniform mantle and core, a mean density of Mars of 3930 kg m–3, and a density difference between crust and mantle of 600 kg m–3. Meteorites believed to be basaltic samples of the martian crust (shergottites) have densities estimated from modal mineralogies (46) of 3230 to 3350 kg m–3, which exceed the average crustal density (2900 kg m–3) that we assumed. Thus, crustal thicknesses beneath major volcanic constructs and volcanically flooded impact basins are likely to be underestimates. Higher densities for some volcanic material could result from a lower silica fraction or a higher ratio of iron to magnesium than for the assumed average crust. An alternative interpretation to a constant crustal density, that compensation occurs by a spatial variation in crustal density, is possible although not easily reconciled with a progressive change in crustal composition over thousands of kilometers. Compensation due to a lateral variation in mantle density is also possible, e.g., by a 2% density difference distributed over a depth range of 300 km. However, a pole-to-pole density variation would be difficult to maintain over geologic time against mantle flow, particularly during early martian history when mantle temperatures may have been higher than at present. 9. D. E. Smith et al., Science 286, 94 (1999). 10. D. E. Smith and M. T. Zuber, Science 271, 184 (1996).
10 MARCH 2000 VOL 287 SCIENCE www.sciencemag.org
Downloaded from www.sciencemag.org on January 31, 2011
REPORTS
11. D. E. Smith et al., Science 284, 1495 (1999). 12. M. H. Carr, The Surface of Mars (Yale Univ. Press, New Haven, CT, 1981). 13. H. Frey, S. E. Sakimoto, J. Roark, Geophys. Res. Lett. 25, 4409 (1998). 14. D. E. Wilhelms and S. W. Squyres, Nature 309, 138 (1984); G. E. McGill, J. Geophys. Res. 94, 2753 (1989). 15. H. V. Frey and R. A. Schultz, Geophys. Res. Lett. 15, 229 (1988). 16. S. R. Bratt, S. C. Solomon, J. W. Head, C. H. Thurber, J. Geophys. Res. 90, 3049 (1985); M. T. Zuber, D. E. Smith, F. G. Lemoine, G. A. Neumann, Science 266, 1839 (1994). 17. S. C. Solomon and J. W. Head, J. Geophys. Res. 82, 9755 (1982). 18. W. B. Banerdt, M. P. Golombek, K. L. Tanaka, in Mars, H. H. Kieffer, B. M. Jakosky, C. W. Snyder, M. S. Matthews, Eds. (Univ. of Arizona Press, Tucson, AZ, 1992), pp. 249 –297. 19. J. Morgan and M. Warner, Geology 27, 407 (1999). 20. F. Sohl and T. Spohn, J. Geophys. Res. 102, 1613 (1997). 21. Using the method of (47), we estimated the relaxation time for a degree-1 crustal thickness variation on a self-gravitating spherical planet. We assumed a mechanically strong upper crust of thickness 20 km and a uniform-thickness viscous lower crust. Densities are as in (8). 22. G. Schubert and T. Spohn, J. Geophys. Res. 95, 14095 (1990). 23. O. Grasset and E. M. Parmentier, J. Geophys. Res. 103, 18171 (1998); G. Choblet, O. Grasset, E. M. Parmentier, C. Sotin, Lunar Planet. Sci. 30, 1556 (1998); T. Spohn, D. Breuer, V. Conzelmann, Eos (Fall Suppl.) 80, F619 (1999). 24. M. Simons, S. C. Solomon, B. H. Hager, Geophys. J. Int. 131, 24 (1997); F. J. Simons, M. T. Zuber, J. Korenaga, J. Geophys. Res., in press. The admittance is the response function between spectral gravity and topography, and the coherence is the square of the correlation coefficient between normalized spectral amplitudes of gravity and topography. The admittance approach assumes surface loading of an elastic spherical shell, whereas the coherence approach assumes surface and subsurface loading of an elastic plate. Both methods use densities as in (8). 25. M. H. Acun˜a et al., Science 284, 790 (1999). 26. J. E. P. Connerney et al., Science 284, 794 (1999). 27. Common magnetic minerals on Earth carry remanent magnetization only at temperatures less than the Curie temperature of 580° (magnetite) to 680°C (hematite) [D. J. Dunlop and O. Ozdemir, Rock Magnetism (Cambridge Univ. Press, Cambridge, 1997)]. 28. D. E. Smith et al., Science 279, 1686 (1998). 29. D. W. Forsyth, J. Geophys. Res. 90, 12623 (1985). 30. Given the similar diameters of Hellas and Utopia (11), we used the current gravitational and topographic signatures of Hellas and calculated the tradeoff between Te and fill density that is required to explain Utopia. For Hellas, we used a depth of 11 km, a degree-6 (corresponding to the basin diameter) gravity anomaly of –160 mGal, and a crust-mantle boundary as in Fig. 1C. For Utopia, we used a depth of 2.5 km and a gravity anomaly of 270 mGal. We calculated Te as in (48). If the primary contributor to Utopia basin fill is sedimentary (density $ 2200 kg m"3), then for a local crustal density comparable to that of shergottites (3200 kg m"3), the same elastic thickness (100 km) is obtained as for volcanic filling of a crust having the density assumed for the model of Fig. 1C. 31. K. L. Tanaka, D. H. Scott, R. Greeley, in (18), pp. 345–382. 32. A. B. Watts, J. H. Bodine, M. S. Steckler, J. Geophys. Res. 85, 5369 (1980). 33. S. C. Solomon and J. W. Head, J. Geophys. Res. 95, 11073 (1990); M. K. McNutt, J. Geophys. Res. 89, 11180 (1984). We converted effective elastic thickness (Te) to heat flow via computation of the mechanical thickness of an elastic-plastic plate (Tmech). The approach entails adopting a range of representative strain rates (10"19 s "1 and 10 "15 s–1) and ductile flow laws for the lower lithosphere (49) and
34. 35. 36. 37. 38. 39.
40. 41. 42. 43. 44. 45. 46.
constructing models of bending stress that are consistent with a best-fit lithospheric strength envelope (50). D. W. Forsyth, J. Geophys. Res. 98, 16073 (1993). N. H. Sleep, J. Geophys. Res. 99, 5639 (1994). F. Nimmo and D. J. Stevenson, J. Geophys. Res., in press. J. W. Head III et al., Science 286, 2134 (1999). T. J. Parker, D. S. Gorsline, R. S. Saunders, D. C. Pieri, D. M. Schneeberger, J. Geophys. Res. 98, 11061 (1993). The proposed buried channels are situated within the Tharsis negative gravity ring, which is likely a membrane response to Tharsis loading (51). The linear anomalies are superposed on the relatively broad membrane gravity signal. I. Klaucke, R. Hesse, W. B. F. Ryan, Sedimentology 44, 1093 (1997); Geol. Soc. Am. Bull. 110, 22 (1998). F. G. Lemoine et al., Eos (Fall Suppl.) 80, F618 (1999); W. L. Sjogren, D. Yuan, A. S. Konopliv, Eos (Fall Suppl.) 80, F618 (1999). F. G. Lemoine et al., in preparation. W. M. Kaula, Theory of Satellite Geodesy (Blaisdell, Waltham, MA, 1966). S. S. C. Wu, USGS Map I-2160 (1991). M. A. Wieczorek and R. J. Phillips, J. Geophys. Res. 103, 1715 (1998). H. Y. McSween Jr., Rev. Geophys. 23, 391 (1985).
47. S. Zhong and M. T. Zuber, J. Geophys. Res., in press. 48. D. L. Turcotte, R. J. Willemann, W. F. Haxby, J. Norberry, J. Geophys. Res. 86, 3951 (1981). 49. C. Goetze, Philos. Trans. R. Soc. London Ser. A 288, 99 (1978); Y. Caristan, J. Geophys. Res. 87, 6781 (1982). 50. W. F. Brace and D. L. Kohlstedt, J. Geophys. Res. 85, 6248 (1980). 51. R. J. Phillips, M. T. Zuber, S. A. Hauck, R. M. Williams, K. B. Portle, Lunar Planet. Sci. 31 (abstr. no. 1303) (2000). 52. We thank the MGS spacecraft and mission operations teams at the Jet Propulsion Laboratory and LockheedMartin Astronautics for their contributions to this effort. We also acknowledge R. Follas, J. Abshire, and the MOLA Instrument Team for laser performance information; M. Torrence and J. Schott for assistance in altimetry processing; R. Simpson, P. Priest, S. Asmar, and J. Twicken for assistance in tracking data acquisition and processing; S. Fricke for help with orbit determination; M. Wieczorek for compilation of martian meteorite densities; M. Simons and F. Simons (no relation) for codes used in the lithosphere thickness inversions; and D. Stevenson and N. Sleep for helpful reviews. The MGS Radio Science and MOLA investigations are supported by the NASA Mars Exploration Program. 20 January 2000; accepted 18 February 2000
Suppression of Rain and Snow by Urban and Industrial Air Pollution Daniel Rosenfeld Direct evidence demonstrates that urban and industrial air pollution can completely shut off precipitation from clouds that have temperatures at their tops of about –10°C over large areas. Satellite data reveal plumes of reduced cloud particle size and suppressed precipitation originating from major urban areas and from industrial facilities such as power plants. Measurements obtained by the Tropical Rainfall Measuring Mission satellite reveal that both cloud droplet coalescence and ice precipitation formation are inhibited in polluted clouds. The precipitation-forming processes in clouds depend to a large extent on the presence of aerosols, specifically cloud condensation nuclei (CCN) and ice nuclei. The large concentrations of small CCN in the smoke from burning vegetation nucleate many small cloud droplets (1, 2) that coalesce inefficiently into raindrops (3, 4). Although this effect has been suspected for many years (5, 6), conclusive evidence that smoke from burning vegetation suppresses precipitation was obtained recently with the observations of the Tropical Rainfall Measuring Mission (TRMM) (7) satellite (8). Much less is known, however, about the impact of aerosols from urban and industrial air pollution on precipitation. It was assumed initially that industrial and urban pollution inhibited precipitation, similar to the smoke from burning vegetation (9). Later, reports of enhanced rainfall downwind of paper mills (10) and over major urban areas (11) suggestInstitute of Earth Sciences, The Hebrew University of Jerusalem, Givat Ram, Jerusalem, Israel. E-mail:
[email protected]
ed that giant CCN enhanced precipitation (12), but attempts to correlate the urban-enhanced rainfall to the air pollution sources failed to show any relation (13). Another explanation for the urban rain enhancement invoked the heat-island effect and increased friction, both of which would tend to increase the surface convergence, resulting in more cloud growth and rainfall over and downwind of the urban areas (14). Furthermore, the recent suggestion (15) that air pollution might enhance precipitation on a large scale in northeastern America and the accompanying speculative explanations demonstrate how little is known about the subject. Space-borne (16) and in situ aircraft (17) measurements of ship tracks in marine stratocumulus clouds provided the first evidence that effluents from ship stacks change cloud microstructure by redistributing their water into a larger number of smaller droplets. Albrecht (18) suggested that the drizzle, which normally occurs in marine stratocumulus clouds in clean air, would be inhibited from the clouds with reduced droplet size,
www.sciencemag.org SCIENCE VOL 287 10 MARCH 2000
Downloaded from www.sciencemag.org on January 31, 2011
REPORTS
1793