Internalization, Qualitative Methods, and Evaluation Sarah Faisal1, Brock Craft2, Paul Cairns3, Ann Blandford1 1
University College London Remax House, 31/32 Alfred Place London WC1E 7DP, UK +44 (0) 207 207 679 5225
2
University of York Dept of Computer Science York YO10 5DD, UK +44 (0)1904 434751
[email protected]
[email protected]
{s.faisal, a.blandford} @cs.ucl.ac.uk ABSTRACT
Information Visualization (InfoVis) is at least in part defined by a process that occurs within the subjective internal experience of the users of visualization tools. Users interact with these tools in order to create internal models of the represented domains. We will show that merely relying on standard quantitative usability measures hinders such an experience, and hence cannot be solely relied on. There is more to InfoVis than simply the interface. Qualitative methods on the other hand target users’ subjective experiences. In this paper we demonstrate the potential benefits of qualitative methods for evaluating InfoVis tools through discussing the results of a qualitative study we conducted. The study was conducted in order to evaluate a visualization of the academic literature domain, which we have designed and built using a user-centered design approach. The study resulted in us identifying categories and concepts that are essential to the InfoVis experience. Hence, need to be taken into account when evaluating InfoVis tools.
Categories and Subject Descriptors H5.m. Information interfaces and presentation (e.g., HCI): Miscellaneous.
Keywords Qualitative Evaluation
Methods,
Information
3
The London Knowledge Lab 23-29 Emerald Street London WC1N 3QS +44 (0) 20 7763 2137
Visualization,
Usability,
1. INTRODUCTION From the user’s perspective Information Visualization (InfoVis) is not just the externalization of data. In fact it is more of an internalization process that users engage with in order to make sense of the externalized visual representation of a domain. A user’s interaction with Information Visualization (InfoVis) tools is an experience that goes beyond the interface. Standard quantitative usability measures merely address the usability of the interface without tapping into the subjectivity of the experience. Since users’ interaction with InfoVis tools is a subjective experience which is reflected through the internalization of the data, we are going to need more than usability. In fact, we need to rely on methods that tap into the subjectivity of such an experience. Qualitative research methods aim at understanding the user, not through preset questionnaires or tasks, as do the quantitative usability measures. However, they aim at generating theories that are based on current situations. In this paper we will show that by applying a qualitative research method, Grounded Theory, that we were able to take a step further into understanding the InfoVis experience, which has not previously been attempted. Through the
Grounded Theory analysis we were able to identify categories and concepts that have a direct effect on the InfoVis experience and that should be taken into consideration when evaluating InfoVis tools. The data that we analyzed was based on semi-structured interviews which we conducted with the users after their interaction with a visualization of the academic literature domain. This tool was developed using a User-Centered Design (UCD) approach. We conducted the study with a total of 12 users. However, as we are using a qualitative research methodology, this study is still ongoing with analysis interspersing interviewing. The results of the analysis affect subsequent interviews. This will continue until a saturation point is reached. Hence, we will present the results of analyzing the data of 6 users, we are currently still in the process of analyzing the rest of the interviews. The results of the latter will determine whether or not a saturation point has been reached. The aim on this paper is to demonstrate the benefits that qualitative methods offer to the evaluation of InfoVis tools. This is done by revealing the motivation that led to such a conclusion followed by presenting evidence of these benefits. We identified that standard usability affected the subjectivity of users’ InfoVis experience; in fact it seemed to hinder such an experience. Addressing this subjectivity, as we discuss, is the key to evaluating InfoVis tools. Qualitative methods are ideal for targeting such subjectivity. This argument is backed up by demonstrating the benefits that such methods offer through a discussion of the results reached so far as part of the qualitative study we conducted. These results, although still preliminary, we believe are ground breaking since they point to some aspects of the InfoVis experience that are crucial and yet have not been previously addressed.
2. The InfoVis Experience: Internalization vs Externalization Visualization has become a technology-oriented field, where images are represented out of the mind and upon computer screens. One of the most commonly used definitions is that “InfoVis is the interactive visual representation of data on computer supported tools” [2]. InfoVis tools visually represent abstract data of a particular domain in order to assist users to gain knowledge and insight of the represented domain. Spence [19] defines this as the externalization of the data. Determining externalization is the main role of the designer. The opposite of externalization is internalization. The internalization process is the main role of the InfoVis user. It results from users’ interaction with the external representations. Consequently, users start to make sense of the represented concepts and hence build internal models of the domain [21]. Hence, from the users’ perspective, visualization is more than technology: it is in itself an activity,
more precisely a cognitive activity with which users engage [13]. Recognising the cognitive dimension, Spence [19] defines visualization as a cognitive activity which involves the formation of mental images, and Card, et al. [2] refer to visualization as “amplifying cognition”. Users employ these tools to satisfy their differing needs and goals, which might be to gain insight and knowledge or to test specific hypotheses. It is through users’ interaction with the tool that they are able to satisfy these goals. In other words, it is this interactivity that allows for a subjective user experience [8]. As the users interact with the tool, “ah HA!” moments arise [2][19]. How and when these moments are reached differs from one user to another. It is these “ah HA!” moments that we believe makes them a subjective experience since it is something that is unpredictable and hence particular to each person. Both InfoVis literature and HCI literature refer to cognitive activities that users engage with in order to gain knowledge and interact with a system. However, there are key differences. In the InfoVis literature, mental images represent the images that people construct of a particular domain, whereas in HCI, it represents the models that people develop of a system [16]. We believe that the challenges of evaluating InfoVis tools are based upon these differences. Standard HCI usability measures are designed to capture the usability of the interface and not move beyond that, whereas the focus when evaluating InfoVis tools should somehow tap into users’ internalization process. In other words, we need to be able to determine whether or not the visualization is able to assist users in building domain-related mental models. When it comes to mental images, in the context of InfoVis, there is no right or wrong: the question is how people make sense of something they interact with. Since such images are personal and internal, they are not open to rigorous testing. Capturing and validating mental models is a difficult task due to their subjectivity. During the course of our research we developed and evaluated an InfoVis tool of the academic literature domain. The evaluation took the form of a standard usability study. It is from this process that we discovered the fact that the subjectivity of the tool is undermined by usability. As a result, we began evaluating the tool through the use of qualitative methods. This gave insights into the experience that would have been impossible through the use of purely quantitative methods.
3. Motivation The main goal of our research is focused towards understanding and capturing user’s InfoVis experience. In order to do so, we developed an information visualization of the academic literature domain. The development process was a User-Cantered Design (UCD) one. Requirements were developed through qualitative interviewing [7] and these led to a design based explicitly on these requirements [9].
3.1 Requirements and Design An academic literature domain comprises all the data on the literature covering a particular field of study, e.g.: authors, papers, citations and so on. The intended users are academics who are not only progressing in their own research but also developing and monitoring their understanding of other work being done in the field. Literature data is complex due to its size and the interrelations that exist between entities. From our requirements assessment [7], it became clear that users equate authors with their publications and position authors in terms of the work that they
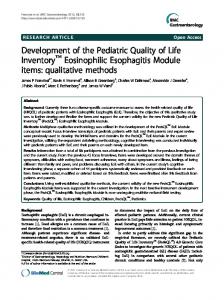
build on through citation. These became key design motivations. Moreover, users make sense of the literature through constantly revealing more details and seemed to spend more time interacting with the details of literature rather than forming “bigger pictures.” The fully functional prototype that we evaluated is shown in Figure 1. The four windows reflect the movement between authors, their publications and the citations between authors and publications. Users could begin their use of the system by a search feature. The interface is described in more detail in Faisal et al [9]. However, we would like to briefly point to a tool that we used in our prototype, which we call the “marking tool”. This tool simply allowed users to highlight entities such as authors and publications. This functionality, although quite simple, resulted in an unanticipated reaction from the users which we will be discussing later on.
Figure 1. Academic Literature Visualization Tool The data used in the evaluations was from the InfoVis’04 contest which includes the complete metadata of 8 years for all InfoVis conference papers and references from 1995 to 2002 [11]. This data included information such as: author names, papers titles, abstracts, keywords, and citation and collaboration information. Users, however, did not have access to the actual physical papers.
3.2 Evaluation Due to the lack of an agreed upon InfoVis evaluation methodology (as epitomised by this workshop), we decided to devise a study that took the shape of a standard task-based usability study. It was intended to improve the usability of the visualization but also to probe the inadequacies of traditional UCD processes for evaluating information visualizations. A set of low-level tasks were devised that targeted the visualization’s visual cues. This idea was inspired from a prominent evaluation study in the field by Morse et al [14] where they devised tasks based on visual taxonomies. Tasks were ranked in three levels of difficulty as detailed below. The difficulty levels were based on the primitiveness of the actions that the users had to engage with in order to accomplish the task. Primitive tasks represent the basic tasks needed to interact with the interface such as locate and identify. Intermediate tasks represent tasks that are executed through a combination of primitive tasks. And last but not least, complex task, are highlevel tasks since they are based on users’ exploration of the visualization and not on specifics. They are less controlling compared to the primitive or the intermediate tasks in terms of the actions that the user must execute, and the answers they provide.
For example: What is the relationship between the following authors [author_name] and [author_name]? Since the grounds of the relationship are unspecified, different users can reach different results in various ways.
3.2.1 The Study The evaluation was a lab-based evaluation centered on 22 tasks covering the range of complexity described. The tasks were presented in order of difficulty reflecting cumulative familiarity and knowledge of how the interface worked. Users were timed and their answers were collected. In addition, researcher’s observations were gathered. Seven participants were used, as we felt that this would begin to reveal major usability problems [15] and also allow us to explore the mismatch with a “proper” InfoVis evaluation. All participants had at least two years of research experience. Prior to beginning the study users were given fifteen minutes training where the system was explained to them and participants could perform some training tasks akin to those used in the study. After conducting the study, participants were asked to answer a questionnaire which was based on the Questionnaire of User Interface Satisfaction (QUIS) [3], in addition to commenting on the tool.
3.2.2 Results This study was successful in that it assisted us in identifying some usability problems. However, it said nothing about the users’ internalized model. In addition, the study showed that usability measures: effectiveness, efficiency and user satisfaction stopped at the interface and hindered what was beyond, that is, the subjectivity of the experience. Effectiveness- All users got most of the answers correct with the highest scoring 96% and the lowest scoring 87%. This indicates that the visual cues used by the system were understandable by the users. Interestingly, most of the complex questions were answered correctly by the participants. This might be due to the fact that these tasks came last in the list of questions, hence bridging the learning curve. In addition, it might be hinting towards the fact that nonrestrictive tasks allowed for subjective experiences in which users started to move beyond the interface and into reasoning and understanding the data. Efficiency- Time was not a suitable measure since users took varying paths whilst executing the tasks, especially when it came to the high-level tasks. For example, users were given a task to identify the relationship between two authors; one user accomplished the task in 16.3 sec whereas another accomplished the task in 64.5 sec. Both users identified accurate relationships except that one took a longer path in examining the domain. User Satisfaction- analysing the QUIS showed that the users had a neutral reaction towards the interface. Even though the users’ rating of the interface was neutral, when asked if they would use the interface to explore literature they all answered ‘yes’ except one who said that he preferred a list representation. Rating the system through previously designed questions does not reflect the feelings that the user has of the interactive experience. We only got a glimpse of users’ feelings through the comments that they gave, for example one of the users commented: “I think I would have a different appreciation of the system if it meant something and helped me”, here the user indicates that his/her satisfaction was affected by their familiarity with the domain, which the QUIS failed to address.
From here we can see that usability only captured a fraction of the user experience, which is the interface. This however is not enough since we believe that there is more to the user experience than merely the interface. In fact what we observed is the fact that usability undermined the subjectivity of the user’s experiences.
3.3 Traditional Usability Neglects Subjectivity We view the InfoVis experience as being similar to linguistic experience where grammar is essential in constructing text. People interact with this grammar in order to generate meaning, in other words, semantics. When comparing this to the experience of using visualizations, we argue that users similarly interact with the visual syntax that is reflected by the visual grammars used to create the visual representations such as: color, position, size, etc. It is through this interaction that higher levels of knowledge and meanings are generated. Looking at this experience closely it can be noted that the ability of people to understand the grammatical syntax of a text does not necessarily guarantee the ability of the text to convey meaning. This study was successful in identifying usability problems that were associated with the interface and the visual language used, in other words, the syntax. However, it said nothing about the knowledge gained; the semantics. Rather, it seemed to hinder the experience. One user commented: “I liked the system but I was trying to complete tasks given – it might mean more if I used it for research and saw interesting relations in papers that was meaningful to me”. Users were so focused on the tasks that “ah HA!” moments were never reached. As a result, we needed to evaluate the tool through tapping into the internalization process, in other words targeting the semantics of the experience. We are in the process of conducting a study where we give the users a non-restrictive high-level task. Following that, users are interviewed and the data is analyzed using the Grounded Theory methodology. However, before we go into detail in explaining the study, we will give a brief overview of qualitative research methods, more specifically Grounded Theory, as it is the method used in our study.
4. Qualitative methods Cresswell [5] identifies five traditions of qualitative research design. These are: biographies, phenomenological studies, Grounded Theory (GT) studies, ethnographies, and case studies. From these traditions, many qualitative evaluation methods have been applied to usability assessment and the information systems design process. Ethnographic techniques and case studies have received particular attention. Many adaptations of these inquiry techniques have also been used, in particular, contextual interviews, observational studies, and contextual interviews, focus groups, and think-aloud approaches [10]. GT and Action Research [1] have also been applied, though they receive less attention, in general. We focus on GT as a method of evolving a rich, datagrounded account of the user-experience. The grounded theoretical approach, or more often, modified techniques based on GT, have received attention in the realm of HCI. GT was developed in the realm of the social sciences as a means of theory development. This is in contrast to methods of theory testing, which have informed the design of traditional usability studies. It is used in situations wherein the researcher seeks to understand phenomena, with an aim to developing knowledge about them and formulating a theory. Instead of starting with a theory a priori, and testing it, the researcher
develops a theory from evaluating the data. A thorough account of GT is provided in [20]. As applied to usability evaluation, the GT approach primarily involves the collection and analysis of interview or transcription data from users. This data is collected during requirements gathering, at design time, during usability testing, and with posttest interviews. Using this data, the researcher analyses the text, assigning meaningful open codes to related categories of data. Categories are a principal organizing method for theory development in GT. The categories are drawn from associations of information within the data itself in the form of recurrent themes. For example, during interviews, many participants may speak of their subjective experiences using the mouse for navigation in an information space. Similarities among their descriptions may point toward attributes of common experiences among the participants. Drawing from this data, the researcher can unite these common experiences to form a category from which theoretical propositions about the user experience can be made. Such propositions are conjectures about the user’s subjective experience which are grounded in the data that was collected. The open codes are created, edited and refined until the researcher determines that further analysis will reveal little useful information, a point called saturation. The open codes can then be collected to form interrelated categories of information, in a process called axial coding. From these activities, the researcher develops an interpretation of the phenomena at work, from which theoretical propositions can be made. A rich set of categories can be used to identify overarching themes about the user experience. Because the focus of GT is on developing theory about subjective experience, we argue that it also holds promise for understanding the subjective experience of using a visualization, primarily because this approach can illuminate the subjective, internal experience of the user and consequently can begin to reveal the factors surrounding “ah HA!” moments. It is a participatory method, which is aimed at eliciting internal dialogues and concerns. It allows for the development of emergent themes toward a theoretical proposition about subjective experiences, and this can be both quantified and grounded in data. An example of using this approach would be to apply a GT approach to analyzing all phases of Visualization development including the Requirements Gathering Phase, the Design Activities Phase, and Usability assessment (i.e., analyzing think alouds). Although we know of no cases where GT has been applied to the analysis of visualization user experience, it has been applied to a case study of the design of visualization systems [4]. The visualization community has recognized the value of usability assessment in improving visualization systems, and there are an increasing number of reported usability tests. However, these reports are exclusively in the domain of the “traditional” methods of usability testing, and do not address the emerging emphasis that practitioners in the HCI community are placing on evaluating the qualitative and subjective. The authors are aware of a handful of studies reporting use of qualitative methods, i.e. case studies [17] which explicitly evaluate visualization systems, though they are not designed specifically for understanding user internalization, as they focus more on usability. In addition, Shneiderman and Plaisant [18] have advocated an ethnographically-based framework for evaluating the success of visualization systems. A counter-argument to this approach is that the attributes of the internalization process may occur outside of the conscious
awareness of users and thus, cannot be collected from user reports of their experiences. Accepting this problem, we believe that this approach is valuable because it will begin to describe the conscious accounts of user experiences (something which is currently lacking) and from these, common themes of discourse across users may yet point to unreported, but extant processes involved in internalization. Our approach may also provide a model for future research into the user experience of visualization systems. More generally, one critique of qualitative methods is that they are subject to individual interpretation, researcher bias, and thus are not able to be easily generalized to a wide range of other cases and situations. This perspective contends that such studies lack validity. Acknowledging that there is room for debate about the merits of both traditions, it is not our purpose to engage in a debate about the nature of positivist versus post-positivist research paradigms. A thorough discussion of the issues is provided in [12]. Given the increasing number of qualitative studies in computer science and particularly in HCI, we regard the qualitative and phenomenological research methods as having been accepted by the community at large.
5. Capturing the Subjectivity of Experience Based upon this, we believe that qualitative research techniques can begin to illuminate the terrain of the subjective, internal experience of visualization users. In order to be able to tap into such subjectivity we conducted a usability study in which we gave the users a high-level non-restrictive task. The reason for doing this was that we wanted to identify whether or not the users will be able to gain insight from the tool, and as seen previously, lowlevel restrictive tasks hinders such an experience. After interacting with the tool, we asked users to talk about their experiences and feelings, and whether or not the tool was able to give them additional insight. This, in addition to users’ observations will be the input of our qualitative analysis which we will do using GT. The results and the insight that we were able to gather from such a study were ground breaking in that they identified factors that are essential to the InfoVis experience but which have not been previously identified. Note, this study is still in progress so any results presented here are necessarily preliminary.
5.1 The Study The study was setup in a lab-based environment. Six participants were given a high-level task which required them to explore the concept of Dynamic Queries and to try to identify the various research camps that target such a concept in addition to the key publications using the InfoVis tool described above. Participants were given a 1996 paper written by Shneiderman titled “Incremental Data Structures and Algorithms for Dynamic queries” as a starting point. However, they were told that they had the choice of whether or not to use this paper as their starting point. The users were told to interact freely with the tool and to stop whenever they felt that they had generated enough insight. Note that users had access to the titles, keywords, and the abstracts of the papers and not the actual paper. However, in certain cases some abstracts were missing from the dataset. Prior to beginning the study, users were asked to fill in their demographic information in addition to rating their knowledge of InfoVis tools and the InfoVis’04 dataset. During the course of the study the researcher observed the participants, took notes of their interaction with the tool and assessed their experiences through their reactions and comments. User’s comments during the
interaction process were recorded in addition to screen interactions. Participants were also asked to rate their knowledge of the concept of Dynamic Queries, and if they were familiar they were asked to list the names of the researchers associated with that concept. This was intended to assess whether or not users were able to gain insight of the concept, in addition to whether or not their background knowledge affected the InfoVis experience. After the study users were interviewed with a semi-structured interviewing process. We transcribed the interviews and analyzed them using the Ground Theory methodology. This resulted in the generation of categories and concepts through open and axial coding which started to hint towards a theory. However, we didn’t feel that we had reached a complete saturation point. As a result, we conducted the study with 6 more participants. The study took the same format as the first however; the interview questions were targeted towards validating our findings. This will continue until a saturation point is reached. In this section we will present the finings from analyzing the data of the first 6 participants. Even though a saturation point was not yet reached, our results nevertheless point to important information which will assist in the evaluation of future visualization tools. We will explain the categories which we identified that make up the user InfoVis experience. However, before explaining these it is essential to give an overview of the theory that is being generated.
5.2 Overview of the Experience Users when engaging in an InfoVis experience tend to take on a systematic process to achieve an overall goal. This process is divided into tasks that are set by the users and are personal to their sensemaking needs. This reinforces the fact that preset-specific tasks are insufficient for evaluating InfoVis tools. Users who are unable to identify such a process tend to engage in a negative experience, as they become lost and hence are not working towards achieving a specific goal. While engaged in the sensemaking process users interact with the interface, which comprises on-screen widgets and physical input devices. In addition, users also interact with the data, which is reflected through the visual encodings and the insights that they generate. Any negative interference from any of these on the users’ sensemaking activities will have a negative effect on the general experience. The ultimate goal of InfoVis is the transformation of the externalized visual representation into internalized mental models. This, as we have observed from our study, results in users’ satisfaction. This satisfaction is affected by the flow of interaction and the functionality of the tool, in addition to users’ backgrounds. Users’ past experiences might have either a positive or a negative effect on their overall satisfaction.
5.3 Categories and Concepts Five main categories were identified which are: flow of interaction, usability, insight, background, and satisfaction. It is the interconnection of these (Figure 2) that will take the user from externalization to internalization.
Flow of Interaction
Usability
Satisfaction
Insight
Background
Figure 2. The InfoVis Experience
5.3.1 Flow of Interaction The flow of interaction represents the main category that ties the InfoVis experience. Users interact with the tool to reach a specific goal, such as a hypothesis that needs to be validated, or specific insight that needs to be gained. In our particular case, the goal is to accomplish a high-level non-restrictive task in which users are required to learn about a specific concept: Dynamic Queries (DQ). As users interact with the visualization tool they engage in a systematic continuous process through which they work towards achieving the intended goal. For example, during the course of the study, one of the users who was asked about his experience said: “the general sense of geography…allowed me to be, what I thought to be relatively systematic”. Users accomplish these high level tasks through the execution of multiple low-level tasks that are personal to them and are related to their background and past experiences,“I tried to identify firstly key people and then maybe key concepts within the concept of DQ I was trying to search for, and then tried to find papers afterwards”. People are different, and so when it comes to designing for a subjective experience this subjectivity needs to be taken into account, as we did when gathering the requirements of the tool [7]. Hence, it is crucial to understand not only the domain, but also how people interact with such a domain, prior to designing the InfoVis tool. Each domain has its own identity and this needs to be reinforced as part of the design. Two categories were identified during the course of analyzing our data that directly affects this flow of interaction, these are: usability and insight. Any negative influence from any of these categories will break the flow and hence will affect the experience negatively.
5.3.2 Usability When users interact with the interface they engage with physical activities. These activities involve the use of physical input devices in order to interact with on screen widgets, such as clicking on a button or dragging a visual entity. In order for an interface to be usable, the system image must fit the user’s model [16]. Usability is essential for achieving a positive user experience. One user, when asked to comment about the interaction said,“Most of the actions are similar to most of the other applications, …even though there are lots of information given to me during the training I can just guess, like maybe right clicking [to get the popup menu]…because they are consistent with other applications”. On the other hand, if the user model doesn’t fit the system image, this affects the experience negatively. One user commented: “I was frustrated because I kept on wanting to drag and it won’t drag”. In addition, we noted that the amount of physical activities that users engage with in addition to the timing in which they occurred
during the course of the flow of interaction affected the experience. For example, during the course of the study one of the participants complained about the necessity of frequent zooming, and when asked to elaborate on whether or not this was distracting he said, “It depended on what I was trying to do, if it was a natural break in between things…it wasn’t [distracting] but if I was zoomed in say [author_1] and I want to go and take a look at [author_2] I got to zoom all the way out, then zoom back in, so yeah that was a little distracting.” Here the user is indicating that if the zooming action occurs while he was in the middle of a thinking trail which is associated with accomplishing a specific task, then the physical activity of zooming affected his experience negatively by distracting him from accomplishing that task. Hence, this tends to indicate that for a positive experience to arise, the design of the InfoVis tool must allow for an uninterrupted flow of interaction. Ensuring the usability of the tool is essential; however, there is more the to the experience than mere usability.
5.3.3 Insight Insight is gained from the data, which is associated with the visual representation. Users must be able to understand the meaning of these representations, in addition to being able to identify patterns. For example, when one of the participants was asked to compare his experiences of using the visualization with his experience using other tools that he would normally employ to accomplish similar tasks. In most cases, these were: Google Scholar, ACM, or CiteSeer. He said that using the visualization, was “…way way easier to get an overview of things really quickly”. In our case, the visual representations were mostly clear and users didn’t have problems understanding the visual cues. In addition to the visual representation and the insight that participants gained, we noted that the completeness of the dataset was also crucial, and might have a negative effect on the experience. This was something that we had not anticipated prior to this study. In our case, the users were interacting with a prototype that visualizes a limited dataset. This dataset was incomplete in certain areas. For example, the citation trails of some seminal papers would stop abruptly, or in certain cases there were missing abstracts. This affected the feelings that the users had of the system and consequently their overall experiences. As in the case of usability, the inability of the tool to portray insight in certain areas affects the experience, particularly while the users are engaged in a sensemaking process. This, we believe is due to the fact that the flow of interaction is broken. Hence, we believe that it is crucial for the datasets used in the evaluation processes to be as realistic as possible. However, this is not always possible as it is very difficult to find clean complete datasets. Usability and insight are things that cannot be pre-calculated. It is true that there are principles that when applied will deliver usable interfaces with well-understood visual cues, yet this is not guaranteed. People are different, their backgrounds and past experiences affects their experiences. This was quite apparent from our analysis and hence we identified background as another crucial category that affects the experience.
5.3.4 Background Users’ backgrounds affect the InfoVis experience. People rely on models that they create of their past experiences interacting with interfaces and apply these when interacting with new interfaces as seen when we talked about usability. In addition, people’s backgrounds and knowledge affect the way that they gain insight of the domain. During the course of the study one of the users
said, “I wanted to scan more and I couldn’t scan more text at once.” This was because when he clicked on a research paper, the tool showed an overview of the paper which included information such as: title, authors, and references. If the user wanted to see more details then he needed to right-click on the paper and select the details option from the popup menu. He, however, relying on his past experiences wanted to be able to access the text directly with the least amount of effort. On the other hand, given the same functionality, another user commented: “I thought that it was really neat that you can just right click and get the abstract right away so you can go through someone [an author] and at a glance”. In addition to the effects that the background might have on usability and insight, the user’s background might have a direct effect on user’s satisfaction of the tool. During the course of the study, when a user was asked to comment on her experiences she said: “just because they are in little boxes doesn’t necessarily mean it is doing anything different that you would do a list”. Here it can be seen that the user could not see the benefits that the tool had to offer and hence didn’t really engage with the tool.
5.3.5 User satisfaction Finally, we identified the category of user satisfaction. We believe that this is the goal of the user’s InfoVis experience. Users reached the satisfaction stage if they were able to sense the benefits that the tool offered them, which in most cases was related to the speed with which they were able to gain insight. In other words, it was related to the ability of the tool to assist users in engaging with the internalization process. This finding was expected, however there were a few very interesting findings that were not apparent prior to this study which are related to increasing users’ satisfaction with the tool. These are related to the concreteness of the results and the personalization of the experience. Both of these were in some way affected by the “marking tool” explained earlier. Although this tool is very simple, it gained astonishing popularity among users and was directly relevant to user satisfaction. Concreteness of the results The “marking tool” allowed users to see the results of their sensemaking efforts. Some users referred to this as a kind of a “mind map” which is interesting, since mind maps are a way of externalizing internalized understanding. This indicates that people were looking for ways visualize their internalized understanding of the externalized information. In addition it was very common that participants asked whether or not they were able to store the results of their domain related sensemaking efforts. One user commented, “What I would’ve really liked to have had is to have a running list of what a marked list was …but as well as being able to see them visually …it would have felt satisfying that that was my thing that I was going to walk away with, that that was my package kind of thing”. Users wanted to have a tangible sense of the efforts that they have accomplished. We think that this relates back to the importance of the completeness of the sense making activity, in that users need to store the results of their actions as they do when interacting with literature in the real world. This indicates that the task of the visualization need not stop at mere externalization but need to take the user from the beginning to the end of the experience.
Personalization The marking tool is very simple. Interestingly, although a simple functionality, it was used differently by different users in ways that we did not anticipate. Users adapted it to their own needs. Some used it to further filter the data: “Being able to go through them and put my own, so its like a two step filter so the system filters and then I filter [using the marking tool] that was really useful”. Others used it for navigating through the domain as landmarks: “I won’t feel lost I can go back”. This is in keeping with the notion of design for appropriation as explained by Dix [6], where design features should be flexible and not rigid, in a way that allows users to employ them for various unanticipated purposes. We believe that applying this design principle when it comes to designing the functionality of the InfoVis tools is crucial, since it will allow for greater personalization, which as we felt from the study is greatly needed. For example, one of the users when asked about their use of the author citation map said, “I wasn’t able to delete items from the map it became very complicated very quickly … I think if it had been possible to delete items like a mind map then I think that I probably would have continued and made it more expansive I even would have wanted to walk away with a printout that sort of thing”. This comment, like many others during the course of the study, strongly indicated a need for greater personalization. From our analysis, it appears that people want to be able to see their internalization of the data.
of a button. Users interacting with our tool were not able to access the actual papers; the inability of our tool to provide a complete literature experience affected the overall satisfaction. Hence, our goal is to integrate this tool with other literature tools to provide a more complete literature experience. In addition to the realism of the experience, we identified that InfoVis experiences needs greater personalization. Personalization does not merely reflect the ability of the users to change the colors and shapes of the visual entities to fit their aesthetic pleasures. Personalization, on the other hand, suggests designing the InfoVis tools in a way that allows users to be able to overlay their own views over the data’s externalization. Since users are different, it is difficult to add personalization features that will fit all users’ needs. As a result, we call for the adoption of the principle of designing for appropriation, such that features are designed to be flexible enough for users to be able to employ them as they see fit, as the “marking tool” that our visualization provides. Analyzing the interviews of the first 6 participants assisted us in better understanding the InfoVis experience, and allowed us to identify additional features and improvements that need to be added to our tools’ design. We are in the process of analyzing the remainder of the interviews in addition to the screen recordings. We hope that by the end of this study we will have an even better understanding of the InfoVis experience and its associated categories that will contribute even more to the design and evaluation of InfoVis tools.
6. Discussion
7. Conclusion
Usability is not enough when it comes to evaluating InfoVis tools. Usability is designed for evaluating the interface, and hence is not solely suitable for evaluating InfoVis tools. InfoVis is not just an interface; it is an experience that needs to be fully understood in order to be effectively evaluated. Qualitative methods, as described, are appropriate evaluation methods that have proven to be successful in understanding the individual. As a result, we applied these methods to understand the InfoVis experience. From this study we identified categories and concepts that could not have otherwise been identified. These categories were explained at a high-level, as more data is currently being analyzed since the study is still on going.
In this paper we demonstrated that in order for us to be able to effectively evaluate InfoVis tools it is essential to tap into users’ internalization process through the use of qualitative methods. We have not only presented an argument as to why this is crucial, but we also demonstrated the benefits that such methods have in identifying key components that were not previously discussed in the InfoVis domain. InfoVis is not only dependent on the visual representations but also reliant on the users, the domain, the interface and the physical activities. We also pointed to the importance of designing for greater personalization and touched on the means with which this can be tackled. We strongly believe that, in order for InfoVis tools to be able to reach the users, users’ needs should no longer be neglected. Users have the information we need in order for us to evolve. We just need to start listening.
The InfoVis user experience can be seen as a personal journey that takes the user from the externalization to internalization, from syntax to semantics. From our study we have learned that any of the components that make up the visualization experience can have either a positive or a negative effect on the users’ overall satisfaction with the tool. This is not only related to the visual cues, but also related to the design rationale which should fit with the characteristics of the domain, in addition to the input devices and its associated physical activities. The aim is to reduce such activities as much as possible so as not to interfere with users’ InfoVis sensemaking activity. Users are not equal; they have past experiences and knowledge that distinguishes them as individuals. These differences have great influence on the InfoVis experience. If users are not able to see the benefits of the tool as soon as they interact with it then this affects their feelings towards the tool. Hence, we strongly believe that it is crucial for the evaluation process to be as realistic as possible. This ranges from the design of the high-level evaluation task to the completeness of the dataset used and its close correspondence to similar real world situations. For example, literature in real situations is reachable online with a simple click
8. REFERENCES [1] Baskerville, R. (1999). “Investigating Information Systems with Action Research,” Communications of The Association for Information Systems, (19) Article 2. [2] Card, S., Mackinlay, J., and Shneiderman, B. (1999). Readings in information Visualization, San Francisco, CA, Morgan Kaufman. [3] Chin, J., Diehl, V., Norman, K. (1988). “Development of an instrument measuring user satisfaction of the humancomputer interface”, Proceedings of the SIGCHI conference on Human factors in computing systems, 213-218. [4] Craft, B. and Cairns, P., (2006). “Using Sketching to Aid the Collaborative Design of Information Visualisation Software A Case Study” , HWID '06 Human Work Interaction Design: DESIGNING FOR HUMAN WORK, Madeira, Portugal 1315 Feb. 2006.
[5] Creswell, J. W., (1998). Qualitative inquiry and research design - choosing among five traditions. London: SAGE. [6] Dix, A., (2007). “Designing for Appropriation”, In Volume 2 Proceeding of the 21st BCS HCI Group Conference, 28- 30, Lancaster, UK. [7] Faisal, S., Cairns, P., and Blandford, A., (2006) “Developing User Requirements for Visualizations of Literature Knowledge Domains,”.Proceedings of the 10th International Conference on Information Visualisation (IV'06), 264-269, London, UK. [8] Faisal, S., Cairns, P., and Blandford, A., (2006) “Subjective Information Visualizations”, V&I workshop on Combining Visualization and Interaction to Facilitate Scientific Exploration and Discovery, British HCI, London. [9] Faisal S, Cairns P, and Blandford A (2007) “Building for Users not for Experts: Designing a Visualization of the literature domain,”. Proceedings of the 11th International Conference on Information Visualisation (IV'07), 707-712, Zurich, Switzerland. [10] Holtzblatt, K. and H. Beyer (1998). Contextual Design: Defining Customer-Centered Systems. San Francisco: Morgan Kaufman. [11] Ke ,W., Borner, K., and Viswanath, L, InfoVis04 Contest MS-Access Database, Indiana University, School of Library and Information Science and School of Informatics, [12] Kuhn, T., (1970). The structure of scientific revolutions (2nd ed.) enlarged. In International Encyclopaedia of Unified Science (Vol. 2, No. 2). Chicago: University of Chicago Press.
[13] MackEachren, A. (1995). How Maps Work, Representation, Visualization, and Design, The Guildford Press, New York, USA. [14] Morse E, Lewis M and Olsen K. (2000). “Evaluating Visualizations: Using a Taxonomic Guide”. International Journal of Human-Computer Studies, (53), 637-662. [15] Nielsen, J. (1995). Advances in HCI Vol 5, Albex, Norwood, NJ. [16] Norman, D. (1988). Psychology of Everyday Things. Basic Books. [17] Seo, J. and Shneiderman, B., (2006). “Knowledge Discovery in High-Dimensional Data: Case Studies and a User Survey for the Rank-by-Feature Framework”, IEEE Transactions on Visualization and Computer Graphics, (Vol. 12, No .3) 311322. [18] Shneiderman, B. and Plaisant, C. (2006). “Strategies for evaluating information visualization tools: multi-dimensional in-depth long-term case studies”. In Proceedings of the 2006 AVI Workshop on Beyond Time and Errors: Novel Evaluation Methods For information Visualization (Venice, Italy, May 23 - 23, 2006). BELIV '06. ACM Press, New York, NY, 1-7. [19] Spence, R. (2007) Information Visualization: Design for Interaction, second edition ACM Press Books, Edinburgh Gate, Harlow, Essex, England. [20] Strauss, A., and Corbin, J., (1998). Basics of Qualitative Research: Techniques and Procedures for Developing Grounded Theory, Sage Publications, London, England. [21] Ware, C. (2000). Information Visualization: Perception for Design: Morgan Kaufmann.


![[PDF] Qualitative Research & Evaluation Methods - Google Sites](https://m.moam.info/img/260x300/pdf-qualitative-research-evaluation-methods-google_64788566097c4737708ce5c2.jpg)

![[PDF] Download Qualitative Research & Evaluation Methods ...](https://m.moam.info/img/260x300/pdf-download-qualitative-research-evaluation-metho_647873f9097c474d228d2b5f.jpg)