Viewpoints and Views in Engineering Change Management René Keller, Claudia M. Eckert, P. John Clarkson Engineering Design Centre, University of Cambridge Trumpington Street, Cambridge, CB3 9BB, United Kingdom http://www-edc.eng.cam.ac.uk Email:
[email protected],
[email protected],
[email protected] Abstract: Visualising connectivity and change propagation in complex products is difficult, but nevertheless is a key for successful design. Several stakeholders, such as designers, managers and customers have different viewpoints on the designed artefact and require different information. Multiple views provide a means to visualise complex information and are also a way to fulfil the demands of different user groups. In this paper we introduce the concepts of multiple viewpoints and multiple views in engineering design and show how multiple views are integrated into a software tool for predicting change propagation. Keywords: Change Management, Complex Products, Visualisation. Introduction Change is an essential part of all design projects. Most products are designed by modifying others. Changes to the existing state of the design can occur at any stage in the design process. When one part is changed, other parts can be affected through the links that exist between them. Component parts are linked by different types of relationships, such as mechanical, spatial, thermal or electrical links, which often correspond to the fields to expertise contributing to the design of the product. Knock-on changes to other components can be unwanted and very costly. Predicting such changes accurately can thus be the key to risk-assessment. In one example, an engine company missed an electrical link between adjacent components when a metal pipe was replaced with a cheaper plastic one. They found that the engine did not work, because one part was no longer earthed. Indirect links between non-adjacent components can be even more problematic to spot. When a helicopter is customised for example, additional systems are often mounted to the outside of the craft. If their weight exceeds the strain margin of the fuselage, the fuselage has to be reinforced, which leads to many other costly changes. Current change prediction methods depend primarily on the experience of engineers, however in complex products, designers are likely to overlook connections and miss potential change paths. The CPM (Change Prediction Method) tool is a software tool that aids in the analysis of change propagation. A number of case studies (Jarratt et al. 2004) including a gas-turbine company and a diesel engine manufacturer showed its industrial applicability. As the industrial success of such a change propagation tool highly depends on finding a way to present all the desired information visually so that the user (in this case the designer) is not overwhelmed by the amount of information, the primary focus is on the development of appropriate human-computer interfaces. In this paper we introduce two concepts. One is the existence of multiple viewpoints in the design process of complex products, due to different stakeholders. The visualisation needs of a project manager are different from that of a designer responsible for the design of a special component and potential customers again demand very different views on the product. As a consequence of these different viewpoints and due to the complexity of the design artefact, we propose the use of different views to visualise design information in effectively. The CPM tool will serve as an example of how such a strategy of multiple views can be integrated into the design process. Complexity in Design Designing a product is complex in many ways. Earl et al. (2004) identified four layers in which complexity in design can occur. First, the product itself is complex as it might have many components that are highly interrelated and linked in various ways. Second, the process of designing the product can consist of many interlinked tasks with probabilistic outcomes that can cause costly iteration. Third, the organisation that designs the product can be considered complex, as it consists of a large number of multidisciplinary teams that are involved in the design. Fourth, the relation of the product to its environment can be complex. In this paper we will focus on two facets of designing a complex product, the existence of multiple viewpoints and the need for multiple views for visualising a complex product.
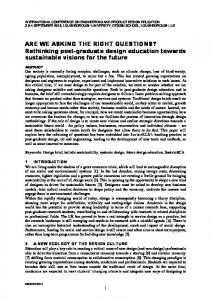
Multiple Viewpoints: In a company designing even simple products, many people are involved in the design process. Each designer comes form a different object world (Bucciarelli 1996) and has a different background and task focus and sees the product in a different way. Design managers also operate on a different level of abstraction from designers engaged in detailed design. As described in Eckert et al. (2004), even chief designers of a helicopter manufacturer admitted that they only understood roughly half of a helicopter in any degree of detail (see Figure 1 right). Other designers have an even more biased view on the product. They know only about their own task and those of the people they directly interact with. For example, a mechanical engineer might know a lot about stress engineering, but only have a vague understanding of avionics. In the famous caricature by Saul Steinberg, the “View of the World From 9th Avenue” (see Figure 1 left) a similar concept is shown. In this drawing, Manhattan is shown in very high detail, including single streets and buildings, while the rest of the USA (everything beyond the Hudson River) is reduced to landmarks like large cities (Chicago) or geographical objects (Rocky Mountains). The view of the world from any other city would look quite different. The idea of multiple viewpoints is best represented in information visualisation as fisheye views (Furnas 1986). The concept behind this theory is that everyone is mainly interested in the part of the environment directly surrounding them. The further away something is, the less attention and interest is spent. When visualising information with fisheye views, the user is able to set a viewpoint. The screen space is then assigned to the objects based on a “Degree of Interest”, assigning less space to less interesting ones. Product hierarchy
Company hierarchy
Helicopter
Chief Engineer
Versions
Deputy Chief Engineer
Main systems
System Head
Systems
Engineer
are part of / report to has an overview of
person with overview region of overview
other person
Figure 1 - Two concepts of different viewpoints: “View of the World From 9th Avenue” (left); Overview over a helicopter (right) (Eckert et al. 2004) Multiple Views: Multiple views are widely and successfully used for the visualisation of complex information (Unwin 1999), in software engineering (Meyers and Reiss 1992) and even in an engineering design context (Packham and Denham 2003). In the case of complex products, we argue that there are two reasons for using multiple views: • The amount of information in a complex product is too large to be displayed in one single graph. The information has to be broken down into smaller chunks that can be visualised and analysed much easier. Different graphs can show different information, revealing structure that cannot be shown in one diagram. Some representations are good for some purposes and not for others. A network diagram for instance is a very capable representation for most relational data. However, very dense graphs cause the problem of edge-crossings. For representing very dense graphs, the compact form of a Design Structure Matrix (DSM) is a much better display (Ghoniem et al. 2004). DSMs on the other hand do not show the structure of the network in an intuitive way, especially when indirect connections between components have to be assessed. • Different people involved in the design process have different viewpoints and demand different views on the product data. Potential customers demand different information than the designer responsible for the design of the Cylinder Head of an engine. For example in one case, a designer demanded the capability to ‘fade’ out all but one linkage type in a product model, as he wanted to see only the linkage type that had the biggest impact on his design. This concept is best described as overview. Tailored displays that are able to adapt the viewpoint of the particular user could be highly beneficial. However, hardly any tools exist in current design practice that offers such functionality.
CPM Tool The CPM tool is a software tool developed at the Engineering Design Centre in Cambridge (Clarkson et al. 2004). The core representation is the Design Structure Matrix (Browning 2001). The DSM interfaces have been refined using feedback from designers in two leading UK engineering companies. This User Centered Design approach (Brown 1996) of interviewing potential users to gather functional requirements promotes the development of optimised interfaces and visualisation techniques for the CPM tool. The interviews showed that designers are overwhelmed by the amount of information provided by a DSM. For efficient decision-making, they required a balance between detailed information and a global overview. The software tool supports risk assessment by drawing designers’ attention to components that are highly connected to other components and where changing any of these components would result in major rework on other, not necessarily directly connected components. We argue that proper visual representations and interfaces are the key for industrial acceptance of this software tool (for the impact of human-computer interfaces on design see Ligetti et al. (2003). Currently the CPM tool supports the design change process in two different ways. On the one hand it supports abstract product-model building. Systematically populating the corresponding product model in a multidisciplinary team increases awareness of the participants. It helps the individual designers as well as team leaders to understand how the components in their field of responsibility are connected to other parts of the products and where possible interfaces with other teams exist. With the software tool, information such as different linkage types and direct change impact and likelihood can be captured. The model building was carried out successfully in two UK companies, a diesel engine manufacturer and a gas turbine company. The second benefit of the CPM tool is that it provides a platform to analyse change propagation data, based on combined component connections. For that purpose, algorithms for calculating combined risk from direct impact and likelihood values were developed and integrated into the tool (Clarkson et al. 2004). This allows designers to quickly assess the probability of change propagating from one component to other components as well as the overall risk associated with a component change. The visualisation techniques described in this paper are designed to support this second case. Visualising Change Propagation The CPM tool incorporates a number of interactive linked views for visualising different facets of change propagation data. These include: • Matrix-based visualisations such as the Combined Risk Plot (see Figure 2, left) for assessing direct linkages and combined change-risks as well as building product linkage models; • Network displays for showing both direct and indirect links between components (see Figure 2, right); • Tree-based diagrams for showing propagation paths resulting in a change from one component; • Mechanisms to support sensitivity analyses of the product models, design freezes and component hierarchies. For a more detailed description of the different displays offered by the CPM tool and scenarios that are supported, see Jarratt et al. (2004) and Keller et al. (2005). These visualisation techniques support the designer in different stages of the design process, ranging from model building to the analysis of the data stored in such a model. Currently, the CPM tool is mainly used in industry for building product models.
Figure 2 – A Combined Risk plot shows combined change risks (left), a change network visualises change propagation paths (right). Usability Testing In order to ensure that the CPM tool is accepted in industry, the usability of the interfaces that are part of the CPM tool must be verified. In order to improve the usability of the CPM tool, we follow two approaches: One is a User Centered Design approach (Brown 1996) with close cooperation with our industrial partners. This involves interviews with potential users to gather requirements, group meetings where the current state of the software is presented and sessions where the tool is used in “real world” scenarios. The second approach is to do in-house testing of the visualisations. This includes controlled experiments that compare user-performance using different representations for a certain task. We especially focus on the differences between the two main representations incorporated into the software: DSMs and network-based displays. A comparison between these two representations used for model building revealed that the differences between both representations are only marginal; participants in the study assessed more links with DSMs but needed more time. However, we found that certain users have strong preferences. One experienced designer who participated in the study for instance mentioned: “Lets face it, a DSM is not a representation designers like using”. Future work will reveal whether one visual representation is best for analysing complex change propagation data. In a similar study, Ghoniem et al. (2004) discovered that matrix-based techniques are more suitable for showing relational data than networks, especially if the networks are very dense. We expect similar results for product networks, which tend to be very dense. These findings will be incorporated into the software tool so that the best possible visual representation is available for designers analysing change propagation data of complex products. Conclusion In this paper we introduced the concept of multiple viewpoints in the design of complex products. These are common in large and multidisciplinary design teams. Additionally, designers are not interested in parts of the product that have little or no impact on their area of responsibility. They demand a view on the product that is tailor-made and does not show an overwhelming amount of unnecessary information. The complexity of the underlying product is another reason why traditional means to visualise complex products are not sufficient. We introduced multiple and fisheye views as ways to tackle this problem and showed how the CPM tool incorporates such a strategy for visualising change propagation data. Finally, we showed how we ensure that the software is usable even for displaying complex products. References Brown, J. (1996). Methodologies for the Creation of Interactive Software. Technical Report CS-TR96/1. Wellington, New Zealand, Department of Computer Science, Victoria University of Wellington.
Browning, T. R. (2001). "Applying the Design Structure Matrix to System Decomposition and Integration Problems: A Review and new Directions." IEEE Transactions on Engineering Management 48(3): 292-306. Bucciarelli, L. L. (1996). Designing Engineers. Cambridge, MIT Press. Clarkson, P. J., C. Simons and C. M. Eckert (2004). "Predicting Change Propagation in Complex Design." ASME Journal of Mechanical Design 126(5): 765-797. Earl, C., J. Johnson and C. M. Eckert (2004). Complexity. Design Process Improvement. P. J. Clarkson and C. M. Eckert. London, Springer Verlag. Eckert, C. M., P. J. Clarkson and W. Zanker (2004). "Change and customisation in complex engineering domains." Research in Engineering Design 15(1): 1-21. Furnas, G. W. (1986). Generalized Fisheye Views. Proceedings of CHI '86, Boston, Massachusetts, USA. Ghoniem, M., J.-D. Fekete and P. Castagliola (2004). A Comparison of the Readability of Graphs Using Node-Link and Matrix-Based Representations. Proceedings of InfoVis 2004, Austin, Texas, USA. Jarratt, T., C. M. Eckert and P. J. Clarkson (2004). Development of a Product Model to Support Engineering Change Management. Proceedings of the TCME 2004, Lausanne, Switzerland. Jarratt, T., R. Keller, S. Nair, C. M. Eckert and P. J. Clarkson (2004). Visualization Techniques for Product Change and Product Modelling in Complex Design. Diagrammatic Representation and Inference. A. F. Blackwell, K. Marriott and A. Shimojima: 388-391. Keller, R., T. Eger, C. M. Eckert and P. J. Clarkson (2005, accepted for publication). Visualising Change Propagation. ICED '05. Melbourne, Australia. Ligetti, C., T. W. Simpson, M. Frecker, R. R. Barton and G. Stump (2003). "Assessing the Impact of Graphical Interfaces on Design Efficiency and Effectiveness." ASME Journal of Computing and Information Science in Engineering 3(2): 144-154. Meyers, S. and S. P. Reiss (1992). "An Empirical Study of Multiple-View Software Development." ACM SIGSOFT Software Engineering Notes 17(5): 47-57. Packham, I. S. J. and S. L. Denham (2003). Visualisation Methods for Supporting the Exploration of High Dimensional Problem Spaces in Engineering Design. International Conference on Coordinated Multiple Views in Exploratory Visualisation, London, UK, IEEE Computer Society. Unwin, A. R. (1999). "Requirements for Interactive Graphics Software for Exploratory Data Analysis." Computational Statistics 14: 7-22.