International Investments in the water sector: last decade evolution and way forward towards MDG. A.Jiménez1,2, A. Pérez-Foguet2 1. Ingeniería Sin Fronteras-Asociación para el Desarrollo (ISF-ApD) C/Cristóbal Bordiú, 19-21. 28006 Madrid, Spain. (http://www.isf.es)
[email protected]
2. Research Group in Development Co-operation and Human Development (GRECDH) Universitat Politècnica de Catalunya ETSECCPB, C/Jordi Girona s/n, Campus Nord, Barcelona, Spain. (http://www.upc.edu/grecdh)
[email protected]
ABSTRACT Effective allocation of investments is crucial to achieve the Water and Sanitation target of the Millennium Development Goals (MDG). The present paper exposes the main results of a detailed study made about the Official Development Assistance (ODA) and the international private investment in the water sector from 1995 to 2004. Public available data sets from the Development Assistance Committee (DAC), the World Bank, and from the Human Development Reports (population and water and sanitation access’ figures) have been collected in a specific database. ODA programmes have been analyzed individually, in order to separate water and sanitation subsectors, since DAC reporting system does not make it directly. The study includes a comparative analysis of public and private international investment; it analyzes the coherence, both geographical and sub sectorial of aid allocation, as well as the terms and conditions of the ODA delivered. Special focus was made on the sanitation subsector. Finally it assesses private participation success in the sector and evaluates cross cutting issues in ODA water programmes. Results of ODA’s analysis show how far donors lag behind their own commitments both in terms of quantity and quality of aid. Data show big geographical inequalities, comparing the share of aid received by regions related to the number of people without access living there. Regardless extremely low coverage in sanitation, donors are not really committed to improve it. Results from international private participation in water and sanitation projects show a little contribution to the achievement of the MDG, as well as a decrease tendency in participation. Complementarities between private and public sector were not significant, if MDG are to be achieved. As a main conclusion of the analysis, we can affirm that there is room for improvements in the water sector’s aid. A global coordination mechanism among donors is needed to ensure more efficient sector’s resources allocation; at the same time, donors should fulfil their own recommendations on terms and conditions of aid. International water and sanitation funds should add on existing national funds in order to effectively increase sector investment. Consideration of private sector’s investments could improve ODA’s allocations. The tiny amount of ODA resources dedicated to sanitation represents a huge contradiction with actual needs. 1. INTRODUCTION Effective allocation of investments is crucial to achieve the Water and Sanitation target of the Millennium Development Goals (MDG). As it has been pointed out in studies and reports, (Fay et al, 2005; UN, 2005) access to these basic services will be quite
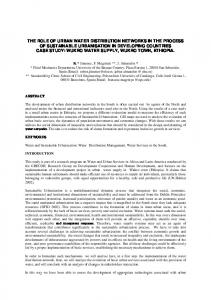
important to fulfil other health and poverty related MDG. Despite its importance, there has been a small increase of funds dedicated to this sector during the last decade with full data available (1995-2004). Annual investment in Water and Sanitation in developing countries amounted around 28,000 million dollars a year (including 14,000 for waste water treatment) during mid nineties (Briscoe, 1999; Global Water Partnership, 2000). The estimation of contributions coming from main agents was the following for that time (Camdessus, 2003): local public sector 65-70%; local private sector 5%; international donors (including NGO’s) 10-15%; and international private sector 10-15%. Nowadays, overall investment remains slightly under 30,000 million dollars a year, but actor’s share has changed. International donors and NGOs have increased their participation from around 3,900 MUSD to 5,500 MUSD a year (OECD, 2006); international private contribution has decreased from 3,700 million dollars average engagement in the late nineties down to less than 2,000 millions in the last four years (World Bank, 2006); and the contribution of local public sector must be considered as stationary at best, as many developing countries have adopted economic plans that limited public expenditure, sometimes as a requirement to receive international aid. Reducing infrastructure investments have been a normal mechanism to decrease public expenditure, while expecting the international private investment to cover it. This fact also explains the reduction of World Bank financial support for infrastructures in later years (World Bank, 2003). There has been an important growth on local private sector, up to 4,300 million dollars a year. The increase of relative local private sector financing is due to their share of participation in operation and maintenance, as well as to the lack of response from national governments to the demographic pressure, especially in large cities. The estimation of the evolution of sector financing is summarized in Figure 1. 100% 90% 80% 70% 60% 50% 40% 30% 20% 10% 0%
5%
15% Local private
65% 60%
Local Public International Private Multilateral Inst
13% 8% 10%
7% 6% 12%
1995
2005
Bilateral Aid &NGOs
Figure 1. Estimation of water sector financing in developing countries. Comparison between 1995 and 2005. Source: Own elaboration from collected data (cited in main text).
The future might see an increase in ODA share for the sector. The OECD has committed to raise the amounts destined to aid with respect to the 0.25% of GNI which was registered in 2005 (Gupta et al., 2006). In concert with that trend, the fifteen wealthier countries of EU have agreed to spend 0.51% of GNI in 2010, and 0.70% in 2015 (UN, 2005b). If commitments are fulfilled, ODA could triplicate for 2015. Furthermore, United Nations has declared the decade 2005-2015 “International Decade for Action: Water for Life” (UN, 2004). The Resolution states that the main goal of the Decade should be a greater focus on water-related issues at all levels and on the implementation of water-related programmes in order to achieve internationally agreed water-related goals. Hence, a considerable raise of ODA funds dedicated to water sector is to be expected. One important challenge in the sector will be to ensure that
international funds do not displace national investment. Since the biggest share of funds will be channelled through national governments, there is a risk that national governments reduce their own investments to benefit other politically prioritized sectors. Water funds should be somehow earmarked if total investment is to be increased. On the other hand, costs estimations to reach the Millennium Development Goals target for Water and Sanitation in 2015 present important differences, ranging from annual 9.000 to 30.000 million USD requirements (Toubkiss, 2006), and last estimates on countries advances towards them show discouraging results. 55 countries are off track for water target and 74 for sanitation (UNDP, 2006). With actual gaining access rate, Sub-Saharan Africa would meet water target in 2040 and sanitation target in 2076. Investment requirements to achieve the MDG for countries with low access to services range from at least 1% of GDP to more than 2% GDP (UN, 2005). Within this context it is undoubtedly clear that effective resources allocation is crucial to achieve the target, both from international donors and within each aid receiver country. General aid distribution patterns have been continuously monitored (Alesina & Dollar, 2000; Berthelemy & Tichit, 2002), relating them as well to MDG’s achievement (Baulch, 2006); results show that aid as a whole is still mainly politically driven. Meanwhile, specific sector’s studies from the aid receiving countries’ point of view have been made (Mehta et al, 2005), as well as continent’s specific analysis (Mwanza, 2003). The present study mixes both perspectives. It analyzes international contribution to the sector and relates it with the lack of services in each country. Section 2 shows how all data sources collected have been joined to analyse resources allocation. Evolution in the decade 1995 – 2004 is considered. Section 3 presents main results of the analysis done, which includes different general, geographical, subsectorial and cross-cutting issues. Section 4 highlights the improvement areas for the crucial forthcoming years. 2. METHODOLOGY A data base combining the public available information has been compiled using the following sources: - Creditor Reporting System (CRS), from the Organization for Economic Cooperation and Development (OECD), that includes all official ODA operations from the Development Assistance Committee (DAC) countries (OECD, 2007). - World Bank private participation in infrastructures database (World Bank, 2006). - United Nations Development Programme (UNDP) Database, where population data and water and sanitation indicators were extracted (UNDP, 2007). Des-aggregated economical information by project has been used (11,743 from CRS and 306 from World Bank database). This made possible a more complete analysis, as it will be shown. Individual donors’ behaviours were examined. Inclusion of both population and water and sanitation indicators in the database made possible a deeper analysis, such as those relating level of access and investments received. Despite being the most complete development action’s database, the CRS does not allow to separate directly the share of funds engaged to water from those dedicated to sanitation. Subsector’s description included in the CRS is provided in table 1.
CODE
DESCRIPTION 14010 Water resources policy & administrative management 14015 Water resources protection 14020 Water supply and sanitation -large systems 14030 Water supply and sanitation - small systems 14040 River development 14050 Waste management/disposal 14081 Education and training in water and sanitation Table 1. Creditor’s Reporting System (CRS) description of Water and Sanitation subsectors. Source: DAC (2002).
In order to separate ODA’s actions between water and sanitation, 14020 and 14030 codes should be further splitted. For our analysis, all programmes reported under these two codes were separated into three categories: Water, Sanitation and Mixed (water and sanitation together). In order to reclassify these programmes, we used the information provided on the short description of each of them. This enabled us to discover real efforts dedicated by donors both to water and sanitation, and makes possible the comparison with the private investment, as described in section 3.6. Besides, CRS include neither private transactions from countries that do not belong to the DAC nor private agencies donations, which do not inform their geographical distribution. Data is obtained through donor’s reports. On the other hand, World Bank database about private participation in infrastructures includes type of contract, amount of investments and main actors involved. Information is compiled through commercial databases, specialized publications, companies and multilateral organizations web resources. Total amounts are therefore estimative. Data refers to commitments, not disbursements, and include the whole investment foreseen, regardless if part of the investment is not private. Database is updated with the public information available about renegotiated contracts. 3. RESULTS AND DISCUSSION This section highlights and discusses the main results of the analysis, following these aspects: 3.1. Overall trends. 3.2. Terms and conditions of official aid compared to OECD recommendations. 3.3. Coordination among donors. 3.4. The attention to sanitation. 3.5. Integral approach of ODA financed water and sanitation projects. 3.6. Complementarities between public and private international investment. 3.7. Success of international private participation. 3.1. Overall trends Total ODA committed had an accumulated moderate increase during the decade (33%). Meanwhile, projects with private participation showed an irregular trend. With a spectacular rise at the end of the nineties, it starts a sharp decline after year 2001. Water sector accounted for 5 % of total ODA as well as 5 % of total private investment in infrastructures. ODA investments for water sector have been mainly descendant during the decade. Only an important increase from 2002 makes 2004 commitments the highest of the decade, but not for much (5,609 million dollars in 2004 compared to 5,435 in
1997). Accumulated commitments amounted to 46,360 million USD, with 27,870 from bilateral donors and 18,490 from multilateral institutions (figure 2).
TOTAL ODA
100,000
WATER SECTOR ODA 10,000
1,000
19 95 19 96 19 97 19 98 19 99 20 00 20 01 20 02 20 03 20 04
TOTAL INFRASTRUCTURE PROJECTS WITH PRIVATE PARTICIPATION TOTAL WATER AND SANITATION PROJECTS WITH PRIVATE PARTICIPATION
Figure 2. Evolution of ODA and private participation in infrastructure projects. Amounts in million dollars (2004). Source: Own elaboration from CRS and World Bank data.
Projects with private participation commitments amounted to 36,280 millions, but this figure does not reflect real private investment. As it has been explained, World Bank database includes the whole amount of the operation, regardless if other actors rather than private ones are involved. When including only the share of private participation foreseen in the operations, results show that private commitments amount to 26,841 MUSD, with 23,432 dedicated to infrastructure and the rest to purchase of licenses and administrative costs. Secondly, database is not updated when contracts change, unless renegotiation is made public. Given the fact that private participation has been rather conflictive (see detailed analysis in subsection 3.7), with 28% of the investment cancelled or under distress, it is reasonable to estimate real commitments around 18,000 MUSD for the decade. Additionally, most of the contracts are long term operations, up to 50 years, while ODA programmes rarely last more than 8 to 10 years. This is an important fact when considering real disbursements of both types of investors. 3.2. Terms and conditions of official aid compared to OECD recommendations The analysis of terms and conditions of aid delivered show important contradictions with donor’s own recommendations. Reported tied aid represented 9% of the transfers in the period. It is significant to recall that 16% of bilateral funds did not report about this aspect. This absence of reliable information about tied aid is surprising when specific agreements on its reduction have been taken long ago (DAC, 1987, 1992). From the whole aid engaged to the sector in the period, only 33.5 % were grants. Loans are examined through their “grant element”. This concept reflects the financial terms of a transaction: interest rate, maturity (interval to final repayment) and grace period (interval to first repayment of capital). It is a measure of the concessionality (softness) of a loan. It is calculated as the difference between the face value of a loan and the discounted present value of the service payments the borrower will make over the lifetime of the loan, expressed as a percentage of the face value (DAC, 2002). The reference rate of interest for calculating grant elements is set as 10%.
For the decade studied, there was a 62.12% of grant element, with 81.53% for bilateral transactions and 32.16% for multilateral ones. As a reference, DAC agreed to have an overall ODA grant element of at least 86%, increased to 90% for Least Developed Countries (DAC, 1978). Four of the five most important donors in the sector (Japan, Germany, European Union and France), amounting together 67.65% of bilateral aid, have very low concessionality rates, respectively, 72.89%, 87.93%, 70.55% and 65.70%. Of this top five, only USA provided a good grant element (100%). Loans given by multilateral banks at commercial terms do not have grant element; these amounted for 59.88% of all multilateral transfers during the period studied. The terms and conditions of aid committed are summarised in figure 3. WATER AND SANITATION OFFICIAL DEVELOPMENT ASSISTANCE: 4.636 MUSD/year BILATERAL DONORS(60%): 2.787 MUSD/year TIED (9%)
MULTILATERAL(40%): 1.849 MUSD/year NO REPORT(16%)
UNTIED OR PARTIALLY TIED (75%)
NOT REFUNDABLE: GRANTS (33,5%) GRANT ELEMENT (62 %)
REFUNDABLE: LOANS (66,5%) NOT CONCESSIONAL FUNDS (38%)
Figure 3. Terms and conditions of water sector’s ODA. Average from 1995-2004. Source: Own elaboration from collected data.
3.3. Coordination among donors Current donor’s efforts are focused on improving general aid efficiency, through alignment and coordination at national level in the aid recipient countries (EU, 2006). Nevertheless, up to date no coordination is taking place among donors to set priorities based on the needs of each region. As a result of that, politically important regions might receive more aid (regardless their level of service) while other more needed remain ignored. Regarding the water and sanitation sector, no correlation was found between the amount of aid received and the number of people without service living there. Figure 4 presents the percentage of investment per region in the period 1995-2004. Center-South Asia region (including India) hosts 45.19% of all people living without access to basic sanitation and 34.57% of all people without access to water, but it only received 14.87% of investments. Sub-Saharan Africa hosts 26.77% of people without access to water and 16.68% of those without sanitation, but commitments amounted to the 17.42%. East Asia (including China) received a more even treatment, hosting 28% of people without access to both services and receiving 23.99% of investments. On the side of the regions better treated by donors, we find America, that hosting only 5% of people without access, received 17.91% of investments; similarly, North Africa and Middle East that host less than 2% of world population living without access to water and sanitation but received around 10% of sector’s investment each.
50% 45% 40% 35% 30% 25% 20% 15% 10% 5% 0%
East Asia
Centremeridional Asia
North Africa
% WATER ODA
Sub-saharan Africa
America
% WITHOUT WATER
Middle East
Oceania
Europe
% WITHOUT SANITATION
Figure 4 . Share of ODA received in 1995-2004 compared with the share of people without access living in that region (access data from 2002). Source: Own elaboration from collected data.
3.4. The attention to sanitation World’s average access to water is estimated at 79% for water and 48% to sanitation (UNDP, 2007). In order to asses donors’ coherence to allocate funds within the sector, the share of funds that each donor dedicates to countries with less than 80% of access to water and less than 50% of access to sanitation has been examined. Definitive results have been found. If we look at access to water as criteria, the share of funds allocated to countries under world’s average access amount to 71.23% of all bilateral funds and 78.65% of multilateral. If we regard sanitation’s access as criteria, the share of funds allocated to countries below world average access descends to 36.88% of bilateral funds and 47.02% of multilateral. From the five most important donors in the sector, Japan and France dedicated their efforts to water, by allocating 77.48% and 77.45% of their funds to countries below access average. Germany dedicated 67.14% of funds to water deprived countries, and 35.75% to sanitation deprived. The European Commission, 56.96% to water, and 27.26% to sanitation, and the United States, 46.83% to water deprived and 2.92% to sanitation. None of bilateral donors dedicated more than 75% of their funds to sanitation deprived countries, and in all cases, water deprived countries received bigger share of funds than sanitation ones. From the three most important multilateral donors, the International Development Association (IDA) performed the best, by allocating 95.47% of funds to water deprived countries and 78.53% to sanitation deprived ones. 63% of ODA in the decade of study was dedicated to subsectors 14020 (water supply and sanitation-large systems) and 14030 (water supply and sanitation-small systems). Bilateral donors dedicated 75% of funds, and multilateral, 49%. If we deepen the analysis separating these subsectors in three categories (water, sanitation and mixed), as we explained in section 2, the results confirm the general overview. Figure 5 represents the five most important donors (covering 77% of total bilateral funds dedicated to the sector), and the share of funds engaged for each of the three mentioned categories. The rest of donors have been aggregated, as well as the multilateral aid.
100% 90% 80% 70% 60% 50% 40% 30% 20% 10% 0%
5% 20%
26%
12% 10%
27%
33% 23%
44%
23%
28%
11% 78% 62%
57%
38%
50%
46%
36%
45% 27%
EC
FRANCE
GERMANY
WATER
JAPAN
SAN
USA
REST OF DONORS
MULTI LATERAL
MIXED
Figure 5. Share of funds (from subsectors 14020 and 14030) dedicated by bilateral and multilateral donors to accessoriented water, sanitation or mixed (water and sanitation) projects. Source: own elaboration from public data, as explained in main text.
All of the bilateral donors (with the exception of Portugal and Sweden), and significantly the most important ones (figure 5) dedicated more funds to water-alone programmes than to sanitation-alone ones. Average investment from bilateral donors was 2.41 times more in water-alone projects than in sanitation-alone ones. Water-alone projects share (39,14%) was bigger than sanitation and mixed-water and sanitationshare together (36,21%). Multilateral donors revealed to be more equal, but the share of aid dedicated to these subsectors was significantly lower (49%). Globally, from the aid dedicated to subsectors 14020 and 14030, 43.13% was invested in water-alone projects, 26.50% in sanitation-alone ones, and 30.37% in mixed projects. 3.5. Integral approach of ODA financed projects By integral approach, we refer to the goals of gender equality, environmental orientation of actions, poverty focus, and good governance and participatory orientation, as defined by the Development Assistance Committee (DAC, 2000). Donors qualify as principal, significant or not considered the activity’s implication with each of the cross cutting issues mentioned. The results of the 11,743 projects analyzed are shown in table 2.
GENDER ENVIRONMENT POVERTY FOCUS PARTICIPATION
Principal or significant 11.77% 32.87% 9.59% 100.00%
Not considered 29.36% 10.60% 13.36% 0.00%
Not reported 58.87% 56.53% 77.05% 0.00%
Table 2. Share of funds dedicated and their score towards cross cutting issues. Source: Source: Own elaboration from collected data.
The most important result when analyzing these aspects is the lack of data provided by donors, impeding a reliable interpretation about them. This might occur as result of donors’ reluctance to report that these aspects have not been adequately considered; DAC definitions might be as well too vague, but these are only hypotheses. Gender was only reported as principal or significant in 11.77% of the cases, and environment in 32.87 %. Less than 10% of projects reported to be poverty focused, with 77.05% of projects not reporting about this aspect. In terms of participation aspect, it is to recall that not a single project reported it as principal, but all of them as significant. At any
case, these aspects seem to be ignored when reporting about the projects. DAC should insist on a more rigorous reporting from their members in these crucial aspects. 3.6. Complementarities between public and private international investments Regarding income level of aid recipient countries, the bilateral donors destined 44% of their resources to low income countries and 53% to medium income countries. Multilateral institutions dedicated 54% to low income countries and 45% to medium level income countries. 98% of the investment engaged by projects with private participation was destined to medium income countries, while Africa attracted only 0.95% of it. A display of these results by continents, representing the annual investment per person living in those regions, is given in figure 6. In Asia the joint contribution from public and private international sector is meaningful (many people without service receiving low rate of aid per capita, figure 4). Otherwise, public ODA contributed to raise (and sometimes co-financed) the private investment in Europe and America. As it has been said, the private sector was almost absent from Africa. 4 3.5
USD/ person and year
3 2.5 2 1.5 1 0.5 0 AFRICA
AMERICA ODA
ASIA
EUROPE
OCEANIA
PROJECT S WIT H PRIVAT E P ART ICIPAT ION
Figure 6. Public and private international investment per capita (water and sanitation) by continent. Average 1995 – 2004. Source: Own elaboration from collected data.
In terms of sub sector’s allocation, large water supply and sanitation systems received 56.32% of total ODA funds (bilateral and multilateral), followed by 17.16% for water resources policy and administrative management. Small water supply and sanitation systems received 13.13% of funds allocation. River development projects had great support at the end of nineties, but average in the decade is 6.06%. The rest of sub sectors (Water resources protection, waste management and disposal, education and training in water and sanitation) receive less than 4%, with a tiny 0.38% given to education and training. Compared to bilateral donors, multilateral institutions focused more on policy issues (25.05%) and paid very little attention to small systems (3.75%) and training (0.07%). The Millennium Declaration has boosted funds engaged for small systems (65% of funds for the sub sector were committed after 2000); however, investment for large systems remain above 50% both for multilateral and bilateral donors in the period 2000-2004, despite rural lack of services-71% for water and 40% to for sanitation compared to urban-95% and 85% respectively (UN, 2003). If we represent ODA subsector’s allocation (modifying it as explained in section 2) compared with private participated projects (figure 7), we observe each actor’s
contribution in terms of access-oriented projects (water access, sanitation and mixed projects). ODA funds engaged to these three categories amounted to 33,808 MUSD, while private participated ones summed 26,040 (discounting cancelled or under distressed investments, as explained in section 3.6). It must be considered that real private investment engaged was lower, since figures give total project costs (including also other participant’s contribution, such as multilateral institutions or national governments) and will be slowlier disbursed, since contract periods are much longer (up to 50 years) than ODA programmes (rarely longer than 8-10 years). Privately participated projects avoided sanitation-alone operations; thus, the greatest amount of private funds was dedicated to mixed projects that involved as well the more attractive water supply subsector. As a result of that, adding public and private investment gives mixed projects the first place (23,683 million), followed shortly by water (23,658 million USD), and doubling funds dedicated to sanitation-alone projects (11,011 million USD). 16,000 14,000 USD Millions
12,000 10,000 8,000 6,000 4,000 2,000 0 Policy &plan
WWRR ODA
Water access
San & Hyg
Mixed W&S
Waste Mgmt
River's Dvpt
PROJECT S WIT H PRIVAT E PART ICIPAT ION
Figure 7. Public and private international investment per subsector.(1995 – 2004), in USD million from 2003. Source: Own elaboration from collected data, as explained in main text.
In terms of size of the projects, there are big differences between public and private actors. 61.33% of private investment was oriented to 145 mixed projects (water and sanitation) with an average size of 153 million US dollars (MUSD); 31.20% to 102 water projects, with an average size of 111 MUSD, and 7.47% to 59 sanitation projects, with an average size of 46 MUSD. On the ODA side, 3167 large operations (code 14020) and 3503 small ones (code 14030) were reported, with an average size of 8.24 MUSD and 1.74 MUSD respectively. 3.7. Success of international private participation At the time of this study, 37 projects with international private participation, amounting 10,143 MUSD were cancelled or under distress, e.g., 28% of investment engaged in the decade. In regional trends, the most significant cases are East Asia, with 16.98% of projects and 31.41% of the investment (4,856 MUSD) in this situation, and Latin America and Caribbean region, with 12% of projects and 32.17% of investment (5,278 MUSD) cancelled or under distress. Data show that big concession projects were the most conflictive, especially in the water supply sub sector (17% of projects cancelled or under distress), as shown in figure 8.
40.00% 35.00% 30.00% 25.00% 20.00% 15.00% 10.00% 5.00% 0.00% Water
Mixed
%Cancelled or under distress projects
Sanitation
% Investment cancelled or under distress
Figure 8. Cancelled or under distress private participated projects in water sector (1995-2004 period). Source: Source: Own elaboration from World Bank data.
4. CONCLUSIONS The effective allocation of investments is vital if the Millennium Development Goal’s (MDG) target for Water and Sanitation wants to be achieved. The study about 19952004 decade shows interesting and discouraging results about international participation in water and sanitation projects. One important remark has to do with reporting systems. Private and public investments are not easily comparable, since aspects as geographical regionalization and sub sector divisions are not coherent among them. It is worth to recall that CRS divides access oriented projects just in “large” or “small”, and does not make distinction between water and sanitation subsectors. Results of ODA analysis show how far donors lag behind their own commitments both in terms of quantity and quality of aid delivered to the sector. In terms of quantity, during the 2000-2004 period donors and multilateral institutions only committed 50 MUSD/year more as in the 1995-1999 period, despite the Millennium Declaration. Data show big geographical inequalities, comparing the share of aid received by regions related to the number of people without access living there, evidencing lack of coordination among donors to set priorities. Individual analysis did not show better results. Some of the most important donors of the sector (Japan, European Commission, Germany and France) score a very low performance against aid’s terms and conditions. When looking at sub sector’s allocation, the great part of funds was dedicated to large systems, both by multilateral and bilateral donors. In this last case, it is not reasonable, provided the lack of access that rural population suffers and the theoretical poverty orientation of ODA. Regardless extremely low coverage in sanitation, none of bilateral donors dedicated more than 75% of their funds to sanitation deprived countries, and in all cases, water deprived countries received bigger share of funds than sanitation ones. Average investment from bilateral donors was 2.41 times more in water-alone projects than in sanitation-alone ones. Water-alone projects share (39,14%) was bigger than sanitation and mixed-water and sanitation- share together (36,21%). Creditor Reporting System (CRS), though complete as database, is not being filled rigorously by donors. Crucial aspects in development programmes, such as gender, beneficiaries participation, and environmental and poverty focus orientations are widely overlooked and frequently absent from reports.
International private participation in water and sanitation projects show a little contribution to the achievement of the MDG: 98% of investment was dedicated either to medium or high income countries and mostly oriented to mixed projects over 100 MUSD each; meanwhile, Africa attracted only 0.95% of the investment in the period. At the same time, private participation has been rather conflictive and shows a decrease tendency, with 28% of the investment engaged during the decade cancelled or under distress. Little complementarities were found between international public and private investment, from the point of view of the people without access, since biggest aggregated investment per capita was destined to America, Europe and Oceania, the continents with less un-served people. As a result of the analysis made, we can affirm that aid was insufficient, of low quality and bad targeted, both geographically and sectorially. Quantity commitments until 2015 are already agreed from most of OECD donors. Current efforts and debates are focused on improving general aid efficiency, through alignment and coordination at national level in the recipient countries. But the water MDG needs a wider approach: a global coordination mechanism among donors to ensure needs-based resources allocation is urged, and donors must fulfil their own recommendations on terms and conditions of aid. International water and sanitation funds should add on existing national funds in order to effectively increase sector investment, preventing national governments from shifting their own funds to other sectors. It is ODA mission to fight poverty, thus a greater focus should be put on deprived areas (rural) and subsectors. The tiny amount of ODA resources dedicated to sanitation represents a huge contradiction with actual needs.
ACKNOLEDGMENTS The author/s would like to extend thanks to Dr. Samuel Carpintero (Universidad Politécnica de Madrid) for supervising the MSc Thesis that initiated this work. Special thanks are also given to Gonzalo Marín for his continuous advice. Support from Ingeniería Sin Fronteras-ApD, Civil Engineering School (Universitat Politècnica de Catalunya) and Agencia Catalana de Cooperación is gratefully acknowledged. REFERENCES Allesina, A., & Dollar D. (2000). “Who gives foreign aid to whom and why?“. Journal of Economic Growth 5; 33-63. Baulch, B. (2006). “Aid Distribution and the MDGs”. World Development Vol. 34, No. 6, pp. 933–950. Berthelemy, J.C., & Tichit, A. (2002). Bilateral Donors’ aid allocation decisions: discussion paper 2002/123. World Institute for Development Economics Research Briscoe, J. (1999). “The financing of hydropower, irrigation, and water supply infrastructure in developing countries”. International Journal of Water Resources Development, Vol 15, no. 4. 459-491
Camdessus, M. (2003). Financing Water for All. Report of the World Panel on Financing Water Infrastructure. 3rd World Water Forum. 16-23 March 2003, Kyoto. Development Assistance Committee (1978). “Recommendation on Terms and Conditions of Aid” in Reporting Directives for the Creditor Reporting System, publication number DCD/DAC(2002)21, Development Assistance Committee, Directorate for Co-operation and Development, OECD. Development Assistance Committee (1987). “DAC Guiding Principles for Associated Financing and Tied and Partially Untied Official Development Assistance”, in Reporting Directives for the Creditor Reporting System, publication number DCD/DAC(2002)21, Development Assistance Committee, Directorate for Co-operation and Development, OECD. Development Assistance Committee (1992). “New Measures in the Field of Tied Aid. Development Assistance Committee”, in Reporting Directives for the Creditor Reporting System, publication number DCD/DAC(2002)21, Development Assistance Committee, Directorate for Co-operation and Development, OECD. Development Assistance Committee (2000). DAC statistical reporting directives, publication number OECD/DAC(2000)10, Development Assistance Committee, Directorate for Co-operation and Development, OECD. Development Assistance Committee (2002). DAC guidelines on poverty reduction, publication number DCD/CAD(2001)3/FINAL, Development Assistance Committee, Directorate for Co-operation and Development, OECD. European Union (2006). European Consensus on Development. Official Journal of European Union, 24.02.2006. Fay, M., Leipziger, D.,Wodon, Q., & Yepes, T. (2005). “Achieving Child-HealthRelated Millennium Development Goals: The Role of Infrastructure”. World Development Vol. 33, No. 8, pp. 1267–1284. Global Water Partnership (2000). Towards Water Security: A Framework for Action. Presented at the 2nd World Water Forum, La Hague, 2000. Gupta, s., Pattillo, C., & Wagh, S. (2006). Are Donor Countries giving more or less Aid?. International Monetary Fund, Working Paper 06/01. Mehta, M., Fugelsnes, T., & Virjee, K. (2005). ”Financing the Millennium Development Goals for Water and Sanitation: What Will it Take?”. International Journal of Water Resources Development, Vol. 21, No. 2, 239–252. Mwanza, D. D. (2003).”Water for sustainable development in Africa”. Environment, Development and Sustainability 5: 95-115, 2003. Organization for Economic Cooperation and Development (2007). Development Statistic portal: http:// www.oecd.org/dac/stats/idsonline Last visit August 2007.
Toubkiss, J. (2006). Costing MDG Target 10 on Water Supply and Sanitation: Comparative Analysis, Obstacles and Recommendations, 3rd World Water Forum, México 2006. United Nations, (2003). Indicators for Monitoring the Millennium Development Goals. Publication number ST/ESA/STAT/SER.F/95. United Nations. New York United Nations (2004). “United Nations declaration 58/217”. 9th February 2004. United Nations (2005). Health, Dignity, and Development. What will it take? Millennium Project, United Nations, New York. United Nations (2005b). “Press Note: SG/SM/9888 DEV/2513”. 25th May 2005. United Nations Development Program (2006). Human Development Report, 2006. Beyond scarcity: Power, poverty and the global water crisis. United Nations Development Programme. 1 UN Plaza, New York, New York, 10017, USA United Nations Development Program http://hdr.undp.org/. Last visit, August 2007.
(2007).
Statistics
by
World Bank (2003). Infrastructure Action Plan, World Bank, Washington DC World Bank (2006). http://ppi.worldbank.org. Last visit, December 2006.
country.