INTERNATIONAL JOURNAL OF BUILT ENVIRONMENT AND SUSTAINABILITY Published by Faculty of Built Environment, Universiti Teknologi Malaysia
Website: http://www.ijbes.utm.my IJBES 3(1)/2016, 45-52
An Approach to assess the Urban Management Performance of Municipalities in Sri Lanka Gayani Ranasinghe*, Susantha Amarawickrama, Emeshi Warusavitharane Department of Town and Country Planning, Faculty of Architecture, University of Moratuwa, Katubadda, Sri Lanka. *Email:
[email protected]
History: Received: 6 December 2015 Accepted: 15 January 2016 Available Online: 30 January 2016 Keywords: Urban Management, Performance of Municipalities, Full Permutation Polygon Synthetic Indicator Method DOI: 10.11113/ijbes.v3.n1.109
1.
ABSTRACT Urbanization tends bring out a number of problems, such as inadequate housing and urban services, increase land prices and construction costs, propagation of slums, pollution and deterioration of the urban environment. Currently, spatial development activities focusing on major cities of Sri Lanka are demanding urban infrastructure and services where municipalities are facing challenges on provision of the infrastructure and proper urban management too. This study seeks to identify the relevant criteria, indicators and a method for assessing the urban management performance of municipalities in Sri Lanka since specific measurement criteria and related indicators are not yet identified to evaluate urban management by the central government or local government levels. Based on Literature review, five criteria and 25 indicators were selected considering their applicability for the context of Sri Lanka. The Full Permutation Polygon Synthetic Indicator Method (FPPSI) was applied to synthesize indicators and the Synthetic indicator has been used to show the performance of each criterion in terms of urban service delivery. Colombo Municipal Council (CMC), Sri Jayawardenapura Kotte Municipal Council (SJKMC) and Moratuwa Municipal Council (MMC) have been selected as the case studies for this research. Although selected cases are within Colombo Metropolitan Region, none of the municipalities were achieved the “High” or “Very High” level of synthetic indicator (SR>= 0.50) that shows the standard of municipal service delivery of Sri Lanka as a whole. This research lays the platform to evaluate the functional performance of Municipal Councils to guide the future scenario and to make decisions at the grass root level for managing the urbanization related issues in the country. Also this research helps the government to know the current trends of development impact and to take necessary policy level decisions to guide the economic growth in a correct direction with the political manifestoes.
Introduction
Many authors have defined the process of urbanization in different ways and analyzed the urban management of both developing and developed countries. With the existing trend, developing countries face accelerated development and it’s significant in South Asian context. Sri Lanka is one of the fastest growing nations in SAARC region. Current on-going development projects and spatial development focusing on cities such as Hambantota, Trincomalee, Colombo are demanding urban infrastructure and services where municipalities are facing challenges on provision of the infrastructure and its management aspect. Hence this study seeks to identify the relevant criteria, indicators and a method for assessing the urban management performance of municipalities in Sri Lanka and apply them in to three selected municipalities in Sri Lanka. There are number of criteria has been used by many professionals for assessing the urban management. However in Sri Lanka, there is no a specific criteria and indicators used to evaluate urban management by the central government or local government levels. The responsibility on urban management will not only lie upon central government, but on the bottom level organizations such as Municipal Councils, Urban Councils and Pradeshiya Sabhas. There are several key issues to
undertake such performance criteria such as lack of reliable and realistic data, lack of co-ordination between physical planning and financial planning authorities, division of powers and functions of urban management among central government and local governments and passing of responsibilities among different governmental agencies. In terms of Municipal Councils, the powers and functions have been clearly delegated from the laws, but poor management and lack of attention on performance evaluation is evident among such bodies.
2.
Theoretical Background
2.1.
Urbanization and Urban Management
It is suggested that from a city manager’s perspective, urban management in developing countries must achieve two things. First, it must understand the nature of the urban environment it is dealing with. Secondly, it must organize the instruments of intervention in such a way that the institutions conducting urban management are in a fit state, organizationally and financially to do so (McGill, 2001). Thus, 45
urban management in developing countries is concerned both city building with its insatiable need for infrastructure and services and council building with its seemingly endless need for increased capacity to perform (McGill, 1995). Urban management is therefore considered to be conceptually holistic in its approach to towns and cities in developing countries. At its core, this study requires that urban issues and institutional responses be considered simultaneously to ensure integrated structure of urban management. The urbanization related issues and the urban management approach of a developing country will vary with a developed country. Kotter (2008) argue that in developed countries, urbanization has mainly taken place in the second half of the 19th century. Developing countries are now in the middle of their urban growth. In Europe already 72% of the population lives in urban areas (UN, 2006). The urbanization process has come to stand still and a process of dis-urbanization and suburbanization caused by a high rate of motorization combined with prosperity and the development of traffic and communication infrastructure are noticeable. But in developing countries, high birthrate combined with an increasing migration from the rural areas is reinforced by the so called push-factors of unemployment, low standards of housing and infrastructure, lack of educational facilities and pull-factors of economic opportunities, attractive jobs, better education and modern lifestyle. 2.3.
Urban Management in Sri Lanka
The historical livelihood pattern of Sri Lanka used to be an agrarian economy, so the urbanization is quite controversial with the traditional livelihood pattern. Sri Lanka is a fast developing country with urbanization trend by growing urban centers as it named ‘Cities are engines of economic growth’ (Asian Development Bank, 2010). According to Census data in year 2012, about 15.2% of the population of Sri Lanka lives in urban areas with an annual urbanization rate of 1.36%. However, with the restoration of peace in the country after War situation in year 2004, urban development trends would change and effective urban management practices to be adopted across the whole country to avoid the problems associated with urbanization in Sri Lanka. There are 51 cities in Sri Lanka having population over 50,000 and 16 cities which are located in the Colombo Metropolitan Region of the Western Province have over 100,000 population, 3 cities have between 100,000 and 500,000 population and one (Colombo) over 650,000 population (ADB, 2010). Based on Census data (2001), the total estimated population of these 51 cities is over 5,740,000 about 63.7% of the total urban population of Sri Lanka. In this context, there are several government organizations responsible for managing the urban development in Sri Lanka. Urban Development Authority (UDA) which is established under the parliament act No 41 in 1978 is the prime organization for managing the development of urban areas in Sri Lanka. But UDA is an organization which guides the urban development where the management and maintenance of actions are directly handled by local authorities. In this scenario Municipal Councils (MC), Urban Councils (UC) and Pradeshiya Sabhas (PS) are managing the development of respective areas with the legal provisions on the development process under the Municipal Council Ordinance (No. 29 of 1947), Urban Council Ordinance (No. of 1940) and Pradeshiya Sabha Act (No of 1987). Accordingly the respective local authorities are responsible in providing basic facilities on public health, public utility services, public thoroughfares, socio-economic development, environmental protection, and ensure the comfort, convenience and welfare of the people in the area.
2.4.
Assessment of Urban Management
Performance of the urban management will be assessed through multi criteria, which provide a relevant and meaningful summary of the conditions of interest. Furthermore, for the satisfaction of the wider community, they must be transparent, testable, and easily understandable and scientifically sound (Moussiopoulos et. al, 2010). Indicators are necessary to demonstrate the selected criteria. An indicator is also a measure, gauge, barometer, index, mark, sign, signal, and guide to, standard, touchstone, yardstick, benchmark, criterion and point of reference (Fraser,et.al,2006). Indicators can provide crucial guidance for decision making, by translating the collected data into manageable units of information. As an outcome of literature review, ten list of criteria and related indicators which were developed and applied by international organizations and in research studies were identified. They are urban indicators checklist (C01) (Mc.Gill, 2001), urban sustainability indicators for Thessaloniki, Greece(C02) (Moussiopoulos, et. al,2010) ,indicators for urban land use planning and management in Thies-Senegal and Geneva-Switzerland (C03) (Repetti, 2005),sustainable urban indicator identification for participatory process & environmental management (C04) (Frazer, 2005), Millennium development goals and urban indicators guidelines (C05) (UN, 2004), developing urban indicators for managing mega cities (C06) (Kotter, 2007), delivering effective urban management (C07) (Shanghai Manual, 2011),Urban management criteria in Malaysia (C08) (Muhammad, 2000) , Key performance urban indicators for divisional Secretariat divisions in Sri Lanka(C09) (Ministry of Finance, 2009) and Urban governance: an essential determinant of city development (C10) (Lange, F.E., 2009). Table 01 shows identified criteria, indicators, remarks and related reference number. The Millennium Development Goals which were established under the Millennium Summit of the United Nations (2000) contain indicators to monitor the progress of eight goals to attain corresponding targets.There are 20 key indicators, 09 checklists (to assess the areas that cannot easily be measured quantitatively) and 13 extensive indicators (to complement the results of the key indicators and qualitative data) to assess the urban management with the point of view of urban agglomeration. McGill (2001) shows that infrastructure development and institutional development should need to be taken in to account when consider on urban management and its role. The Infrastructure development consists with network infrastructure, formal sector development, informal sector development, buildings, basic services and financing. The Institutional development consists with integration, decentralization, sustainability, organizational development, financial development policy and budgetary development. Moussiopoulos et. al, (2010) develop a criterion to assess the urban management of urban area based on sustainable development. The selected criterion is based on the sectors of economy & population, land use & urban planning, energy, transportation, agriculture, livestock & fishery, industry, tourism, air pollution & climate change, water resources & sea environment, solid waste, bio diversity, health, education and research & technology.
3.
Methodology
The overall list of criteria and related indicators that were identified from literature review has been short listed as indicated in table 01 by conducting perception surveys considering their applicability in the context of Sri Lankan Municipalities. Perception surveys were conducted with ten officers of selected three municipal councils and ten officers who engage in urban planning and urban management related 46
activities in Sri Lanka. Five new indicators which are more suitable to evaluate each criterion also were identified through the perception survey. They are percentage of voters’ turnover during last election, percentage of people under poverty line, percentage of unemployment out of total labor force, filed court cases from Dengue inspection, and number of Community Based Organizations (CBO) registered under MC. The data collection for each indicator was based on latest data available within each local authority and other missing data was obtained from latest research documents and reports. Full Permutation Polygon Synthetic Indicator (FPPSI) method has been used to analyze the performance level of each Municipal Council under each criterion and related set of indicators.
3.1.
Full Permutation Polygon Synthetic Indicator (FPPSI) Method
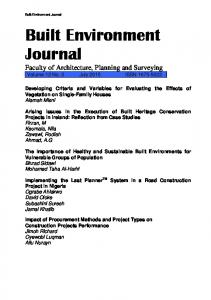
Wu et al. (2005) developed the Full Permutation Polygon Synthetic Indicator (FPPSI) method to synthesize indicators and evaluate the comprehensive level. In the FPPSI method, an n-sided polygon (Figure 2) is created to represent the theoretical maximum values of each of n indicators, with the radius at each vertex (the distance from the center of the polygon) defined by the upper limits of the standardized value for each indicator. Thus, there are aggregately (n−1)!/2 n-sided polygons.
Table 1: Final List of performance criteria and indicators Criteria
1.Standardiz ation of Service Delivery
Selected Indicators and Reference number Percentage of real time service delivery given as online services (C02,C09) Time period taken for CoC, Building permits to be passed / processed (C02,C10) Citizen satisfaction on municipal services (C04,C05,C06,C07,C09) Percentage of budgetary allocation for social welfare (C05,C06,C08,C09) Percentage of Voters Turnover during last Election* Housing deficit(C01,C05,C06,C07,C08, C09) Percentage of families have proper sanitation facilities (C01,C02,C05,C06,C07, C08,C09)
2.Housing & Amenities
Percentage of families have permanent shelter (C01,C05,C06,C07, C08,C09) Percentage of open areas availability (from total land use activities) (C02,C03,C04,C07, C08) Percentage of people under poverty line* Percentage of unemployment out of total labor force* Percentage of passed CoCs or building applications from total applications (C09,C10)
3.Obligation of the Law & Order
Percentage of encroached population (C01, C06, C09) Percentage of crime activities reported (C01,C04,C05,C06,C08,C09) Filed court cases from Dengue inspection* Percentage of people reported with vector borne diseases (C02,C05,C08,C09) Mortality rate (both maternal and infant) (C02,C04,C05, C08,C09)
4.Health Care & Social Wellbeing
No. of pre-schools operated by MC (C01,C03,C04 ,C09) No. of Community Based Organizations (CBO) registered under MC * Frequency of maintaining public parks (C02,C04,C05, C08,C09) Percentage of solid waste recycling and composting (based on composition) (C01, C02,C04,C05, C06, C07, C08,C09) Percentage of paved road network out of class "E" roads (C01,C03,C06, C08)
5.Physical Infrastructure facilities
Frequency of maintaining the drainage (C01,C02,C06, C08) Percentage of families have access to safe drinking water (C01,C04,C05, C06, C07, C08,C09) Percentage of families have access to electricity (C01, C02,C05, C06, C07, C08,C09)
Remarks Calculation of number of services offered by respective Municipal Council and target should be 100% The international standards and local situation was studied and maximum limit was derived through professional interview. Primary data (sample survey) based data collection and maximum was taken as 100% The total percentage of expenditure for the social projects by MC out of allocation from the budget has been taken. The maximum of 100% (spending of total allocation) was the target. The results based on Provincial Council Elections in 2014 were taken. The target was the total number of voters eligible for voting should vote in the elections. Difference between the total housing stock and total households were taken for data collection. The target was taken as the total number of households should have a house with proper materials & infrastructure. Deducted the families have ‘no toilets’, ‘common toilets’ and ‘shared with another’ categories out of the Census, 2012. The target was taken as the proper sanitation should be available for every family. Based on Census of 2012, categories of ‘twin houses’, ‘line rooms’, ‘shanties’& ‘other’ was deducted from the total housing stock. Target was the families who have permanent shelter to be 100%. The standard used by UDA is that the open areas within Colombo Metropolitan area should be 1ha. Per 1000 persons. For other areas, it is 1.4ha per 1000 persons. This was the target for each Municipality. “Samurdhi” recipients within each municipality were taken for the demonstration of the indicator. The target was set as to be no Samurdhi recipients or number of families does not receive Samurdhi subsidy scheme should be 100%. This has been amended as to be the employed population out of total labor force should be the maximum. The government policy (MahindaChinthana) has been targeted this to be 98% within Western Province. The total number of applications for the Certificate of Conformity or building permits within a year was considered here. The passed percentage by first instance was targeted to be 100%. Encroached families to the government properties, reservations and other illegal households were considered here. The target was reverted as the legally living families to be 100%. Reported crimes within a period of one year were considered and target was reverted as to be the crimeless population as 100%. The ratio between legal actions and identified positive Dengue breeding locations were considered here. The legal actions properties should be minimum or houses with Dengue preventive measures should be 100%. The indicator reverted as the people without vector borne diseases to be 100% out of total For the infant mortality, the indicator was taken by deducting the deaths under 01 years of age from the total infant population. The target was set by taking the inverse of targeted infant mortality rate. Maternal mortality indicator was calculated by reducing the maternal deaths during pregnancy and child delivery from the total pregnancy population for normalized value of 100,000. The Municipal Council operated pre-school availability within each GN Division was taken into consideration. The standard was kept as that each GN Division within Municipality should have at least one preschool. The registered CBO’s with DS division of each municipality was taken into consideration here. The standard was kept as that each GN Division within Municipality should have at least one CBO in operation which was taken from the literature review and professional interviews The frequency was taken as the daily cleaning service with allocated laborers by the respective MC. Due to non-availability of reliable data, the calculation was taken from the percentage of solid waste collection by MC out of total generation within each day. With central government initiative “MagaNeguma”, each Municipality has allocated road improvement projects. So the indicator was taken as the number of road projects completed within MC out of total allocated projects per year. The frequency was taken as the daily cleaning service with allocated laborers by the respective MC. The data collected for the families with protected wells and pipe borne water supply within governing area based on Census, 2012. The target was taken from the government target of 99% within Western Province. The data collection was based on the households with electricity as the principal source of lighting within Municipality based on Census report of 2012. The target of 100% was set by government policy initiative, “MahindaChinthana”.
47
(xi = T). Inside the inner polygon, the values of the standardized indicators are less than their thresholds and are negative; outside the inner polygon, the values are greater than their threshold values and are positive. The n indicators can form (n - 1)! different polygons containing n! triangles. In all these triangles, the number of different triangles is n (n -1), and the total area of all these different triangles can be calculated as follows:
(Equation 4) Where,Si represents indicator i, and (Si +1) represents the distance from the endpoint of indicator i to the central point. The standardization interval is [-1, +1].
Figure 1: Full Permutation Polygon The synthetic indicator is defined as the mean of the ratios of the area of any n-sided polygon to the area of the polygon defined using a normalized value of 1.0 for each indicator.
Thus, the sum of (n - 1)! areas of the polygons is:
(Equation 1) Where F(x) meets the following conditions:
(Equation 5) The areas of the (n -1)! regular outer polygons (with a side length equal to 2 units) can be calculated as:
Where U, L, and T represent the upper limit, the lower limit, and the threshold for parameter X respectively. Thus: (Equation 6) Thus, the value of FPPSI is obtained by calculating the following ratio: (Equation 2) When x (L,U), F(x) has the following characters: (1) F(x) has significance, that is, it has no singular value in its domain; (2) F(x) ≥ 0 (3) When x (T,U), F”(x)0 (4) When x (L,T), F”(x) 0
The equation can then be standardized for each indicator:
(Equation 3) Si Ui Li Xi Ti
= = = = =
Standardized indicator value Upper value of the existing value Lower value of the existing value Present value of the indicator Target value for the indicator
An outer regular n-sided polygon can be formed by n indicators, where n vertices represent the instance of Si = 1; the central point represents Si = -1; and the radius from each vertex to the central point represents the value of the corresponding standardized indicator. An inner polygon that lies midway between the outer polygon and the center of the polygon represents the threshold values of the indicators, where Si = 0
(Equation 7) S Si Sj n
= = = =
Synthetic indicator value Minimum value of the standardized value Maximum value of the standardized value Number of indicators
Where S is the value of the synthetic indicator, which represents the sum of the values for all indicators at a lower layer in the hierarchy and it can be standardized to account for the immediately higher layer in the hierarchy. For the application of FPPSI method, the collected data has to be converted in to equitable form for evaluation. Therefore the indicator list has been amended to denote the target values to be the maximum level being 100% of achievement gives best (or maximum) level of success where 0% gives lowest success. But in some cases, it is the opposite where, the encroached families should be 0% for the best achievement by local authority and population with access to safe drinking water should be 100% for the highest level of achievement by local authority. For FPPSI calculation, the maximum and minimum limits of the indicator should be the same as they are considered together in same format. So for the indicators those target should be 0% have been reverted the opposite way for the calculation purpose. 48
For an example targeted encroached families of LA area should be 0% and it was reverted as targeted non-encroached families of LA area should be 100%. Percentage of encroached population, housing deficit, percentage of people under poverty line, percentage of crime activities reported, filed court cases from Dengue inspection, percentage of people reported with vector borne diseases and Mortality rate have been reverted based on the above principle and percentage of budgetary allocation for social welfare, percentage of solid waste recycling and composting and percentage of paved road network out of class "E" roads have been amended depending on the availability of data and information in the Municipal Council Level. Based on Full Permutation Polygon Synthetic Indicator values (Wu et al, 2005), as well as values in national and international standards (Li, F. et al.,2009), the following qualitative classification of four performance level was identified (Table 2).
3.2.
Case Studies
Western Province can be identified as the fastest growing region in Sri Lanka and as the center for trade and economic agglomeration. MCs in Western Province have been largely influenced by the development initiatives and assigned with many responsibilities and functions in terms of urban management since many urbanization related issues are common. Therefore, it is essential to measure the urban management performance and to identify the development trends of the region with its maturity level of economic agglomeration. In this background, three MCs in Western Province, namely Colombo Municipal Council (CMC), Sri Jayawardenapura Kotte Municipal Council (SJKMC) and Moratuwa Municipal Council (MMC) were selected as the case studies for this study. CMC is the largest local authority in Sri Lanka and one of the oldest in South Asia, established in 1865. According to the census data in year 2011, it has grown into a large organization catering to the needs of resident population of 555,031 and floating population of nearly 500,000 (estimated). SJKMC area is highly urbanized due to some factors like being a main administrative capital and locating parliament complex. It has become highly populated with the developed road network and infrastructure facilities. MMC is highly urbanized due to the impact of industrialization which took place in Colombo during the 1970s. MMC forms part of the Ratmalana industrial area, which has a wide variety of modern industries providing employment for the population of its hinterland areas.
4.
Analysis and Discussion
Each indictor under each criterion was standardized by calculating standardized indicator value applying above equation 01, 02 and 03. The identified upper limit (Ui) and the lower limit (Li) values of each indicator, existing value that relevant to each indicator and Table 2: Qualitative evaluation for the Synthetic indicator vales Level 1 2 3 4
Full Permutation Polygon Synthetic Indicator values > 0.75 0.50–0.75 0.25–0.50 < 0.25
Qualitative evaluation Very High High Moderate Low
Source: Li, F. et al. (2009) Measurement indicators and an evaluation approach for assessing urban sustainable development: A case study for China's Jining City.
customized targets values (Ti) were substituted to equation 03 to calculate standardized indicator value. Table 3 shows the calculated standardized indicator values for all 25 indicators under five criteria. Full Permutation Polygon Synthetic Indicator values were calculated for each criterion representing the sum of the all standardized indicator values. The Full Permutation Polygon Synthetic Indicator values of each criterion have assessed performance level of municipal service delivery and management. Average value of all FPPSI values of five criteria and its related qualitative measure can be used to have an idea about the overall performance level of municipality if all criteria are considered as equally important. Although selected three MCs are located within Colombo Metropolitan Region, none of them were achieved the “High” or “Very High” level of synthetic indicator (SR>= 0.50) that shows the standard of the performance of municipal service delivery of Sri Lanka as a whole. The services related to Health care and social wellbeing and housing and amenities show moderate performance level being other sectors as low performance level.Three MCs do not achieve a considerable success in the service delivery phase. Therefore they should consider on the improvements on the field. CMC should more focus on the social welfare programs and to reduce the voters’ turnover while MMC and SJKMC required to more focusing on online services and gaining the trust of the people in terms of the services. CMC has achieved 19% of performance level in providing housing and amenities while MMC and SJKMC valued as 28% and 29% respectively. So CMC is still in the “Low” stage where MMC and SJKMC have been achieved into “Moderate” level. The main improvement indicators or sectors for CMC are the sanitation of people and permanent shelter. CMC has the highest population density in Western Province which increases the demand for the land due to high population attraction. Land values are eventually high and that leads to scarcity of land for the habitation. This resulted in permanent shelter related issues as well as issues related to health and sanitation within the Municipality. MMC has not sufficient open spaces for the people and the unemployment rate is comparatively high. SJKMC has the issue with open spaces due to increasing urbanization. All three (03) municipalities show low performance level in providing and managing services on obligation of law and order. CMC falls into the worst situation (0%) being MMC as 10.8% and SJKMC as 2%. The main reason behind this is the land encroachment or illegal occupation of land by violating the rules and regulations. Out of total population of CMC, approximately 51% are living in underserved settlements in government reservations, river or railway reservations without having basic infrastructure for living (Census Report, 2011). This has caused for the crimes and spread over of diseases such as Dengue, Malaria within the city limits. Capacity improvement of the administration and physical planning interventions are needed for upgrading the obligation level of people on law & order. MMC has the comparatively low level of encroachers and crimes hen compare to other two MCs but the Bolgoda Lake which is a boundary of municipality has certain encroachment issues. SJKMC is also has encroachment problem but the loop holes in legal and administration system has drawbacks on municipal service delivery as well. CMC has achieved 32% of moderate performance level in providing and managing services on health care and social wellbeing while MMC and SJKMC valued as 12% and 18% respectively. MMC has to improve on the social infrastructure such as preschools, CBO service gain. CMC has the majority of healthcare service providers including private sector contribution which has to be a limiting factor for MMC. Under physical infrastructure provision, CMC and SJKMC have 2% of low performance 49
Table 3: Standardized indicator values of 25 indicators of related 5 criteria for three Municipal Councils Criteria
1.Standardi zation of Service Delivery
2. Housing and Amenities
3. Obligation of Law & Order
Indicators
S(CMC)
S(MMC)
S(SJKMC)
0.00 -1.00 -1.00
-0.94 -0.38 -1.00
-1.00 -0.72 -1.01
-1.00
1.00
1.00
-1.00
-0.88
-0.97
0.00
0.65
0.10
-1.00
0.21
0.08
0.42
0.40
0.15
0.00
-1.00
-1.00
0.06
-0.72
0.39
0.00
0.57
0.79
-0.87
-0.41
-0.98
-0.91
0.08
-0.85
0.07
0.01
0.99
-0.98
-1.00
-1.00
Percentage of healthy people Infant living percentage Maternal living percentage No. of pre-schools operated by MC Percentage of CBO distribution upon number of GN Divisions
1.00 -0.66 -1.00 0.00
1.00 -0.62 -0.71 -1.00
1.00 -0.44 -0.44 -1.00
0.00
-1.00
0.00
Daily maintenance of public parks
1.00
0.00
0.00
-1.00
-1.00
-1.00
-1.00
0.00
-1.00
0.00
-1.00
0.00
-0.63
-0.15
-0.48
-1.00
-1.00
-1.00
Online Service Delivery Time period for CoC/ BP to be passed Citizen satisfaction on municipal services Percentage of social expenses over allocation Percentage of Voting Population out of eligible Percentage of households have dedicated house Percentage of families have proper sanitation facilities Percentage of families have permanent shelter Percentage of open areas availability Percentage of families above the poverty line Percentage employment out of total labor force Passed CoC percentage from total applied Percentage of legal (non-encroached) residents from total families Percentage of Crimeless people from total population Dengue Prevention controlling from total detected areas
4. Health Care and Social Wellbeing
5. Physical Infrastructure Facilities
Percentage of solid waste collection out of total generation Number of road projects completed out of total allocated per year (2012) Frequency of maintaining the drainage Percentage of households with access to safe drinking water Percentage of families with access to electricity
level being Moratuwa as 0%. Physical infrastructure provision has been a responsibility of central government as well as the local government which may be a reason for achieving lower values for every municipality. Also lack of attention on infrastructure improvement and corruption issues are other reasons behind this. MMC has the poor records in road and drainage maintenance. The monitoring mechanism for the maintenance work should be strengthened in MMC and the attention should follow to the sufficient resource provision for each sector to provide frequent service for the people. The private sector participation is being
Comparison of Standardized Indicator Values of three MCs
utilized for CMC and SJKMC which should be a trend for municipal infrastructure provision as well as the maintenance.
5.
Conclusion
Based on the results, it is obvious that municipal council services in Sri Lanka have not been up to the standards expected. FPPSI method has been proved as a rational indicator to assess the performance of urban management. This method is useful for scenario building and analyzing development trends based on predicted values for each indicator for making crucial decisions.In practical situation, it is impossible to foresee the future scenario especially due to political instability. The 50
Table 4: Full Permutation Polygon Synthetic Indicator values & their Qualitative Evaluation Criteria Standardization of Service Delivery
FPPSI (CMC) 0
0%
Low
FPPSI (MMC) 0.0141
1%
Low
Low
0.1892 Low
Moderate
Moderate
Obligation of Law & Order
0.0083 0% Low 0.3201 32%
0.1080 11% Low 0.1190 12%
0.0201 2% Low 0.1844 18%
Moderate
Low
Low
0.0156 Low
2%
0.2796
0%
Housing and Amenities
Health Care and Social Wellbeing Physical Infrastructure Facilities
19%
FPPSI (SJKMC) 0.0029
0 Low
28%
0%
0.2872
0.0216
29%
2%
Low
government policies will be changed and the action projects will vary in terms of the politician’s agenda. The trend of urban service delivery will be fluctuated if there are any policy level changes affected. Due to nonavailability of similar research findings in Sri Lanka, the basic understanding on urban management and assessment of its performance was assessed based on studies done in international context. Some of the criteria were eliminated due to non-availability of data even in the Municipal level while some of the data and information has errors in collection and verification. Poor co-ordination among other divisions of MC and the limited data availability in soft versions are identified as limitations which created unnecessary delays in collection and compilation of data and information. This study can be further developed to refine the perfect model for assessing the performance level of urban management by adapting the external forces (positive and negative) in to the municipal service delivery. (i.e.: Impact of mega infrastructure projects such as expressway construction, relocation of underserved settlers and any other nationally and regionally important projects). Acknowledgements This research was funded through the Senate Research Fund (Grant Number SRC/ST/2013/04) of University of Moratuwa. References Asian Development Bank, (2010). City Cluster Economic Development Sri Lanka Case Study. Manila, Philippines. Central Bank of Sri Lanka, (2012). Economic and Social Statistics of Sri Lanka.Statistics Department, Colombo. Colombo Divisional Secretariat,(2011). Statistical Information, Available from: http://www.colombo.ds.gov.lk/index.php? optioncom_content&view,article&id45&Itemid,57&langen Colombo Municipal Council, official web site. Available from: www.cmc.lk. [20 April 2014]. Department of Census and Statistics. (2004). Poverty Statistics/ Indicators for Sri Lanka. Available from: http://www.statistics.gov.lk.
Department of Census and Statistics. (2005). Preliminary Statistics of the Census of Population and Buildings of the Census Blocks Affected by the Tsunami – 2004: Colombo District. Available from: http:// www.statistics.gov.lk. Department of Census and Statistics. (2005). Selected Millennium Development Goals (MDG) Indicators for Sri Lanka, Colombo 07. Available from: http://www.statistics.gov.lk. Department of Census and Statistics. (2008). MDG Indicators of Sri Lanka: A mid Term Review–2008, Colombo. Available from: http:// www.statistics.gov.lk. Department of Census and Statistics. (2012). Sri Lanka Labour Force Survey: Annual Report -2012, Ministry of Finance and Planning, Available from: http://www.statistics.gov.lk. District Secretariat. (2012). Performance and Financial report-2012, Colombo. Divisional Secretariat. (2013). Resource Profile 2012, Colombo. Divisional Secretariat. (2014). Resource Profile 2013, Colombo. Divisional Secretariat. (2013). Resource Profile 2012,Moratuwa. Divisional Secretariat. Jayawardenepura Kotte.
(2013).
Resource
Profile
2012,
Sri
Divisional Secretariat. Jayawardenepura Kotte.
(2012).
Resource
Profile
2011,
Sri
Divisional Secretariat. 2012,Thimbirigasyaya.
(2013).
Resource
Profile
Fraser, E.D.G., Dougill, A.J., Mabee, W.E., Reed, M. &McAlpine, P. (2006). ‘Bottom up and top down: Analysis of participatory processes for sustainability indicator identification as a pathway to community empowerment and sustainable environmental management’, Journal of Environmental Management, vol. 78, pp. 114–127. Kötter, T. and Friesecke, F. (2008). Developing urban Indicators for Managing Mega Cities, Institute of Geodesy and Geo information, University of Bonn, Germany. Li, F., Liu, X., Hu, D., Wang, R., Yang, W., Li, D. & Zhao, D. (2009). ‘Measurement indicators and an evaluation approach for assessing urban sustainable development: A case study for China’s Jining City’, Landscape and Urban Planning, vol. 90, pp. 134–142. Lange, F.E. (2009). Urban governance and city development - linking the urban governance index and city development index, Department of Geography, University of Bonn. McGill, R. (1995). Urban management performance: An assessment framework for Third World city managers, Cities, Vol. 12, No. 5, pp. 337-351. Elsevier Science Ltd, Britain. McGill, R. (2001). Urban Management Checklist, Cities, Vol. 15, No. 6, pp. 463–471. Elsevier Science Ltd, Britain. Ministry of Finance and Planning, Sri Lanka (2009). Annual Report Moratuwa Divisional Secretariat. (2011). Statistical Information, Available from: http://www.moratuwa.ds.gov.lk/index.php? optioncom_content&viewarticle&id45&Itemid57&langen. 51
Moussiopoulos, N., Achillas, C., Vlachokostas, C., Spyridi, D. & Nikolaou, K. (2010). ‘Environmental, social and economic information management for the evaluation of sustainability in urban areas: A system of indicators for Thessaloniki, Greece’, Cities, vol. 27, pp. 377–384. Repetti, A. & Desthieux, G. (2006). ‘A Relational Indicator set Model for urban land-use planning and management: Methodological approach and application in two case studies’, Landscape and Urban Planning, Vol. 77, pp. 196–215. Elsevier Science Ltd.. Sri Jayawardenepura Kotte Divisional Secretariat. (2011). Statistical Information, Available from:http://kotte.ds.gov.lk/index.php? optioncom_content&viewarticle&id45&Itemid=57&langen. UN–Habitat Sustainable Cities Programme. (2002). City Profile of Moratuwa Municipal Council. UN–Habitat Sustainable Cities Programme. (2003). City Profile of Sri Jayawardenapura Kotte Municipal Council. United Nations Population Division (2006) World Urbanization Prospects: The 2005 Revision. New York United Nations Human Settlements Programme. (2004). Urban Indicators Guidelines: Monitoring the Habitat Agenda and the Millennium Development Goals, UN Habitat, Nairobi, Kenya. United Nations (2007). Indicators of Sustainable Development: Guidelines and Methodologies, United Nations, New York. United Nations (2010). Shanghai Manual: A guide for sustainable urban development of the 21st century United Nations. (2012). United Nations Development Assistance Framework 2013-2017, Colombo. United Nations Development Programme. (2012). Sri Lanka Human Development Report-2012, UNDP, Colombo. Urban Development Authority. (2005). Development Plan for Moratuwa Municipal Council Area. Urban Development Authority. (2008). City of Colombo Development Plan (Amendment) 2008.
Wu, Q., Wang, R.S., Li, H.Q., Xu, X.B., (2005). The indices and the evaluation method of eco-city. Acta Ecol. Sin. 25, 2090–2095 (in Chinese).
52