that the impact of trade liberalization on income distribution is only conditional on factor ... by a specific definition of the factor content of net export changes.
No 2005 – 17 October
International Trade and Income Distribution: Reconsidering the Evidence _____________
Isabelle Bensidoun, Sébastien Jean & Aude Sztulman
International Trade and Income Distribution: Reconsidering the Evidence _____________
Isabelle Bensidoun, Sébastien Jean & Aude Sztulman
No 2005 – 17 October
International Trade and Income Distribution: Reconsidering the Evidence
TABLE OF CONTENTS
SUMMARY ..............................................................................................................................4 ABSTRACT ..............................................................................................................................6 RÉSUMÉ .................................................................................................................................7 RÉSUMÉ COURT .....................................................................................................................9 1. BACKGROUND AND MOTIVATION ..................................................................................10 2. A MODEL OF OPENNESS AND INEQUALITY ....................................................................16 2.1. Relating net export changes to factor price changes in a general setup................16 2.2. Implications in a three-factor model......................................................................18 2.3. Link with income inequality..................................................................................20 3. EMPIRICAL APPROACH ..................................................................................................22 4. EMPIRICAL EVIDENCE ...................................................................................................26 5. CONCLUDING REMARKS ................................................................................................33 REFERENCES........................................................................................................................35 APPENDIX 1: RERUNNING SPILIMBERGO ET AL. (1999) ESTIMATION ...............................38 APPENDIX 2: GINI INDEX AS A FUNCTION OF RELATIVE WAGES ........................................40
3
CEPII, Working Paper No. 2005-17
INTERNATIONAL TRADE AND INCOME DISTRIBUTION: RECONSIDERING THE EVIDENCE
SUMMARY Whether trade liberalization is associated with narrowing or widening income disparities within countries is still a matter of controversy. According to the standard factor proportions theory, openness should exert an equalizing effect in poor countries and raise income inequality in rich countries (if the skilled to unskilled relative wage is to be considered as a good proxy for income inequality). But this prediction is not systematically borne out by the data. While increased trade openness in several East Asian economies paralleled lowered inequalities, it is well documented that Latin American countries experienced a deterioration of their income distribution following liberalization. The publication in 1996 of a comprehensive data set on income inequality paved the way for more systematic empirical investigations than previously. However, the studies failed to deliver a convincing answer as to the link between openness and inequality. Empirical results are mixed: depending upon the sample, the econometric method or the estimation period, it is shown that openness has either no impact on inequality, or has an equalizing effect, or worsens the income distribution. In addition, the conclusions do not fit the underlying theoretical models. This study reconsiders the evidence concerning the influence of international trade on income distribution, motivated by serious concerns about data consistency, empirical specification, as well as theoretical framework. The theoretical model used as a background for the analysis is fairly general and mainly based on the assumption of general equilibrium under perfect competition on product and factor markets. The number of goods and factors is not specified and no assumption is made about the rest of the world. In particular, we do not make the restrictive assumption that the impact of trade liberalization on income distribution is only conditional on factor endowments. The model shows that factor price changes are correlated with an indicator of the factor content of net export changes, relative to the country factor endowments. In order to derive from this model a testable relationship between foreign trade and income inequality, we then restrict the model to the case where three production factors are considered, namely two types of labor (non-educated workers and other workers), in addition to physical capital. Non-educated workers are assumed to be employed only in the non-tradable sector, because producing goods well suited for the export sector requires matching relatively high standards of quality, which call for a certain level of skill. We then show that the change in income distribution is related to the change in the factor content of net exports, relative to the country’s factor endowments. This relationship, which is the base for subsequent econometric estimates, turns out to be conditional on the share of households drawing their income from non-educated labor. 4
International Trade and Income Distribution: Reconsidering the Evidence
The empirical implementation acknowledges country specificities in production technologies, and puts special emphasis on data consistency requirements for inequality index. Our estimations concern the impact of international trade change on the change in income distribution, instead of the relationship in levels generally estimated in the literature so far. Indeed, the interesting issue is not whether countries with different degrees of openness exhibit different levels of inequality, but rather whether an increase in a country’s trade openness is associated with an increase or a decrease of inequality. Our main empirical finding is that the factor content of net export changes, expressed relatively to the country's factor endowment, does have a significant impact on income distribution and the sign of this impact is conditional on country’s income level or on the share of non-educated in the population over 15. An increase in the labor content (relatively to capital) of exports thus decrease inequalities for rich enough countries (or countries with high enough education level), but it will increase inequalities in the poorest countries. Indeed, such increased exports are likely to be reflected in higher wages, but this only concerns workers endowed with the basic education required to be employed in the exportoriented manufacturing sector. While such workers, with at least basic education, represent the bulk of low-income households in many countries, this is not the case for countries where education is scarce. Moreover, the resulting impact of international integration on inequality depends on the sign and magnitude of the factor content of net export changes. On average, the factorcontent of trade increased in poor countries (i.e. with a PPP GDP per capita approximately below $5,000) and decreased in middle-income and rich countries, thus resulting in both cases in a widening of income inequality. When middle- and high-income countries are considered separately (by arbitrarily setting $15,000 PPP GDP per capita as the cut point between these two categories), the impact of trade is still found to be increased inequalities in rich countries, but the reverse is true for middle-income countries. It is worth emphasizing that our results are to be interpreted with caution, as our analysis does not look for a systematic impact of trade liberalization on income distribution. The change in the factor content of trade is not only related to trade policies but also to technology or consumer taste changes. The interpretation is more suited the other way round: trade liberalization is likely to affect the factor content of net exports, and this is the indicator to look at in order to gain valuable insights about the induced impact on income distribution. This shows that the way trade liberalization is handled may have significant repercussions for income distribution. While inequalities are better tackled with direct policy instruments, in particular fiscal redistribution, in poor countries the implementation of such policies is far from being an easy task. Our results also recalls the vital role of basic education, which is often a necessary condition for workers to benefit, directly or indirectly, from the gains associated with new trade opportunities.
5
CEPII, Working Paper No. 2005-17
ABSTRACT This paper reconsiders the evidence concerning the influence of international trade on income distribution. Our analysis is based on a theoretical model which does not make any restrictive assumption about how trade specialization is linked to factor endowments. In this framework, the influence of international trade changes on income distribution is captured by a specific definition of the factor content of net export changes. Our main empirical finding is that the factor content of net export changes, expressed relatively to the country's factor endowment, does have a significant impact on income distribution, but the sign and magnitude of this impact is conditional on country’s income level or on the share of noneducated in the population.
Classification JEL: F11, F16, D30 Keywords: International trade; Income distribution.
6
International Trade and Income Distribution: Reconsidering the Evidence
UN REEXAMEN DU LIEN ENTRE COMMERCE INTERNATIONAL ET DISTRIBUTION DES REVENUS
RÉSUMÉ L’impact de la libéralisation commerciale sur la distribution des revenus reste un sujet controversé. Selon la théorie factorielle des échanges, l'ouverture devrait réduire les inégalités dans les pays pauvres et les augmenter dans les pays riches (en supposant que le salaire relatif des qualifiés par rapport aux non-qualifiés constitue une approximation satisfaisante des inégalités de revenus). Mais cette prédiction n'est pas toujours cohérente avec les évolutions observées. Alors que l'ouverture commerciale s'est accompagnée dans plusieurs pays est-asiatiques d'un déclin des inégalités, les pays d'Amérique latine ont pour leur part connu une aggravation de leurs inégalités de revenus parallèlement aux épisodes de libéralisation récents. La publication en 1996 d'une base de données internationales sur les inégalités de revenus a rendu possible des études empiriques plus systématiques. Cependant ces études n'ont pas réussi à apporter une réponse définitive quant au lien entre ouverture et inégalités. Les résultats empiriques sont très contrastés, variant selon l'échantillon étudié, la méthode économétrique et la période d'estimation retenues. De surcroît les conclusions sont rarement cohérentes avec les modèles théoriques sous-jacents. Cette étude réexamine le lien entre commerce international et distribution des revenus, en tentant de répondre aux problèmes qui nous semblent importants dans les études existantes, que ce soit en termes de cohérence des données sur les inégalités, de spécification empirique ou de support théorique. Le modèle théorique utilisé ici se fonde principalement sur l'hypothèse d'équilibre général en concurrence parfaite sur les marchés des biens et des facteurs. Le nombre de biens et de facteurs n'est pas spécifié et aucune hypothèse n'est faite sur le reste du monde. En particulier, nous ne supposons pas que l'impact de la libéralisation commerciale sur la distribution des revenus est conditionnel aux dotations factorielles. Pour dériver de ce modèle une relation testable entre commerce extérieur et inégalités de revenus, nous restreignons ensuite le cadre d'analyse au cas où trois facteurs de production sont considérés, le capital et deux types de travail (travailleurs sans aucune éducation et autres travailleurs). Les travailleurs sans aucune éducation sont supposés n'être employés que dans le secteur non-échangeable parce que la production de biens adaptés à l'exportation requiert la satisfaction de normes relativement élevées de qualité, nécessitant un certain niveau de qualification. Nous montrons alors que l'évolution des inégalités de revenus est liée aux changements dans le contenu en facteurs des exportations nettes, exprimée relativement aux dotations factorielles du pays. Cette relation, qui est la base des estimations économétriques réalisées ensuite, s'avère être conditionnelle à la part des ménages tirant leur revenu du travail non-éduqué. 7
CEPII, Working Paper No. 2005-17
Au niveau empirique, une attention particulière a été portée à la prise en compte des différences de techniques de production entre les pays, à la construction d’une base de données cohérente sur les inégalités et à la manière d’appréhender le lien entre commerce et inégalités. Sur ce dernier aspect, la question n’est pas d'étudier si les inégalités sont plus ou moins élévées selon le niveau d’ouverture des pays mais bien de déterminer si un accroissement de l’ouverture commerciale dans un pays se traduit par un accroissement ou une réduction de ses inégalités. Pour le dire autrement, il s’agit d’estimer cette relation en variation et non pas en niveau comme c’est souvent le cas dans la littérature. Notre résultat principal est que le contenu en facteurs de l'évolution des exportations nettes (exprimé relativement aux dotations factorielles) a un impact significatif sur la distribution des revenus. Le signe de cet impact dépend du niveau de revenu du pays considéré ou de la part des non-éduqués dans la population. Un accroissement du contenu en travail (relativement au capital) des exportations nettes est à l’origine d’un accroissement des inégalités dans les pays les plus pauvres (ou disposant d’une part élévée de non-éduqués dans la population) et d’une réduction des inégalités dans les pays riches. En effet, seuls les travailleurs ayant le niveau d’éducation nécessaire pour être employés dans le secteur exportateur pourront bénéficier de l’accroissement des salaires lié au développement des exportations manufacturières intensives en travail. Ainsi, dans les pays où la plupart des ménages à bas revenus ne dispose pas d’un niveau d’éducation de base, l’effet d’un accroissement du contenu en travail (relativement au capital) des exportations nettes se traduit par un élargissement de la distribution des revenus. Pour apprécier l’impact que le commerce a eu in fine sur les inégalités de revenus, il est par ailleurs nécessaire de prendre en compte la manière dont les contenus en facteurs des exportations nettes ont évolué. En moyenne le contenu en travail relativement au capital du commerce s’est accru dans les pays pauvres (ceux dont le PIB par tête en PPA est inférieur à 5 000 dollars) et a diminué dans les pays riches et à revenu intermédiaire. En conséquence, le commerce s’est accompagné, dans les deux cas, d’un accroissement des inégalités. Toutefois, si l'on considère séparément les pays à revenu intermédiaire et les pays riches (en fixant arbitrairement 15 000 dollars comme seuil de PIB par tête en PPA), on constate alors qu’en moyenne le commerce s’est traduit par une réduction des inégalités dans les pays à revenu intermédiaire. Ces résultats doivent être interprétés avec prudence dans la mesure où notre analyse ne permet pas d’évaluer l'impact, sur la distribution des revenus, de la libéralisation commerciale au sens strict. En effet, l'évolution du contenu en facteurs des échanges ne dépend pas seulement des politiques commerciales mais résulte aussi des changements dans les technologies ou les goûts des consommateurs. Toutefois, la façon dont la libéralisation commerciale est menée peut avoir des répercussions fortes sur les inégalités dans la mesure où l’évolution du contenu en facteurs des échanges est affectée par la politique commerciale.
8
International Trade and Income Distribution: Reconsidering the Evidence
La réponse habituellement envisagée face aux effets inégalitaires de la libéralisation commerciale, à savoir la mise en place de mécanismes de transfert, peut s’avérer particulièrement délicate dans les pays pauvres. Nos résultats montrent que dans ces pays l’accent doit être mis sur l’éducation de base afin que les travailleurs bénéficient des gains, directs ou indirects, induits par les nouvelles opportunités commerciales.
RÉSUMÉ COURT Ce papier réexamine l'influence du commerce international sur la distribution des revenus. Notre analyse se fonde sur un modèle théorique qui ne fait aucune hypothèse restrictive quant au lien entre spécialisation commerciale et dotations factorielles. Dans ce cadre, l'influence des évolutions du commerce international sur la distribution des revenus peut être caractérisée par une définition spécifique du contenu en facteurs de l'évolution des exportations nettes. Notre principal résultat empirique est que ce contenu en facteurs de l'évolution des exportations nettes, exprimé relativement aux dotations factorielles du pays, a un impact significatif sur la distribution des revenus. Mais le signe et l'ampleur de cet impact sont conditionnels au niveau de revenu du pays ou à la part des non-éduqués dans la population.
Classement JEL : Mots Clés :
F11, F16, D30 Commerce international ; distribution des revenus.
9
CEPII, Working Paper No. 2005-17
INTERNATIONAL TRADE AND INCOME DISTRIBUTION: RECONSIDERING THE EVIDENCE 1
Isabelle Bensidoun, Sébastien Jean & Aude Sztulman
1.
BACKGROUND AND MOTIVATION
Whether trade liberalization is associated with narrowing or widening income disparities within countries is still a matter of controversy. According to the Heckscher-OhlinSamuelson (HOS) theoretical framework (with two types of labor), poor countries tend to specialize in unskill-intensive goods, because they are relatively well endowed with unskilled labor. As a result, openness should exert an equalizing effect in poor countries, 2 and raise income inequality in rich countries. But this prediction is not systematically borne out by the data. While increased trade openness in several East Asian economies paralleled lowered inequalities, it is well documented that Latin American countries experienced a widening of their income distribution following liberalization (see e.g. Wood and Ridao-Cano, 1999). Evidence on the impact of trade liberalization on inequality has until recently been seriously hindered by data limitations. However, the publication in 1996 by K. Deininger and L. Squire of a comprehensive data set on income inequality paved the way for more systematic empirical investigations. Roughly speaking, studies can be divided into two categories. The first approach consists of simply evaluating whether openness reduces or strengthens inequality. The corresponding works generally do not rely explicitly on a given theoretical framework. Rather, the HOS theory is referred to in order to justify the test for different effects in developed and developing countries. Results are mixed. Depending upon the sample, the econometric method or the estimation period, it is shown that openness has either no impact on inequality, or has an equalizing effect, or worsens the income distribution (see Table 1).
1
Isabelle Bensidoun & Sébastien Jean (CEPII); Aude Sztulman (EURIsCO, Université Paris Dauphine). We are grateful to Peter K. Schott, Klaus Deininger and Thai-Tahn Dang for kindly providing us with data. The paper has been much improved thanks to comments and suggestions from Ann Harrison, Hervé Boulhol, Branko Milanovic and Adrian Wood, to whom we are very grateful. We also thank the participants in the CEPII and EURIsCO seminars as well as those at the Wider Jubilee Conference (17-18 June 2005, Helsinki) for their helpful comments. Correspondence: isabelle.bensidoun @ cae.pm.gouv.fr & isabelle.bensidoun @ cepii.fr . 2
For more than two production factors, the theoretical prediction is less clear.
10
International Trade and Income Distribution: Reconsidering the Evidence
Table 1: The impact of openness on inequality across recent studies References Edwards, S. (1997) Savvides, A. (1998) Lundberg, M., Squire, L. (1999)
Econometric specification Gini changes
Inequality data consistency Not mentioned
Gini changes1
Not mentioned
LDCs
Panel on gini levels
Adjusted gini index to the level it would be, were it calculated on an individual-weighted expenditure basis
All countries
Gini levels
Not mentioned
Pooled gini levels 2
Dummies for gross income versus net income or expenditure based data and individual versus household data Only “household-based income distribution” mentioned
Calderon C., Chong, A. (2001)
Panel on gini levels
Milanovic, B. (2002)
Income deciles levels
Spilimbergo, A., Londono, J.L., Székely, M. (1999) Fischer, R.D. (2001)
Pooled gini levels
Panel on gini levels
Negative
Null Developed and developing Developed
0 impact on income growth among the middle 60% and wealthiest 40% of households
Income classes growth rates
Chakrabarti, A. (2000) Barro, R. J.(2000)
Positive
All countries All countries Countries with PPP GDPpc < $13000
Industrial Poor countries
“Within any given countr inequality is measured consistently by using eith expenditure or income” “Minimal requirement of consistency and quality” which we interpret as meaning that the high quality database is used and no more is done about data consistency
Openness alone Educ.*open
Openness alone Land*open
Countries with PPP GDPpc > $13000
All countries Developing Rich & middle-income countries Land*open Capital*open
Capital*open
OR3 Educ*open
Notes: 1 The openness variable is not introduced in change but at the initial date. 2 If the econometric specification includes fixed country effects, the impact of openness is still positive if all countries are considered but there is no longer an effect of openness on inequality if the interaction between GDP per capita and openness is entered. 3 When Educ*open is introduced in the equation, Openness and Land*open are no longer significant.
11
CEPII, Working Paper No. 2005-17
The second set of studies is more in line with international trade theory, in the sense that a country’s relative factor endowment is set to be a determinant of the impact of trade openness on inequality. Bourguignon and Morrisson (1990), Spilimbergo et al. (1999) and Fisher (2001) are examples of this approach. While the theoretical ground used by Spilimbergo et al. (1999) is close to the one proposed by Bourguignon and Morrisson (1990), i.e. basically the HOS framework, Fisher (2001) bases his empirical work on the dynamic specific factors model of Eaton (1987). Fisher’s motivation to renounce to HOS is that this theoretical approach is inconsistent with the fact that trade liberalization affects LDC’s differentially. 3
The empirical implementation is rather close in the two recent articles mentioned above (Fisher and Spilimbergo et al.): relative factor endowments, openness and interaction term between openness and relative factor abundance are the main explanatory variables of inequality. Regarding results, in both cases 1) openness leads to more inequality; 2) trade effects undo the direct effects of endowments (i.e. interaction coefficients have an opposite sign compared to direct effects); and 3) data do not fit the theoretical models. On this last point, Spilimbergo et al. emphasize that opposite signs on endowments and trade effects of endowments is in contradiction with the HO framework. Fisher’s results are neither in accordance with the underlying model once other factors, like human capital, are introduced. Furthermore, two drawbacks are worth mentioning. The first one has to do with the consistency of data on inequality. Due to data limitations, Gini coefficients based on different income definitions (income/expenditure, gross/net…) and different recipient units (individual/household…) are used, as in most cross-country studies on inequality. Even when some adjustment is done to improve data comparability, these differences result in serious data inconsistency, as shown by Knowles (2001) about the link between growth and inequality. The second drawback concerns the econometric specification adopted in Spilimbergo et al. work, which is expressed in levels instead of changes in inequality. Trying to explain cross-country differences in levels of inequality is a challenging task, since a number of idiosyncratic factors cannot be properly taken into account. Fiscal redistribution, labor market devices or distribution of factor ownership, for instance, are not well documented for most countries. As a consequence, econometric estimates are likely to be flawed with omitted variable bias. In addition, the interesting issue from a policy perspective is not whether countries with different degrees of openness exhibit different levels of inequality, but rather whether an increase in a country’s trade openness is associated with an increase or a decrease in inequality. Even from a theoretical perspective, the predictions from the HOS framework do not refer to cross-country comparison of levels of inequality, but rather to their changes as countries open up to trade.
3
As the study of Bourguignon and Morrisson was done in 1990, the set of data used presents various limitations due in particular to the lack at that time of a large-scale database on income inequality in a variety of countries. Consequently this study will not be discussed here.
12
International Trade and Income Distribution: Reconsidering the Evidence
In order to test for the sensitivity of results with regards to these issues of data consistency and econometric specification, we run the same estimation as Spilimbergo et al., introducing two changes: we specified the econometric model in changes instead of levels; we imposed additional data consistency requirements, by using only changes computed as the difference between two Gini indices based on the same income concept and the same 4
recipient unit. When the relationship is estimated this way, the results found by Spilimbergo et al. no longer hold (see Appendix 1). Hence, while these studies appeared promising, they failed to deliver a convincing answer as to the link between openness and inequality: in addition to the gap between results and underlying theoretical models, robustness is in both cases challenged. This calls for an alternative approach. Our motivation for reconsidering this evidence is consequently to bring up improvement in three respects: theoretical approach, data consistency and econometric specification. As to the theoretical framework, we argue that the standard HOS model is too restrictive, in several ways. The assumption that the impact of liberalization on income distribution is only conditional on factor endowments implicitly or explicitly stems from the direct link between factor content of trade and factor endowment, as described by the HeckscherOhlin-Vanek relationship. Since Trefler (1995) emphasized the "case of the missing trade", a long way has been traveled toward making clear the conditions under which Vanek’s prediction is borne out by the data (see e.g. Davis and Weinstein, 2003, for a survey, and Trefler and Zhu, 2005, for a recent important contribution). Among these conditions are in particular the assumption of consumption similarity across countries, and the absence of any transaction cost (either linked to transportation or to border protection). Since we want to use a more general framework, and in particular acknowledge the potential influence of trade policy, we do not want to make such assumptions. This is why we do not assume the HOV relationship to hold. As a consequence, we cannot rely on factor endowments only to study the impact of foreign trade on income distribution. 5
Another concern with the theoretical framework is dimensionality. As already convincingly emphasized for instance by Wood (1994), we argue that three production factors are required, at least, to gain valuable insights about the distributional impact of trade in developing countries. Indeed, a large part of the labor force in poor countries does not have any education, even basic, and is employed in the traditional or craft sector. It is strongly questionable whether their output corresponds to tradable goods, as far as manufacturing industries are concerned. Moreover their mobility toward the “modern” 4
Due to shortage of data on inequality, achieving data consistency (same income definition and recipient unit) in level is impossible without ending with too small a dataset. The only way to combine data consistency with sample size requirement is to keep the same income concept and the same recipient unit for each inequality change. This does not guarantee that the same definition and income unit is used across all changes studied. However, it seems more appropriate to assume that changes are comparable across different definitions, rather than assuming that the levels are comparable. 5
Note however that many of the standard results of the HOS framework generalize to higher dimensionality, although frequently in a weaker form (see e.g. Ethier, 1974, 1984).
13
CEPII, Working Paper No. 2005-17
sector is hindered by the lack of basic education. Even in an economy where the export6
oriented manufacturing sector is intensive in low-skilled labor, such non-educated workers are thus unlikely to receive any direct benefit from the development of the export sector or from an increase in the price of exports. The positive impact on the relative price of unskilled labor, admittedly considered as the abundant factor for developing countries, might thus be restricted, in practice, to a fraction of unskilled workers only, namely those enjoying at least basic education, and likely to work in the “modern” sector. As soon as the share of non-educated labor in the labor force is large enough, the alleged positive impact of trade openness on unskilled (but somewhat educated) labor does not reduce inequalities. On the contrary, the deterioration of the relative position of non-educated workers would increase income inequalities. Of course, such effect is not expected to hold in more developed countries, where the share of non-educated workers is relatively small and in poor countries only specialized in agriculture. In order to address these different issues, we adopt a general theoretical framework in which the number of goods and factors is not specified, and in which no assumption is made about the rest of the world. In particular, no assumption is made about factor price equalization. Mainly based on the assumption of general equilibrium under perfect competition on product and factor markets, the model shows that factor price changes are correlated with an indicator of net export changes. Although this indicator can be termed a specific definition of the factor content of trade, it should be clear that this only comes out from the analysis of the link between foreign trade and relative wages. Our purpose is not to elaborate upon the validity of Vanek prediction on the link between factor endowments and the factor content of trade. In order to derive from this model a testable relationship between foreign trade and income inequality, we then restrict the model to the case where three production factors are considered, namely two types of labor (non-educated workers and other workers), in addition to physical capital. Assuming that non-educated workers are only employed in non-tradable goods production, we show that the change in income distribution is related to the change in an indicator of the factor content of net exports, relative to the country’s factor endowments. This relationship, which is the base for subsequent econometric estimates, turns out to be conditional on the share of non-educated workers. Our model compares two equilibria of a given economy, across which technology and consumer preferences are held constant. The nature of the shock considered is not specified explicitly, but the analysis applies to trade policy changes. As the factor content of net export changes embodies, among other things, the impact of possible trade policy changes, these trade policy changes need not be explicitly added as determinants of factor prices. The difficulty of properly measuring each country’s trade policy is thus sidestepped in the
6
"Intensive" is here to be understood in comparison to physical capital or to high-skill labor.
14
International Trade and Income Distribution: Reconsidering the Evidence
7
empirical analysis. As pointed out for instance by Leamer (2000) though, the changes in the factor content of trade are not only related to trade policies, but also to technology or 8 consumer taste changes (see also Deardorff, 2000, for a discussion). This means that the results should be interpreted with much care. The impact of our indicator of factor content of net export changes does not only reflect the impact of trade policies. But our approach suggests that the impact of trade policy on income distribution can be studied through its impact on the factor content of net export changes. Our theoretical and empirical approach does not make any restrictive assumption on crosscountry differences in preferences, technology nor choice of technique, which have been shown to be of special relevance by recent works (Davis and Weinstein, 2003; Trefler and Zhu, 2005). The counterpart of such an approach is that it is very data demanding. In particular, we make use of a country-specific technology coefficient matrix. For countries where data on capital stock at the industry level is missing, we assume capital intensity at the sector level to be the same as in countries found to be similar in terms of capital abundance and technology in a clustering analysis. Our empirical implementation brings up improvement in two other respects. We put special emphasis on data consistency requirements for inequality index and we analyze the impact of international trade change on the change in income distribution (instead of differences in levels of income inequality across countries due to differences in degrees of openness). Our main empirical finding is that the factor content of net export changes, expressed relatively to the country's factor endowment, does have a significant impact on income distribution, but this impact is conditional on country’s income level or to the share of noneducated in the population over 15. Taking into account the sign and magnitude of the factor content of net export changes, we find that on average international trade led to a widening of income inequality both in poor and rich countries, and to a reduction in middle-income countries. While for poor countries this result runs counter to the prediction of standard trade theory, it is in accordance with the theoretical model developed here. Furthermore, it is consistent with recent empirical findings obtained in slightly different contexts (Milanovic, 2002; Barro, 2000; Lundberg and Squire, 1999; see Table 1), but, contrary to these studies, it relies on a theoretical foundation explaining how trade can lead to an increase in inequality in low-income countries. Because in manufacturing industries, exporting firms require at least some education from their workers, trade does not directly benefit workers without any education, who account for the bulk of low-income households in most poor countries.
7
Rodriguez and Rodrik (2001) emphasized in the context of growth empirics that measures of trade openness are not good proxies for trade policies, since such indicators are frequently more influenced by basic macroeconomic policies and structural changes than by trade policies. 8
Noteworthily, industrial policy and path dependency of specialization can also influence significantly the factor content of trade.
15
CEPII, Working Paper No. 2005-17
The paper is organized as follows. Section 2 sets up the theoretical model. Section 3
describes the data used in the empirical analysis. Section 4 reports econometric results. Section 5 concludes.
2.
A MODEL OF OPENNESS AND INEQUALITY
We begin with a fairly general setup, in which the changes between two equilibria of an economy are described. The point is to relate net export changes to factor price changes. A more specific case is then considered, with three production factors. Finally, the link with income distribution is established.
2.1. Relating net export changes to factor price changes in a general setup Let us consider a small open economy, with M factors and N goods. Goods are assumed to be homogenous, and the economy exhibits perfect competition, with full employment of every production factor. Technology is given in each sector. Consumer preferences are assumed to be homothetic. Let us note v the vector (M x 1) of factor endowments, w factor prices (of dimension M x 1), q output (N x 1), d demand (N x 1), p domestic price (N x 1), A(w) the technology matrix (M x N), and U the utility function. Superscript t behind a matrix refers to the transposed of this matrix. Let us consider two equilibria of this economy, referred to by superscript 0 and 1, respectively. As production q1 is the best valorization of factor endowments under prices p1, necessarily therefore:
t
p 1 q 1 ≥ t p 1 q 0 . Inverting indices, it comes that
t
p 0 q 0 ≥ t p 0 q 1 , and
( t p 1 − t p 0 )(q 1 − q 0 ) ≥ 0
(1)
Output changes are positively correlated to price changes (see e.g. Ethier, 1984). Let us define λ =
U (d 1 ) . Since U is homothetic, U (d 1 ) = λU (d 0 ) = U (λd 0 ) . Now, as 0 U (d )
d1 is the least expensive consumption vector providing utility U(d1) under prices p1, t 1 1 t 1 p d ≤ p λd 0 . And inverting indices, t p 0 λd 0 ≤ t p 0 d 1 . Subtracting gives:
( t p1 − t p 0 )( d 1 − λd 0 ) ≤ 0 , and thus: (2)
( t p1 − t p 0 )( d 1 − d 0 ) ≤ ( λ − 1)( t p1 − t p 0 )d 0
Let us now choose as the numeraire the price of the initial consumption basket. This implies: (3)
t
pd 0 ≡ 1 ⇒
(
t
)
p 0 − t p1 d 0 = 0
16
International Trade and Income Distribution: Reconsidering the Evidence
Equation (2) thus reflects that demand changes are negatively correlated to prices. Noting net exports x = q-d, it comes from (1), (2) and (3) that:
( t p 1 − t p 0 )( x1 − x 0 ) ≥ 0
(4)
This shows that exports are positively correlated with prices. Adapting the proof of Ethier (1984, p.163), let us note b(w) = twA(w)(x1-x0). b(w) is the market value, under factor prices w, of net export changes between 0 and 1. Applying the mean value theorem to the function b(w) shows that
[
]
∃w ∈ w 0 , w1 / b( w1 ) − b( w 0 ) = ( t w1 − t w 0 )( A( w ) + w dA( w ))( x1 − x 0 ) As cost minimization implies that w dA( w ) = 0 , it follows that (5)
b( w1 ) − b( w 0 ) = ( t w1 − t w 0 ) A( w )( x 1 − x 0 ) 9
Now, the zero-profit condition implies that t p 0 = t w 0 A( w 0 ) , and Therefore, given equation (4),
t
p 1 = t w1 A( w1 ) .
b( w1 ) − b( w 0 ) =( t p 1 − t p 0 )( x 1 − x 0 ) ≥ 0
(6) Combining (5) and (6): (7)
[
]
∃w ∈ w 0 , w1 / ( t w1 − t w 0 ) A( w )( x 1 − x 0 ) ≥ 0
Technology is given, but A, the matrix of technical coefficients, is a function of w. However, as soon as factor price changes are small or as techniques are sufficiently insensitive to factor prices, A can be considered as constant between 0 and 1. (7) then means that factor price changes are correlated with A( x1 − x 0 ) . Several aspects are worth emphasizing in this result. Firstly, it is rather general. Equilibria 0 and 1 are not precisely specified; technology and preferences are assumed to remain unchanged between these two equilibria, but the number of goods and factors is not restricted, and no assumption is made about the rest of the world. As often, the counterpart for this generality is the weak form of the result, which is only a correlation. Secondly, A( x1 − x 0 ) can be interpreted as the factor content of net export changes. This terminology should not be misleading, however: our purpose has nothing to do with the validation of Vanek’s prediction, about which much has been written on the way factor content of trade should be computed (see e.g. Davis and Weinstein, 2003, Trefler and Zhu, 9
In so doing, we are assuming that all goods are produced in the economy. This implies that all imports face a non-zero competing domestic production.
17
CEPII, Working Paper No. 2005-17
2005). The specific definition of factor content of trade used here comes up as a result of our theoretical analysis of the link between foreign trade and factor prices. This explains why we are not concerned with the production technique used by the exporting country, but only by the one used in the importing country: the intuition is that while Vanek’s prediction is concerned with factor services embodied in trade flows, we are here only concerned with 10 factor services embodied in domestic production, in relation with foreign trade. Thirdly, if 0 corresponds to autarky (a) and 1 to free-trade (f), and assuming that the standard Heckscher-Ohlin-Vanek relationship holds, this relationship collapses to the usual link between factor endowment and the impact of liberalization on factor prices: (8)
( t w f − t w a )(v c − α c v w ) ≥ 0
Where c refers to the country studied, w to the world, and αc is the share of country c in 11 world GDP. This equation is thus a weak and generalized version of the StolperSamuelson theorem. It states that the impact of free trade on factor prices is positively correlated with the relative abundance of factors in the country, compared to the world. In other words, free trade tends in average, in each country, to favor the relatively abundant factors. Fourthly, equation (7) shows that the impact of foreign trade on factor prices cannot be summarized through a mere measure of trade openness. The nature of import and export specialization also matters, as characterized by the factor content of trade.
2.2. Implications in a three-factor model Let us now assume that three production factors only are used: labor without any education (UN), labor with at least basic education (L), and capital (K). The number of goods is not specified, but we will assume that goods can be classified in two categories (tradable and non-tradable), and that exportable good production does not require any uneducated labor. The rationale for these assumptions is to account for the existence in most developing countries of a traditional sector, employing non-educated labor, and producing goods unsuited for export, and not in competition with imports. Noteworthily, this category of non-educated labor differs from the usual definition of unskilled labor, in that it is restricted to workers without any education. The assumption that the production of exportable goods does not require uneducated labor is questionable for raw material and raw agriculture. However, as far as manufactured goods are concerned, producing goods well suited for export requires matching relatively high standards of quality, which call for a certain level of skill.
10
A limit of our analysis is however that we are only considering the direct factor content, and do not take into account intermediate inputs. See Trefler and Zhu (2005) for elaboration on this point. 11
Assuming balanced trade.
18
International Trade and Income Distribution: Reconsidering the Evidence
As mentioned above, A can be considered as constant between 0 and 1 and A( x1 − x 0 ) can then be interpreted as the factor content of net export changes. Since non-educated labor is not used in the production of tradable goods, the UN-content of trade necessarily equals zero. So, with the two remaining factors, equation (7) can thus be re-written as: (9)
∆w L ∆LCT + ∆w K ∆KCT ≥ 0
Where wL and wK stand for the price of factor L and K (i.e. the second and third cells of vector w), and ∆ behind a variable denotes a change between state 0 and 1. LCT (KCT) refers to the L-content (K-content) of trade, defined as the second (third) cell of vector A( x1 − x 0 ) , that is LCT = a Li xi , where xi refers to net exports in sector i, and aLi is
∑ i
the quantity of factor L required to produce one unit of good i. Now, given the assumption of zero profit (hence above: (10)
t
t
p ≡ t wA(w) ) and the numeraire chosen
∆pd 0 = 0 ⇒ t∆w A d 0 = 0
Noting UN , L, K the country's initial endowment in factor UN, L, and K, the latter relationship can be re-written as (given that Aq is the vector of factor endowments of the economy): 0
(11)
(
)
(
)
UN ∆wUN + L − LCT 0 ∆wL + K − KCT 0 ∆wK = 0
Since UN is only used in the production of non-tradables and preferences and technologies are constant, wUN can be assumed to be hardly changed (in nominal terms) between 12 equilibria 0 and 1. (11) then becomes: (12)
(L − LCT )∆w + (K − KCT )∆w 0
0
L
(
K
=0
)
(
)
This equation has two implications. Firstly, given that L − LCT 0 and K − KCT 0 are necessarily positive, it implies that the changes in wL and wK have opposite signs. This in turns shows that the change in wL has the same sign as the change in the relative wage, wL/wK. Equation (12) can also be used to substitute ∆wK in (9), thus giving, after simplifications:
12
This assumption is not necessary if two factors only are considered. The results stated below in terms of factors L and K are still valid in this case.
19
CEPII, Working Paper No. 2005-17
(13)
∆KCT ⎤ ⎡ ∆LCT ⎢⎣ L − LCT 0 − K − KCT 0 ⎥⎦ × ∆wL ≥ 0
The relationship shows that the change in the price of educated labor (this is also true for the relative price of educated labor with respect to capital) has the same sign as the expression within square brackets, which relates to the factor content of trade changes. In other words, the term within brackets gives the sign of the impact of trade changes on the relative wage.
2.3. Link with income inequality So far, we have only dealt with relative factor prices, not with income distribution. The former is usually taken to be closely linked to the latter, based on the assumption that one factor (skilled labor, or capital) is both in the minority and better paid. This is why the twofactor model of international trade, and the corresponding implications in terms of relative factor prices, has been widely used in order to deal with the impact of trade on income distribution. When three factors are considered, the link between factor prices and income inequality is less straightforward. In order to make this link clear, let us assume that the economy has three distinct household categories. Within each category, households draw their income from one production factor only, of which each of them is assumed to own one unity. Households are thus divided between non-educated workers, educated workers, and capital owners. Logically, the level of income can be assumed to be increasing across these three categories (non-educated workers at the bottom end of income distribution, capital owners at the top). The Gini index of income inequality then writes (see details in Appendix 2): (14)
w w w G = ~UN sUN (sUN − 1) + ~L s L (sUN − s K ) + ~K s K (1 − s K ) w w w
Here, G is the Gini index of income inequality, sUN (respectively sL, sK) is the share of ~ is the households drawing their income from production factor UN (resp. L, K), and w ~= average income per household (hence w s f w f ).
∑
f =UN , K , L
Based on this expression and on equation (12), it is possible to characterize the link between the Gini index of income inequality and the price of educated labor: (15)
dG s s ( L − LCT 0 ) = ~L ( sUN − s K − G ) − ~K (1 − s K − G ) dwL w w ( K − KCT 0 )
20
International Trade and Income Distribution: Reconsidering the Evidence
From which it follows: (16)
⎛ s ( L − LCT 0 ) ⎞ dG ≤ 0 ⇔ sUN ≤ 1 + (1 − s K − G )⎜⎜ K − 1⎟⎟ 0 dwL ⎝ s L ( K − KCT ) ⎠
This shows that, as long as the share of households relying on non-educated labor is low enough (in particular, in rich countries), an increase in the price of educated labor decreases 13 income inequalities. But it also shows that, as soon as the proportion of households relying on non-educated labor is large enough, and provided that the number of households relying on educated labor is high enough relative to capital owners (both assumptions are likely to hold for poor countries), an increase in the price of educated labor increases 14 income inequalities. The intuition behind this result is the following. In a rich country, labor without any education is a small minority. The bulk of low-income households can be assumed to belong to the category of workers with at least basic education. An improvement in the income of this category of households thus entails reduced income inequalities. In a poor country, in contrast, labor without any education can account for the bulk of low-income households. In this case, households relying on educated-labor income are already relatively favored. An improvement in their income is not necessarily reflected in lower income inequalities. Combining equations (13) and (16) finally suggests that the influence of changes in foreign trade upon income inequalities can be characterized using the indicator of factor content of net export changes, as defined in (13): 0 (17) ⎡ ∆LCT − ∆KCT ⎤ × ∆G ≤ 0 ⇔ s ≤ 1 + (1 − s − G )⎛⎜ s K ( L − LCT ) − 1⎞⎟ UN K ⎜ s ( K − KCT 0 ) ⎟ ⎢⎣ L − LCT 0 K − KCT 0 ⎥⎦ ⎠ ⎝ L
This relationship is not monotonic. The difference between (educated-)labor content and capital content of net export changes should be negatively correlated with income inequality for countries with a small share of non-educated workers, but the correlation should be positive for countries with a large share of non-educated workers. The interpretation of such relationship between the factor content of net export changes and income distribution calls for caveats. The use of factor content of trade calculations has raised much debate (see in particular Leamer, 2000; Krugman, 2000; Deardorff, 2000; Panagariya, 2000; and related literature). The main point was to identify the extent to which factor content of trade calculations could be used as indicators of the influence of trade 13
Note that (1-sK-G) is necessarily positive, given the assumption made above that capital owners are at the top of income distribution. 14
In order to make sure that the inequality changes sign under these two conditions, it is in addition necessary to assume that (KCT0 /⎯K) < (LCT0 /⎯L), which is very likely for poor countries.
21
CEPII, Working Paper No. 2005-17
policy on factors relative earnings and wage shares. In other words, what are the questions such calculations are able to address, and under which assumptions? Here, we do not make any a priori assumption about the value of the factor content of trade as an indicator of the influence of trade on income distribution. Instead, our theoretical analysis shows that, under the assumptions made here, changes in income distribution can be linked to changes in an indicator of the factor content of net exports. We do not interpret this as being a characterization of the impact of trade policy, since the factor content of trade does not depend only on trade policy, as emphasized for instance by Leamer (2000) (note that the same is true, for instance, of trade openness as usually measured). However, it means that the impact of a given trade policy shock on income distribution can be characterized by relation (17), through its impact on the factor content of net exports. In other words, under the general framework used here, we argue that relation (17) is the simplest way through which trade policy changes can be related to income distribution. But the contribution of trade policy to changes in the factor content of trade cannot be derived in a systematic and simple manner.
3.
EMPIRICAL APPROACH
The theoretical model suggests that the relationship between changes in foreign trade and income inequalities is conditional: it depends on the magnitude of the share of households drawing their income from non-educated labor. Therefore, the testable specification derived from the theoretical model is: (18)
∆ ln Git = α + β * ∆FCTit + γ * ∆FCTit * ( NOEDit −1 ) + ε it
Where i stands for the country and t for time; ∆lnG is the Gini index of income inequality growth rate, ∆FCT the labor-capital content of net export changes indicator, NOED the percentage of the population over 15 with no education or who have attained some primary education but not completed a primary education degree (Barro and Lee, 2000). The labor-capital content of net export changes indicator defined in equation (13) is calculated using a different technology matrix for each country: (19) 28
∆LCTit ∆KCTit ∆FCTit = − = Li − LCTit −1 K i − KCTit −1
Lij 90
∑Q j =1
28
ij 90 28
∑ Lij 90 − ∑ j =1
j =1
22
28
Lij 90 Qij 90
− XN ijt −1
K ij 90
∑Q
∆XN ijt
j =1
ij 90
ij 90
−∑
28
∑K j =1
∆XN ijt
28
K ij 90
j =1
Qij 90
XN ijt −1
International Trade and Income Distribution: Reconsidering the Evidence
15
Where K (L) refers to capital (labor), Q to production and XN to net exports; j stands for the sector. Data on trade, labor input and production is taken from the CEPII's Trade and Production 16 Database, an extension of a World Bank’s dataset. Sectoral capital stocks come from the dataset constructed by Peter K. Schott (28 17 manufacturing industries, 3-digit ISIC code). Unfortunately, these data are only available for a sample of 34 countries. As underlined by Davis and Weinstein (1998) and Xu (2003), non-FPE two-factor models (Dornbush et al., 1980) suggest that industry capital to labor usage varies with country capital abundance. Dollar et al. (1989) actually show that “countries with more capital per worker in the aggregate tend to use more capital per worker in every industry” for a sample of developed countries. This evidence is also supported for a sample of developing countries (Xu, 2003). Accordingly, a hierarchical clustering analysis is carried out to estimate industry capital stocks for countries not available in the Schott dataset, based on the assumption that countries with similar capital abundance (capital stock per worker) and technology (proxied by per capita PPP GDP) 18 have the same capital intensity per sector. Practically, for countries where sectoral capital stock data is missing, capital intensity per sector is assumed to be equal to the average for the cluster the country belongs to. Consequently, for a country i not included in the data provided by Schott, the following formula is applied: 15
Net exports are adjusted for disequilibria of trade balance; the correction is based on the following formula:
XN ijt = ( X ijt − M ijt ) − ( X ijt + M ijt ) * ⎡ ⎢⎣
( X i.t − M i.t )
⎤ ( X i.t + M i.t )⎥⎦
16
The World Bank Trade and Production 1976-1999 database made available by Alessandro Nicita and Marcelo Olarreaga provides data on production, labor and trade in a compatible industry classification (3Digit ISIC Code). The original statistics comes principally from United Nations sources, the COMTRADE database for trade and UNIDO industrial statistics for the production. The dataset was largely extended by the CEPII using more recent versions of UNIDO CD-ROM, OECD STAN data for OECD member countries as well as the harmonized database of international trade from CEPII (BACI). 17
These data were kindly made available to us by Peter K. Schott, whom we would like to gratefully acknowledge. Manufacturing capital stocks are computed for 1990 using the perpetual inventory method on industry gross fixed capital formation data available from UNIDO (1995). For more information see Schott (2003). 18
National capital stocks are mainly drawn from the most comprehensive database of Nehru and Dhareshwar (1995), including 93 developing and industrial countries. For 3 countries not included in this dataset (Hong-Kong, Peru, Poland), capital stocks are taken from the Summers and Heston database (Penn World Table 5.6) and converted at market exchange rates. Data on the workforce come from World Development Indicators (World Bank). GDP and population are drawn from CHELEM, a CEPII’s database. PPP GDP per capita is expressed in purchasing power parities in international prices and converted in constant US dollars (millions - base year 1995).
23
CEPII, Working Paper No. 2005-17
(20)
K ij 90 Qij 90
⎡ 1 C K cj 90 ⎤ Lij 90 =⎢ ∑ ⎥* ⎢⎣ C c =1 Lcj 90 ⎥⎦ Qij 90
where c are countries available in Schott’s database and which belong to the same cluster as 19 country i. As a result of this procedure, we are able to compute the indicator of labor-capital content of net export changes ( ∆FCT it ) for 53 countries using their “own” technical coefficients matrix. The data on inequality (Gini coefficients) are drawn from the World Income Inequality 20 Database (WIID, 2000), which extends the Deininger and Squire dataset (Deininger and 21 Squire, 1996), and from OECD’s estimates (Burniaux et al., 1998). As data on income distribution might suffer from serious problems of quality, especially acute for developing countries, our regressions only make use of a « high quality » subset of Gini coefficients 22 meeting the minimal standards of reliability. However, a problem of data comparability remains, since income concepts and recipient units may differ between countries and over time in successive surveys. Due to data limitations, most studies use Gini coefficients based on different definitions despite important discrepancies (Li and Zou, 1998; Deininger and Squire, 1998). As shown by Knowles (2001) about the link between inequality and 23 economic growth, even adjusting the data is not an adequate solution to definitional differences: the results are highly affected, compared to the case where only data measured in a consistent manner are used.
19
Actually, several levels of clustering are used. For country where sectoral capital stocks are missing, the average used as a proxy is computed for the smallest cluster where data is available, among those the country belongs to. 20
WIID is a large dataset on inequality in the distribution of income (5050 Gini coefficients for 151 countries) compiled by the United Nations University/World Institute for Development Economics Research and the United Nations Development Programme (UNU/WIDER-UNDP, 2000). 21
We are indebted to Thai-Thanh Dang (OECD) for graciously providing us with Gini coefficients on twenty-one industrialized countries. 22
To be considered as “reliable”, the data have to satisfy the three criteria adopted by Deininger and Squire (1996) in selecting “high quality” Gini coefficients: inequality measures are based directly on household surveys (and not on estimates drawn from national accounts statistics); the coverage has to be representative of the whole population; all sources of income or uses of expenditure has to be accounted for. The “high quality” resulting dataset contains 1632 Gini coefficients on 132 countries. 23
For example some authors transform the data for differences between income-based and expenditurebased coefficients (see e.g. Li et al., 1998).
24
International Trade and Income Distribution: Reconsidering the Evidence
Even in the “high quality” subset, the strong sensitivity of the level of the Gini coefficient to the use of different income concepts (with the same recipient unit) is easily illustrated: for example use of the concept of expenditure for Canada in 1992 yields a Gini coefficient (21.7) about 10 points lower than the Gini coefficient based on gross income (31.6) – around 6 points for net income (27.8); for Finland the Gini coefficient in 1996 is 22.7 for net income, more than 5 points lower than the one based on gross income (28.2). Examples abound of such sizeable differences, which often overreach cross-country differences. Using the same income definition but different recipient units also gives rise to large measurement differences: the Gini coefficient in Brazil in 1985 equals 61.8 using persons as the recipient unit, and 58.9 using household per capita; in United Kingdom, the Gini coefficient in 1979 is 27.0 across families and 24.4 across households. These large differences across definitions do not come as a surprise, since the concepts they refer to differ substantially. To the extent that each of them is to be considered as a meaningful summary measurement of income inequality, however, changes over time can be assumed not to differ much across definitions. Accordingly, and in order to get consistently measured data for several countries and years, our empirical analysis only makes use of changes over time of Gini coefficients, computed as the differences between two observations using the same recipient unit (individual or household) and the same concept of income (gross income, net income, expenditure…). This consistency requirement comes at the cost of a considerable downsizing of the sample, although even this methodological choice is guided by the necessity to preserve a large enough sample: ideally, retaining only data based on the same income definition and recipient unit for each country – instead of each variation – or from the same primary source would have been preferable. . 24
In most cases, changes in the Gini index are calculated over a four-year time span. A hierarchy among income concepts is used in order to choose the most appropriate one, 25 when different income concepts are available to compute the same change . As a result of this data work, we have been able to put together a sample of 140 observations, covering 41 countries, for which all the variables of interest are available (in particular, changes in the Gini index and the indicator of the factor content of net export changes). Among these 140 observations, 61 are for developed countries and 79 for developing countries. It is worth mentioning that this sample does not cover Sub-Saharan African countries except South Africa. Coverage varies across decades as well: 34 observations concerns the seventies, 75 the eighties and 31 the nineties.
24
When it was impossible to get a four years time span we allowed variations to be based on three years, or on more than four. 25
In particular, as redistribution (or its determinants) cannot be properly accounted for, data about gross income are assumed to be more relevant than data on net income or expenditure, when a choice is allowed by the database. The hierarchy of income concepts is: 1- gross income, 2- factor income, 3- gross monetary income, 4- net income, 5- disposable income, 6- expenditure, 7- monetary expenditure, 8- net expenditure.
25
CEPII, Working Paper No. 2005-17
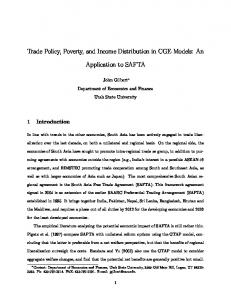
For illustrative purposes, Figure 1 reports the number of positive, null, and negative observed changes in the Gini index in our sample, separately for developed and developing countries. For each group, the percentage of observations corresponding to an increase in inequality is higher than 50% during the eighties and the nineties. Figure 1: Distribution of observations by signs of variation of the Gini coefficient
30
Developed countries
Developing countries
25 20 15 10 5
46%
61%
87%
33%
Seventies
Eighties
Nineties
Seventies
55%
56%
0
Eighties
Nineties
-5 -10 -15 -20
0
-25
Note: Values are the number of observations in the data set that correspond to a positive, null or negative variation of the Gini coefficient. Percentages are the number of positive variations on total observations by decades. Developed countries are countries for which PPP GDP per capita is higher than $15,000. Source: Authors' calculations based on WIID (2000) and OECD.
4.
EMPIRICAL EVIDENCE
According to the theoretical model, the impact of a change in the factor content of net exports is conditional on the share of households drawing their income from non-educated labor. However, data on the share of the non-educated in the population over 15 are only available at five-year intervals. Introducing it in estimations thus first requires interpolating the data. This raises serious questions about the reliability of this variable. Our estimating 26 strategy is thus to use PPP GDP per capita instead of the share of non-educated in working age population: although it fits less closely model's predictions, PPP GDP per capita is likely to be better measured, and it is available on an annual basis. Its empirical reliability is therefore higher. Nevertheless, results using the share of the non-educated in the population will be subsequently presented with view of checking results robustness. In 26
GDP per capita is expressed in purchasing power parities (base year 1995). GDP and population are drawn from CHELEM, a CEPII’s database.
26
International Trade and Income Distribution: Reconsidering the Evidence
this case, the acknowledged measurement error for non-educated share leads us to use instrumental variable techniques. 27
Table 2 reports results from estimating equation (18) , using PPP GDP per capita instead of the share of the non-educated in the population. We begin (column 0) with testing a simple equation where only the factor content of trade is taken into account. No significant effect is found in this case. As suggested by equation (18), an interaction term between the factor content of net export changes (∆FCT) and initial PPP GDP per capita is then included in the estimation (column 1). In order to avoid collinearity, this term is calculated by interacting ∆FCT with a centered term of PPP GDP per capita, namely the difference of the log PPP GDP per capita to its mean across the sample. In this estimate, ∆FCT is still found insignificant, but the interaction term turns out to be significant, in accordance with the model’s prediction. This result suggests that the influence of the factor content of net export changes on inequality growth rate would be conditional on the initial level of income per capita. For poor countries, an increase in FCT (i.e. net export changes exhibiting a higher increase in labor-content than in capital-content) increases income inequality, while it would reduce income inequality in rich countries. The threshold, for which the effect shifts sign, occurs for an income level of approximately PPP $4,700. Around this income level, the impact of ∆FCT is approximately zero. According to the model displayed above, the coefficients of the capital content and of the labor content of net exports should be opposite in sign and equal in absolute value, as is assumed when only ∆FCT is included in the equation. In order to test this assumption, the capital content and the labor content of trade are considered separately in column 2. Only variables on the labor content of net export changes are found to be significant in this case. While inconsistent with the model, the insignificance of the capital content of net export changes is not wholly surprising. Indeed, the assumption of factor immobility across countries made in the model is not realistic in the case of capital. Since capital is fairly mobile across countries, it may seem logical that the content of foreign trade in this factor should not necessarily have a significant impact on its price. For labor, the results suggest the same kind of conditional relationship as the one obtained before for FCT. The threshold for which the effect shifts signs is the same than the one found before, around $4,700 PPP GDP per capita. So far, land has not been considered, while this factor originates a substantial part of income in numerous countries. While our theoretical framework does not include this fourth factor, it is useful checking for the robustness of the analysis with regard to the 28 inclusion of land. Estimation (3) thus extends the model by incorporating a proxy for the land content of foreign trade. This proxy is constructed assuming that the land content of
27
As changes are calculated on different time spans, they have been annualized in all estimates. 28
We do not make the assumption for agriculture that tradable good production does not require uneducated labor. Therefore we do not introduce any interaction term between the land content of net export change and PPP GDP per capita in the estimation.
27
CEPII, Working Paper No. 2005-17
29
production is one for agricultural sectors, and zero otherwise. This is a very crude approximation, but the lack of appropriate data prevented us from making a more precise calculation. As shown in column (3), including this variable does not alter significantly the results obtained for the other variables, although the threshold is lower in this case. The land content of net export change turns out to have a positive and significant impact on income inequality, consistent with the fairly high concentration of land ownership observed 30 in most countries. Table 2: Econometric estimates of the change in the Gini index, base results Dependent variable: ∆ ln G it
∆FCTit
(0)
(1)
0.068 (0.101)
-0.207 (0.15) -0.331** (0.124)
Ln GDPpc it -1 * ∆FCTit ∆KCTit Ln GDPpc it -1 * ∆KCTit
∆LCTit Ln GDPpc it -1 * ∆LCTit
(2)
(3)
0.161 (0.178) 0.199 (0.14) -0.261* (0.13) -0.420** (0.109)
0.160 (0.179) 0.190 (0.162) -0.308* (0.12) -0.454** (0.125) 0.023** (0.006) 0.0006 (0.002) 4,958 124 0.07
∆ACTit Constant
0.0018 (0.0018)
Threshold GDPpc value Number of observations Adjusted
140 0.00
R2
0.0006 (0.0019) 4,675 140 0.06
0.0006 (0.0019) 4,691 140 0.07
Note: Changes between t and t-1 are calculated over a four-year time span whenever it is possible, and the time span is never lower than three years. Robust standard errors are shown between parentheses. The threshold GDP per capita value is calculated from the labor-content of trade. *Statistically significant at 5% level ; **Statistically significant at 1% level. Source: Authors' estimates based on various sources, see text. 29
The land content of net export changes indicator (∆ACTit) is constructed in the following manner:
∆ACTit =
∆XN iat where XNiat and VAia refer to net exports and value added in agriculture; subscript a VA ia
stands for the agricultural sector as a whole. Data on value added in the agricultural sector are taken from World Development Indicators (World Bank). 30
The concentration in the distribution of land ownership has been measured through a Gini index for a variety of countries, in a dataset built by Deininger and Olinto (2000). This data has been kindly made available to us by Klaus Deininger, whom we gratefully acknowledge. Unreported estimates were carried out including this variable (in interaction with the land content of trade). Unfortunately, its coverage is limited with respect to the sample considered here, thus limiting strongly the number of observations for the corresponding estimates, and this variable was never found to be significant.
28
International Trade and Income Distribution: Reconsidering the Evidence
The robustness of these results is assessed through additional estimates, based on estimate (3) (Tables 3 and 4). In order to check that the results are not exclusively driven by a handful of observations, estimate (4) excludes from the sample a small number of 31 observations, signaled as outliers by standard tests. The results are not substantially altered as far as the labor content of trade is concerned, although the threshold is found to be somewhat lower in this case. Since we do not want the results to stem only from the comparison of wealthiest countries to the rest of the world, estimate (5) excludes observations for which PPP GDP per capita is higher than $15,000. The interaction term between labor content of net export changes and PPP GDP per capita is still significant, and stronger in this case, consistent with the premise that some of the mechanisms described above (in particular those linked to the share of non-educated labor) are less relevant for rich countries. Interestingly, the interaction term of PPP GDP per capita with capital content of net export changes is found to be significant in this case, in contrast with the finding for the whole sample. This result is consistent with the above-mentioned interpretation that the non-significance of the capital content of trade is linked to the strong international mobility of capital. Since this mobility is lesser in developing countries, it makes sense to find a significant coefficient when the sample excludes richest countries. The estimates could also suffer from an omitted variable bias. Such a bias is likely to be far less severe than for estimates carried out on the level of income inequality, instead of the variation. However, it cannot be ignored. Since Ravallion (2003), for instance, suggested that the initial level of the Gini index might be relevant in explaining the variation of this index, estimate (6) incorporates this variable. The initial level of the Gini index does not prove to be significant, and it does not alter the results concerning the other variables. Another omission might occur if the Kuznets’s curve proves to be relevant. Although the relevance of such a hump-shaped curve has not been confirmed by recent studies, equation (7) introduces the corresponding variables, namely initial income per capita and its square value. Here again, the additional variables are not found to be significant, and the results concerning the variable of interest for us are preserved. As mentioned above, the use of PPP GDP per capita in the econometric model is guided by concerns about the reliability of data on the share of non-educated in the population. Since 32 this variable is the one best reflecting our theoretical model's prediction, and notwithstanding our doubts about its reliability for our purpose, we now present estimates making use of this variable. Using the share of the non-educated in the population over 15 first requires to interpolate this variable, available from (Barro and Lee 2000) on a fiveyear basis. The OLS estimator is no longer valid in this case, as this variable is likely to be subject to measurement error. Equation in Table 4 is thus estimated using instrumental variables method. PPP GDP per capita multiplied by the variation of the labor content of 31
This procedure was carried out excluding the points signalled as outliers by tests on the studentized residuals. 32
However it would have been preferable to use data on the share of the non-educated in the labor force or in the working age population. Unfortunately, these statistics are not available for a large sample of countries.
29
CEPII, Working Paper No. 2005-17
trade, PPP GDP per capita multiplied by the variation of the capital content of trade and the initial Gini coefficient are being used as instrumental variables for ( noed − noed ) ∆LCT and (noed − noed )∆KCT . The Hausman test for the presence of measurement errors clearly indicates that OLS is an inconsistent estimator for this equation. The Hansen J-test shows that the null hypothesis that instruments are exogenous can not be rejected. Table 3: Econometric estimates of the change in the Gini index, robustness results Dependent variable:
∆ ln G it
∆KCTit Ln GDPpc it -1 * ∆KCTit
∆LCTit Ln GDPpc it -1 * ∆LCTit ∆ACTit
(4)
(5)
(6)
(7)
0.173 (0.178) 0.195 (0.162) -0.327** (0.119) -0.449** (0.124) 0.022** (0.006)
0.31 (0.175) 0.464* (0.214) -0.105 (0.115) -0.528** (0.204) 0.012 (0.01)
0.126 (0.183) 0.173 (0.161) -0.29* (0.121) -0.442** (0.126) 0.023** (0.007) -0.007 (0.008)
0.174 (0.18) 0.197 (0.17) -0.317** (0.122) -0.438** (0.129) 0.021** (0.007)
Ln Gini it -1 ∆Ln GDPpc it
0.0006 (0.002) 4,773
0.001 (0.003) 4,251
0.024 (0.027)
0.371 (0.71) -0.022 (0.04) 0.001 (0.003)
122 0.10
63 0.07
124 0.07
124 0.06
∆ (Ln GDPpc it ) 2 Constant Threshold GDPpc value Number of observations Adjusted
R
2
Note: Changes between t and t-1 are calculated over a four-year time span whenever it is possible, and the time span is never lower than three years. Robust standard errors are shown between parentheses. The threshold GDP per capita value is calculated from the labor-content of trade. (4) excludes outliers; (5) excludes observations (country/time) with GDPpc>15000$PPP; (6) adding initial Gini index; (7) adding Kuznets effect *Statistically significant at 5% level ; **Statistically significant at 1% level. Source: Authors' estimates based on various sources, see text.
30
International Trade and Income Distribution: Reconsidering the Evidence
Table 4: Econometric estimates of the change in the Gini index, using the share of non-educated in the population over 15 (IV method) Dependent variable:
∆ ln G it
∆KCTit
(8) 0.080 (0.203) -0.013 (0.012) 0.018 (0.231) 0.043* (0.019) 0.012 (0.013) -0.0001 (0.002) 30%
NOEDit -1 * ∆KCTit
∆LCTit NOEDit -1 * ∆LCTit ∆ACTit Constant Threshold NOED value Number of observations F (2,116) on the augm. regress P-value Hansen J-statistic Chi2 (1) P-value
124 9.78 0 0.297 0.59
Note: Changes between t and t-1 are calculated over a four-year time span whenever it is possible, and the time span is never lower than three years. Robust standard errors are shown between parentheses. The threshold share of non-educated in the population value is calculated from the labor-content of trade. *Statistically significant at 5% level ; **Statistically significant at 1% level. Source: Authors' estimates based on various sources, see text.
The results are consistent with previous findings. The capital content of trade is still found insignificant, while the coefficient on the interaction term between labor content of trade and the share of the non-educated is significant. This suggests that the impact of the labor content of net exports change on income inequality growth rate is conditional on the share of the non-educated in the population over 15, as outlined in the theoretical framework. In countries where this share is above 30%, an increase in the labor content of trade raises inequality, while it exerts an equalizing effect in other countries. The consistency with previous findings based on PPP GDP per capita is illustrated by Table 5, which shows that the thresholds found using both criteria correspond to comparable splits of the sample. This is no surprise given the strong correlation between GDP per capita and education achievements, but this proves that the results using the second variable are consistent with those found previously.
31
CEPII, Working Paper No. 2005-17
Table 5: Number of observations (country/time) for which PPP GDPpc < $4 958 25 3 28
NOED > 30% NOED < 30% Total
PPP GDPpc > $4 958 26 70 96
Total 51 73 124
Source: Authors' calculations, based on Barro and Lee (2000) and on CHELEM-CEPII.
The resulting impact of international integration on inequality depends on the sign and magnitude of the factor content of net export changes. For illustrative purposes, it is worth computing the implied contributions using estimates based on PPP GDP per capita (Table 2, columns 1 and 3). On average, the labor/capital-content of trade increased in poor countries and decreased in middle-income and rich countries, thus resulting in both cases in a widening of income inequality (Table 6). When middle- and high-income are considered separately (by arbitrarily setting $15,000 PPP GDP per capita as the cut point between these two categories), the impact of trade is still found to be higher inequalities in rich countries, but the reverse is true for middle-income countries. Interestingly enough, the contribution found for the factor content of net export changes are sizeable compared to changes in the Gini index, especially for poor countries, where the contribution of trade actually almost equals total change. Table 6: Trade contribution to Gini growth rate (%) Countries
Poor
Middle-income & rich
Middle-income
Rich
Based on table 2 estimate 1 PPP GDP per capita Gini growth rate Labor/capital-content of trade contribution Nb of observations
Below $4,675
Above $4,675
0.370
0.215
Between $4,675 and $15,000 0.054
0.466
0.063
-0.110
0.194
34
106
45
61
Above $15,000 0.336
Based on table 2 estimate 3 PPP GDP per capita Gini growth rate Sum of labor- and landcontent of trade contributions Nb of observations
Below $4,958
Above $4,958
0.278 0.319
0.165 0.036
Between $4,958 and $15,000 -0.128 -0.161
(0.304)# 28
(0.059)# 96
(-0.035)# 35
Note: # Labor-content of trade contribution between parentheses. Source: Authors' calculations.
32
Above $15,000 0.336 0.150 (0.114)# 61
International Trade and Income Distribution: Reconsidering the Evidence
5.
CONCLUDING REMARKS
In this paper, we reconsider the evidence concerning the influence of international trade on income distribution, motivated by serious concerns about data consistency, empirical specification, as well as theoretical framework. Our approach differs substantially from the ones used so far in the literature. The theoretical model used as a background for the analysis is fairly general. It does not make restrictive assumptions in terms of how trade specialization is linked to factor endowments. This is a way, in particular, to acknowledge the possibly strong influence of industrial policy, trade policy, as well as path dependency of specialization. As a result, our analysis does not look for a systematic impact of trade openness or of trade liberalization (however defined) on income distribution. We merely argue that the influence of international trade changes (either as a result of trade liberalization or of other determinants) on income distribution is captured by the factor content of net export changes. This might sound like a non-answer to the issue of the impact of liberalization on inequality. Actually, this is most of all an acknowledgement of the diversity of liberalization processes and of trade patterns, even across countries with similar factor endowments. There is no systematic impact of trade liberalization on inequality, because there are various types of trade liberalization (even if the result would be free trade, the starting point may differ widely). Our main empirical finding is that the factor content of net export changes, expressed relatively to the country's factor endowments, does have a significant impact on income distribution, but the sign of this impact is conditional on country’s income level or to the share of non-educated in the population over 15. More specifically, our estimates suggest that an increase in the factor content of net export changes (expressed either in terms of labor, or labor minus capital) increases income inequality in poor countries (i.e. with a PPP GDP per capita approximately below $5,000), while it reduces inequality in countries above this threshold. The resulting impact of international trade on inequality depends on the sign and magnitude of the factor content of net export changes. On average, trade led to a widening of income inequality both in poor and rich countries but to a reduction in middle-income countries. Such results are to be interpreted with caution. Firstly, they only reflect average results, and the contribution of the factor content of net export changes can be of opposite sign in countries belonging to the same group. Secondly, the factor content of net export changes is not an indicator of liberalization, nor even of trade openness. The interpretation is more suited the other way round: trade liberalization is likely to affect the factor content of net exports, and this is the indicator to look at in order to gain valuable insights about the induced impact on income distribution. Still, this shows that the way liberalization is handled may have significant repercussions for income distribution. While inequalities are better tackled with direct policy instruments, in particular fiscal redistribution, in poor countries the implementation of such policies is far from being an easy task. Our results also recalls the vital role of basic education, which is often a necessary condition for 33
CEPII, Working Paper No. 2005-17
workers to benefit, directly or indirectly, from the gains associated with new trade opportunities.
34
International Trade and Income Distribution: Reconsidering the Evidence
REFERENCES Barro, R. J., (2000) "Inequality and Growth in a Panel of Countries", Journal of Economic Growth 5, March, 5-32. Barro, R. J., Lee J.-W., (2000) "International Data on Educational Attainment: Updates and Implications", NBER Working Paper 7911. Bourguignon, F., Morrisson, C., (1990) "Income Distribution, Development and Foreign Trade : A Cross-sectional Analysis", European Economic Review 34(6), 1113-1132. Burniaux, J.-M., Dang T.-T., Fore D., Förster M., Mira d’Ercole Marco, Oxley H., (1998) "Income Distribution And Poverty In Selected OECD Countries", OECD Economics Department Working papers No. 189. Calderon, C., Chong, A., (2001) "External Sector and Income Inequality in Interdependent Economies Using a Dynamic Panel Approach", Economics Letters 71 (2), 225-231. Chakrabarti, A., (2000) "Does trade cause inequality", Journal of Economic Development 25 (2). Davis, D.R., (1996) "Trade liberalization and income distribution", NBER Working Paper 5693. Davis, D.R., Weinstein, D.E., (1998) "An account of global factor trade", NBER Working Paper 6785. Davis D.R., Weinstein D.E. (2003), "The factor content of trade", in E. Kwan Choi and James Harrigan eds., Handbook of International Trade, Malden, Mass: Blackwell Publisher. Deardorff, A.V., (2000), "Factor prices and the factor content of trade revisited: what’s the use?", Journal of International Economics 50(1), 73-90. Deininger, K., Olinto P., (2000) "Asset Distribution, Inequality and Growth", Development Research Group Working Paper, N°2375, World Bank: Washington D.C.. Deininger, K., Squire L., (1996) "A New Data Set Measuring Income Inequality", The World Bank Economic Review 10 (3), 565-91. Deininger K., Squire L., (1998) "New ways of looking at old issues : inequality and growth", Journal of Development Economics, 57, 259-287. Dollar, D., Wolff, E., W. Baumol, (1989) "The factor-price equalization model and industry labor productivity: an empirical test across countries", in Feenstra, ed., Empirical Methods for International Trade, 23-48. 35
CEPII, Working Paper No. 2005-17
Dornbush, R., Fisher, S., Samuelson, P., (1980) "Heckscher-Ohlin Trade Theory with a Continuum of Goods", Quarterly Journal of Economics, 95, 203-224. Eaton, J., (1987) "A dynamic specific factors model of international trade", Review of Economic Studies, VLIV, 325–338. Edwards, S., (1997) "Trade Policy, Growth, and Income Distribution", American Economic Review 87(2), 205-210. Ethier, W. J., (1974) "Some of the Theorems of International Trade With Many Goods and Factors", Journal of International Economics, vol. 4, pp. 199-206. Ethier, W. J., (1984) "Higher dimensional issues in trade theory", in R. W. Jones and P. B. Kenen, eds., Handbook of International Economics, North-Holland, Amsterdam, 131-184. Fischer, R.D., (2001) "The evolution of inequality after trade liberalization", Journal of Development Economics, 66 (2), 555-579. Knowles, S., (2001) "Inequality and Economic Growth: The Empirical Relationship Reconsidered in the Light of Comparable Data", UNU/WIDER Discussion Paper, N°2001/128, November. Krugman, P. R., (2000) "Technology, Trade and Factor Prices", Journal of International Economics 50(1), 51-72. Leamer, E., (2000) "What’s the Use of Factor Contents?", Journal of International Economics 50(1), 17-50. Li, H., Zou H., (1998) "Income inequality is not harmful for growth: theory and evidence", Review of Development Economics, 2, 318-334. Li, H., Squire L., Zou H., (1998) "Explaining international and intertemporal variations in income inequality", The Economic Journal, Vol. 108, N° 446, Jan., 26-43. Lundberg, M., Squire, L., (1999) "The simultaneous evolution of growth and inequality", mimeo World Bank. Milanovic, B., (2002) "Can we Discern the Effect of Globalization on Income Distribution? Evidence from Household Budget Surveys", World Bank Policy Research Working Paper 2876, April. Panagariya, A., (2000) "Evaluating the factor-content approach to measuring the effect of trade on wage inequality", Journal of International Economics 50(1), 91-116. Ravallion, M., (2003) "Inequality convergence", Economics Letters 80, 351–356. 36
International Trade and Income Distribution: Reconsidering the Evidence
Rodriguez, F., Rodrik, D., (2001) "Trade Policy and Economic Growth: A Skeptic's Guide to the Cross-National Evidence", Macroeconomics Annual 2000, eds. Ben Bernanke and Kenneth S. Rogoff, MIT Press for NBER, Cambridge, MA. Savvides, A., (1998) "Trade Policy and Income Inequality: New Evidence", Economics Letters 61 (3), 365-372. Schott, P.K., (2003) "One Size Fits All? Heckscher-Ohlin Specialization in Global Production", American Economic Review , June 93(2), 686-708. Spilimbergo, A., Londono, J.L., Székely, M., (1999) "Income distribution, factor endowments, and trade openness", Journal of Development Economics 59(1), 77-101. Trefler, D., (1995) "The case of the missing trade and others mysteries", The American Economic Review, December, 1029 – 1046. Trefler D., Zhu S.C., (2005), "The Structure of Factor Content Predictions", NBER Working Paper 11221. Wood, A., (1994) North-South Trade, Employment and Inequality : Changing Fortunes in a Skill-Driven World, Oxford, Clarendon Press. Wood, A., and Ridao-Cano, C., (1999) "Skill, trade and international inequality", Oxford Economic Papers 51, 89 – 119. Xu, B., (2003) "Capital Abundance and Developing Country Production Patterns", mimeo Department of Economics, University of Florida, April.
37
CEPII, Working Paper No. 2005-17
APPENDIX 1: RERUNNING SPILIMBERGO ET AL. (1999) ESTIMATION
Dependent variable: Gini
Ailt Aikt Aist Ailt * Open Aikt * Open Aist * Open Open Gdppc Gdppc 2 Constant Nb of observations
R2
(a) (b) (c) Spilimbergo et al. (1999) Regression in level Regression in variation Table 5, col. 1 2.0** 0.9 -7.8 11.1**
11.5**
-1.9
-3.1**
-4.8**
-2.7
-7.1**
-3.4**
1.2
-49.8**
-48.4**
2.6
18.1*
23.7**
0.6
12.0
12.4*
3.2
-0.004**
-0.004**
-0.002
1.5**
0.14**
0.08
54.1** 320 0.44
50.0** 325 0.40
0.11 118 0.09
Source: Spilimbergo et al. (1999) for column (a), authors' calculations for columns (b) and (c).
Indicators of relative scarcity are constructed as follows:
⎛ Eift Aift = ln⎜ * ⎜E ⎝ ft
⎞ ⎟ ⎟ ⎠
Eift is per capita endowment of factor f of country i in year t where l stands for arable land per capita (1995 World Bank Tables), k for capital per worker (1995 World Bank Tables), s for skilled labor defined as the proportion of population over the age of 25 with higher education (Barro and Lee, 1994).
E *ft is the world per capita effective endowment of factor f at time t, computed by weighting every country’s endowment by the population and by the degree of openness:
E *ft =
Xi + Mi GDPi Xi + Mi ∑i popi * GDP i
∑E i
ift
* popi *
where pop refers to the population, X to exports, and M to imports. 38
International Trade and Income Distribution: Reconsidering the Evidence
Open is defined (in this case) as
Xi + Mi , normalised so that the index ranges within the GDPi
interval [0,1] (Penn World Tables 1995). Gdppc is PPP-adjusted GDP per capita (Penn World Tables 1995).
39
CEPII, Working Paper No. 2005-17
APPENDIX 2: GINI INDEX AS A FUNCTION OF RELATIVE WAGES
The economy considered includes three categories of households. Within each category, households draw their income from one production factor only. As households own one unity of factor, they earn the same income within each category. In addition, non-educated workers are assumed to earn a lower income than educated workers, who themselves earn a lower income, compared to capital owners. Under these assumptions, the Lorenz curve is a spline with three different parts (see Figure A.1), and the Gini index can be calculated as follows:
G = 1 − (2a + 2b + 2c ) (A.1)
w w ⎡w 2⎤ = 1 − ⎢ ~UN sUN (2 − sUN ) + ~L s L (1 − sUN + s K ) + ~K s K ⎥ w w ⎦ ⎣ w
Hence: (A.2)
w w w G = ~UN sUN (sUN − 1) + ~L s L (sUN − s K ) + ~K s K (1 − s K ) w w w
As a consequence:
(A.3)
⎧ ∂G s L ⎪ ∂w = w ~ (sUN − s K − G ) ⎪ L ⎨ ⎪ ∂G = s K (1 − s − G ) K ~ ⎪⎩ ∂wK w
40
International Trade and Income Distribution: Reconsidering the Evidence
Figure A.1: Lorenz curve in the economy considered
wk − w L Sk w
c
w L − wU (S L + Sk ) w b
wU w a
Su
0 Su
Su + SL SL
41
SK
1
CEPII, Working Paper No. 2005-17
LIST OF WORKING PAPERS RECENTLY RELEASED BY CEPII
33
No
Title
Authors
2005-16
China and the Relationship between the Oil Price and the Dollar
A. Bénassy-Quéré, V. Mignon & A. Penot
2005-15
Consequences of Alternative Formulas for Agricultural Tariff Cuts
S. Jean, D. Laborde & W. Martin
2005-14
Is Erosion of Tariff Preferences a Serious Concern?
A. Bouët, L. Fontagné & S. Jean
2005-13
The Consequences of Agricultural Trade Liberalization for Developing Countries: Distinguishing Between Genuine Benefits and False Hopes
J. C.Bureau, S. Jean & A. Matthews
2005-12
From Bound Duties to Actual Protection: Industrial Liberalisation in the Doha Round
M.H. Bchir, L. Fontagné & S. Jean
2005-11
Impact de l'ouverture financière sur les inégalités internes dans les pays émergents
2005-10
Disentangling Horizontal and Vertical Intra-Industry Trade
2005-09
China's Integration in East Asia: Production Sharing, FDI & High-Tech Trade
2005-08
Tax Competition and Public Input
2005-07
Trade Liberalisation, Growth and Poverty in Senegal: A Dynamic Microsimulation CGE Model Analysis
2005-06
Migration, Trade and Wages
A. Bénassy-Quéré & V. Salins L. Fontagné, M. Freudenberg & G. Gaulier G. Gaulier, F. Lemoine D. Ünal-Kesenci A. Bénassy-Quéré, N. Gobalraja & A. Trannoy N. Annabi, F. Cissé, J. Cockburn & B. Decaluwé A. Hijzen & P. Wright
33
Working papers are circulated free of charge as far as stocks are available; thank you to send your request to CEPII, Sylvie Hurion, 9, rue Georges-Pitard, 75015 Paris, or by fax : (33) 01 53 68 55 04 or by e-mail sylvie.hurion @ cepii.fr. Also available on: \\www.cepii.fr. Working papers with * are out of print. They can nevertheless be consulted and downloaded from this website. 33
Les documents de travail sont diffusés gratuitement sur demande dans la mesure des stocks disponibles. Merci d’adresser votre demande au CEPII, Sylvie Hurion, 9, rue Georges-Pitard, 75015 Paris, ou par fax : (33) 01 53 68 55 04 ou par e-mail sylvie.hurion @ cepii.fr. Egalement disponibles sur : \\www.cepii.fr. Les documents de travail comportant * sont épuisés. Ils sont toutefois consultable sur le web CEPII.
42
International Trade and Income Distribution: Reconsidering the Evidence
2005-05
Institutional Determinants of Foreign Investment
A. Bénassy-Quéré, M. Coupet & T. Mayer
2005-04
L’économie indienne : changements structurels et perspectives à long terme
2005-03
Programme de travail du CEPII pour 2005
2005-02
Market Access in Global and Regional Trade
T. Mayer & S. Zignago
2005-01
Real Equilibrium Exchange Rate in China
V. Coudert & C. Couharde
2004-22
A Consistent, ad-valorem Equivalent Measure of Applied Protection Across the World: The MacMapHS6 Database
A. Bouët, Y. Decreux, L. Fontagné, S. Jean & D. Laborde
2004-21
IMF in Theory: Sovereign Debts, Judicialisation and Multilateralism
J. Sgard
2004-20
The Impact of Multilateral Liberalisation on European Regions: a CGE Assessment
S. Jean & D. Laborde
2004-19
La compétitivité de l'agriculture et des industries agroalimentaires dans le Mercosur et l'Union européenne dans une perspective de libéralisation commerciale
N. Mulder, A. Vialou, B. David, M. Rodriguez & M. Castilho
2004-18
Multilateral Agricultural Trade Liberalization: The Contrasting Fortunes of Developinc Countries in the Doha Round
A. Bouët, J.C. Bureau, Y. Decreux & S. Jean
2004-17
UK in or UK out? A Common Cycle Analysis between the UK and the Euro Zone
2004-16
Regionalism and the Regionalisation of International Trade
G. Gaulier, S. Jean & D. Ünal-Kesenci
2004-15
The Stock-Flow Approach to the Real Exchange Rate of CEE Transition Economies
B. Egert, A. Lahrècche-Révil & K. Lommatzsch
2004-14
Vieillissement démographique, épargne et retraite : une analyse à l’aide d’un modèle d’équilibre général à agents hétérogènes
C. Bac & J. Chateau
2004-13
Burden Sharing and Exchange-Rate Misalignments within the Group of Twenty
A. Bénassy-Quéré, P. Duran-Vigneron, A. Lahrèche-Révil & V. Mignon
2004-12
Regulation and Wage Premia
S. Chauvin & F. Lemoine
J. Garnier
S. Jean & G. Nicoletti 43
CEPII DOCUMENTS DE TRAVAIL / WORKING PAPERS
Si vous souhaitez recevoir des Documents de travail, merci de remplir le coupon-réponse ci-joint et de le retourner à : Should you wish to receive copies of the CEPII’s Working papers, just fill the reply card and return it to:
Sylvie HURION – Publications CEPII – 9, rue Georges-Pitard – 75740 Paris – Fax : (33) 1.53.68.55.04 M./Mme / Mr./Mrs .................................................................................................................. Nom-Prénom / Name-First name ............................................................................................. Titre / Title ............................................................................................................................... Service / Department................................................................................................................ Organisme / Organisation ........................................................................................................ Adresse / Address..................................................................................................................... Ville & CP / City & post code.................................................................................................. Pays / Country.............................................................. Tél...................................................... Désire recevoir les Document de travail du CEPII n° : Wish to receive the CEPII’s Working Papers No:.................................................................. .................................................................................................................................................. .................................................................................................................................................. .................................................................................................................................................. .................................................................................................................................................. .................................................................................................................................................. .................................................................................................................................................. .................................................................................................................................................. ..................................................................................................................................................
F
Souhaite être placé sur la liste de diffusion permanente (pour les bibliothèques) Wish to be placed on the standing mailing list (for Libraries).